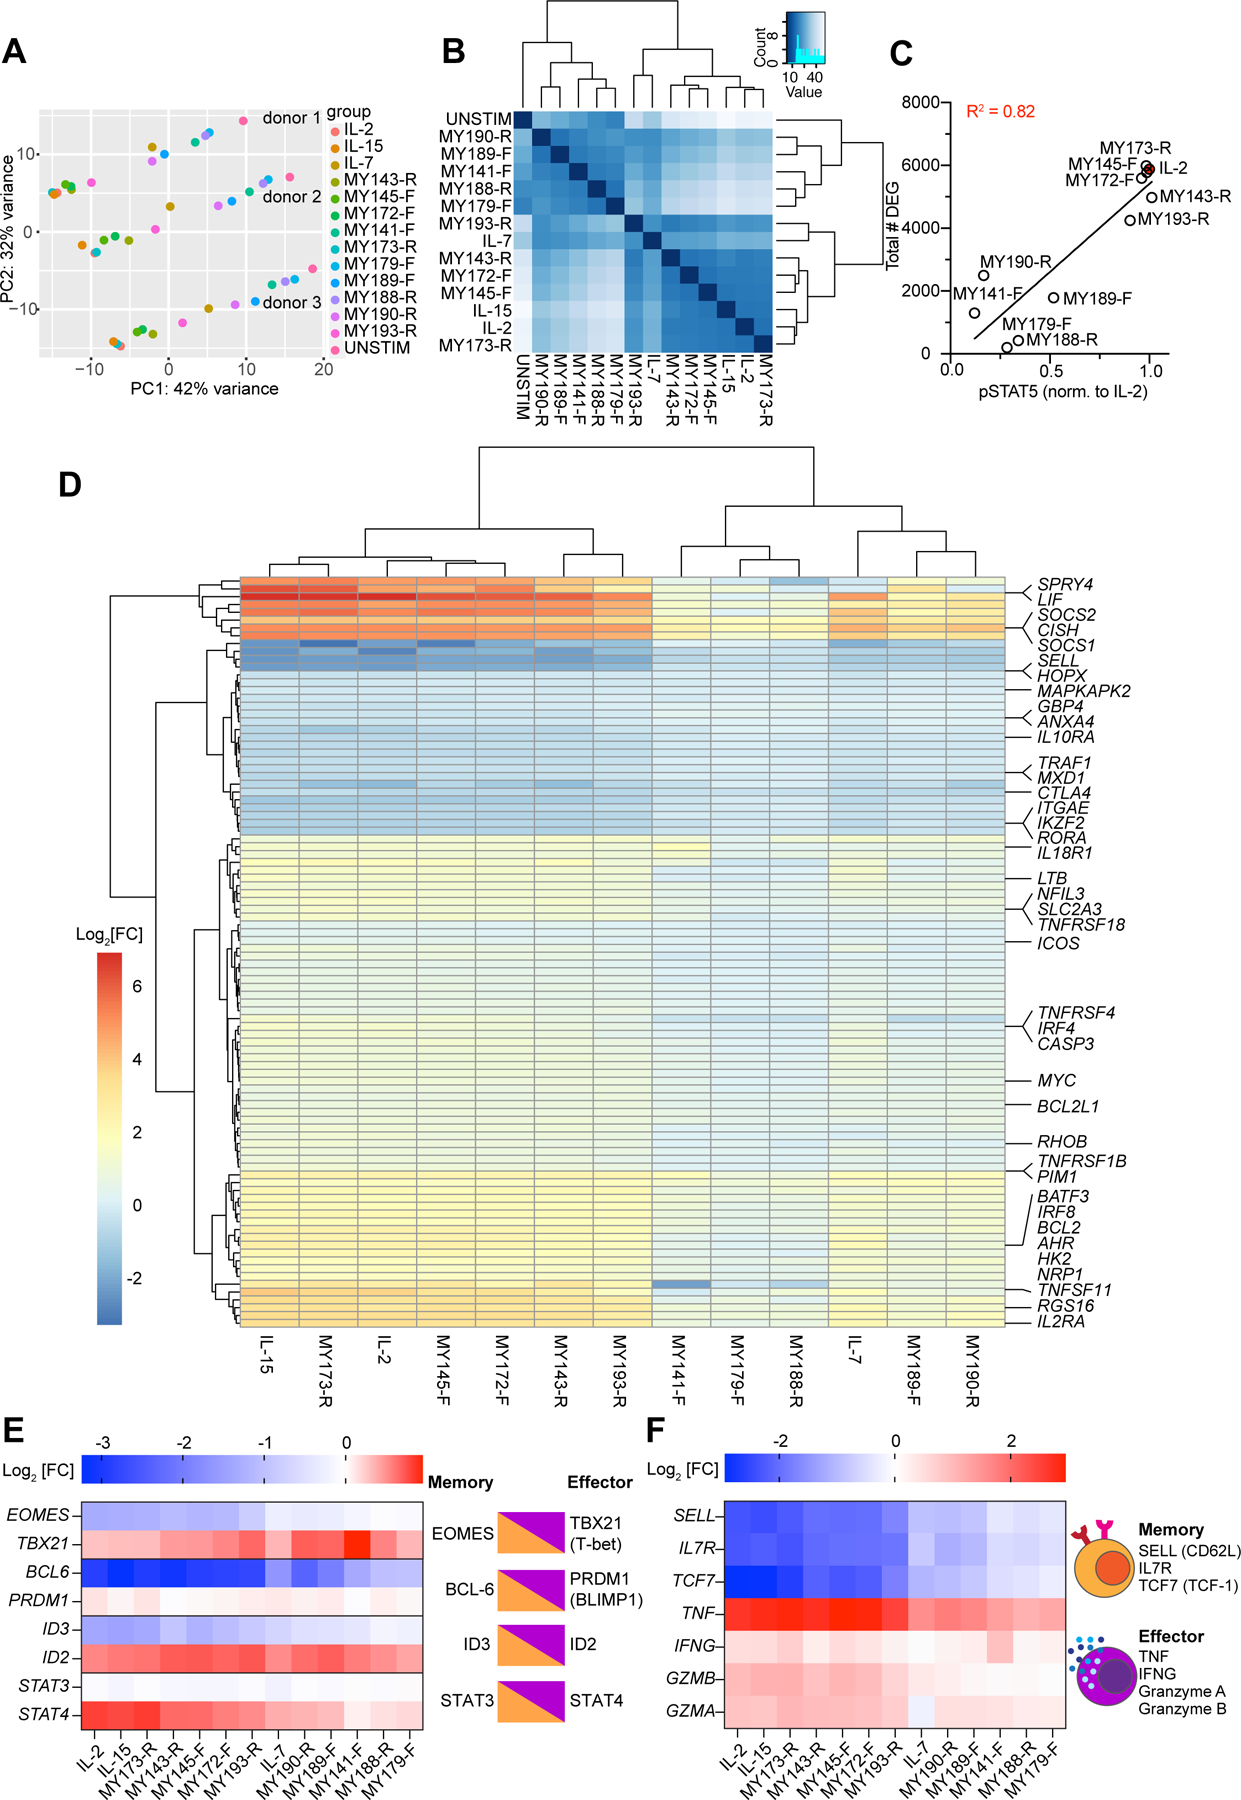
Figure 4. Transcriptional profiling of IL-2 surrogate agonists.

(A) Principal component analysis (PCA) of gene expression in CD8+ T cells from 3 donors stimulated with IL-2 or surrogate ligands for 24 hours. Samples from a given donor lie along a horizontal line, with unstimulated samples at the right and IL-2/IL-15 treated samples at the left. The effect of various ligand stimulations is largely described by PC1. (B) Euclidean distance matrix showing overall similarities in mRNA expression between treatment conditions. Samples within the same treatment condition were pooled together. Dendrograms depict the results of unsupervised hierarchical clustering between samples, with the branch length being proportional to the distance between samples. (C) Relationship between surrogate ligand pSTAT5 activity and the total number of differentially expressed genes (DEG) induced by ligand stimulation. STAT5 phosphorylation was normalized to that of hIL-2 stimulated cells. (D) Hierarchical clustering of “Hallmark” STAT5 targets (curated by mSigDB) (Liberzon et al., 2015; Subramanian et al., 2005) whose expression was significantly altered by treatment cytokine or surrogate agonist treatment (padj < 0.05). Differential gene expression is represented as the log2 fold-change (Log2[FC]) of normalized mRNA counts. Genes are arrayed by row and ligands by column. (E) Log2 fold expression change of transcription factors which play opposing roles in CD8+ memory vs. effector differentiation. Opposing transcription factor pairs are diagrammed (right) with the accompanying log2 fold changes induced by surrogate ligands (left). (F) Log2 fold expression change of selected markers of memory and effector T cells (left). Memory T cells express CD62L (encoded by SELL), IL7 receptor, and the transcription factor TCF1 (encoded by TCF7), whereas effector CD8+ T cells produce abundant amounts of cytokines TNFα and IFNγ and cytolytic molecules such as granzymes A and B (right).
