ABSTRACT
Background
Anti-neutrophil cytoplasmic antibody (ANCA)-associated vasculitis (AAV) is implicated in elevating the risk for cardiovascular (CV) disease; whether the elevated risk applies to all types of CV diseases or specific types is unclear. This study examined the association of AAV and adverse CV outcomes compared with the non-AAV population.
Methods
We conducted a population-based, retrospective cohort study of adults (mean age 61 years, 51% female) with a new diagnosis of AAV in Ontario, Canada from 2007 to 2017. Weighted models were used to examine the association of AAV (n = 1520) and CV events in a matched (1:4) control cohort (n = 5834). The main outcomes were major adverse CV events (MACE), defined as myocardial infarction (MI), stroke or CV death, its components, atrial fibrillation (AF) and congestive heart failure (CHF).
Results
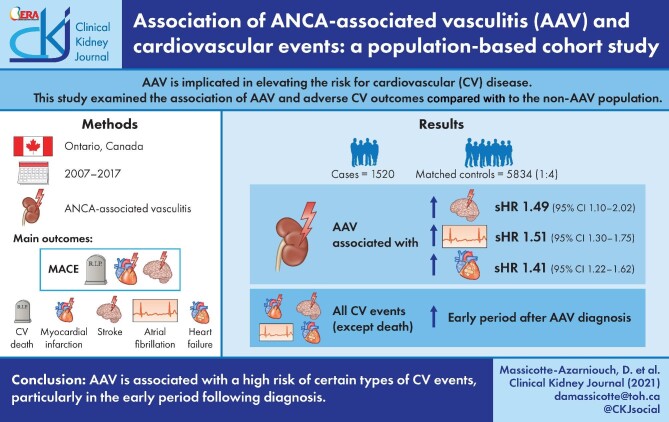
Over a mean follow-up of 3.8 years, AAV (compared with non-AAV) was associated with a higher risk of stroke: cumulative incidence 7.0% versus 5.2%, sub-distribution hazard ratio (sHR) 1.49 [(95% confidence interval (95% CI) 1.10–2.02]; AF: cumulative incidence 16.4% versus 11.5%, sHR 1.51, 95% CI 1.30–1.75; and CHF: cumulative incidence 20.8% versus 13.3%, sHR 1.41, 95% CI 1.22–1.62; but not for MACE, MI or CV death. The risks for all CV events, except CV death, were significantly elevated in the early period after AAV diagnosis, in particular AF (365-day sHR 2.06, 95% CI 1.71–2.48; 90-day sHR 3.33, 95% CI 2.66–4.18) and CHF (365-day sHR 1.75, 95% CI 1.48–2.07; 90-day sHR 2.65, 95% CI 2.15–3.26).
Conclusion
AAV is associated with a high risk of certain types of CV events, particularly in the early period following diagnosis.
Keywords: ANCA-associated vasculitis, atrial fibrillation, cardiovascular events, congestive heart failure
Graphical Abstract
Graphical Abstract.
INTRODUCTION
Anti-neutrophil cytoplasmic antibody (ANCA)-associated vasculitis (AAV) is a systemic inflammatory disease causing small vessel inflammation and organ damage [1]. Historically often fatal if untreated, current therapies achieve initial disease control in the majority of cases [2–4]. However, patients with AAV may be at higher risk for chronic diseases due to residual organ damage from AAV or its therapies [5–7]. The degree to which these indirect complications of AAV contribute to excess morbidity and mortality remains uncertain.
Cardiovascular (CV) disease appears to be a major contributor to excess mortality in AAV in the long-term [7, 8]. To better inform risk factor reduction, treatment and future CV trials in AAV, a broader understanding of the distinct types of CV illnesses and their timing of onset in AAV is required.
The objective of this study was to examine the risks for specific types of CV diseases and the periods of heightened risk in patients with AAV. Specifically, we examined the association of AAV with major adverse CV events [MACE; composite of myocardial infarction (MI), stroke/transient ischemic attack (TIA) and CV death], its individual components, atrial fibrillation (AF) and congestive heart failure (CHF), compared with non-AAV patients using population-based administrative healthcare data. We hypothesized that patients with AAV would be at greater risk for CV events compared with those without AAV and that the risk would be highest in the first year following diagnosis when AAV is most active.
MATERIALS AND METHODS
Study design and setting
We conducted a population-based, retrospective cohort study using health administrative databases housed at the Institute for Clinical Evaluative Sciences (ICES), in the province of Ontario, Canada. The use of data in this project was authorized under Section 45 of Ontario's Personal Health Information Protection Act, which does not require review by a Research Ethics Board. The reporting of this study follows guidelines for observational studies [9]. Details of the data sources used for this study are provided in Supplementary data, Table S1.
Population and study cohort
All adults (≥18 years) with a serum creatinine measurement, in-patient or out-patient (closest value to index date, defined below, in the 2 years prior to 30 days after), between 1 January 2007 (date since when serum creatinine has been captured in the Ontario Laboratory Information System) and 31 December 2017 who reside in Ontario, Canada were included. We excluded: (i) age <18 or >95 years at index date; (ii) diagnosis of AAV prior to index date (see Supplementary data, Table S2); (iii) end-stage kidney disease (ESKD) prior to index date (defined as at least two outpatient claims for dialysis at least 90 days apart) and (iv) kidney transplant prior to index date.
Exposure and control groups
Patients with AAV were defined as any individual with a hospitalization or emergency room visit with a diagnosis of AAV [International Classification of Diseases 10th Revision (ICD10) AAV diagnostic code in any position; see Supplementary data, Table S3]. The ICD10 AAV codes have been shown to have a sensitivity, specificity and positive predictive value (PPV) of 52.6%, 93.1% and 89.0%, respectively [10]. The study index date was defined as the first hospitalization or emergency room visit with an AAV diagnostic code (incident AAV). Individuals with AAV were matched to controls without AAV in a 1:4 ratio based on age (±2 years), sex, estimated glomerular filtration rare (eGFR; ± 5 mL/min by Chronic Kidney Disease Epidemiology Collaboration), income quintile, rurality status and number of hospitalizations in the 3 years prior to index date (exact). The control group index date was obtained by randomly sampling the times from serum creatinine to index date in the AAV group and applying this to serum creatinine measurements in the control group. Censoring occurred at the first study outcome event, death, emigration from province or end of follow-up (end of study period: March 31 2019).
Outcomes
The study outcomes of interest were: MACE (composite of MI, stroke/TIA and CV death), its individual components, AF and CHF. Outcomes were defined by validated ICD discharge codes (see outcomes definitions with validation studies in Supplementary data, Table S4). We also examined all-cause mortality and ESKD as exploratory outcomes.
Baseline characteristics
The following characteristics were ascertained at index date for each study participant: age, sex, rural residence, neighbourhood income quintile, serum creatinine (and eGFR) defined as the closest value to index date in the 2 years prior to 30 days after index date, comorbidities [diabetes, hypertension, CHF, coronary artery disease, coronary artery bypass graft (CABG), AF, arrhythmia, peripheral vascular disease (PVD), chronic obstructive pulmonary disease (COPD), chronic liver disease, osteoarthritis and major cancer], 5-year look back and healthcare utilization [hospital admissions, emergency department (ED) visits, GP visits, nephrologist visits, rheumatologist visits, cardiologist visits] and 1-year look back.
Statistical analysis
Since individuals with AAV differ significantly from those without AAV, we undertook measures to reduce residual confounding. Along with greedy matching AAV in a 1:4 ratio with controls as detailed above, we used overlap propensity score (PS) weighting to create balance between the analytical study groups (AAV versus controls). A PS for AAV exposure was calculated followed by overlap-weighted analyses. Overlap weighting assigns each individual a weight of 1 – PS if they are exposed (AAV) and PS if they are unexposed (controls). In estimating hazard ratios, overlap weights assign less weight to observations with extreme propensity scores and more weight to those with propensity scores close to 0.5 (see Supplementary data, Figure S1). This method creates a balanced cohort in terms of the baseline variables included to calculate the propensity score and does not exclude any potential study participants nor is it affected by extreme outliers over-dominating the analysis as can happen with inverse probability treatment weighting [11–13].
Baseline characteristics were examined pre- and post-weighting to assess for imbalance using standardized differences. Standardized differences describe differences between group means or proportions relative to the pooled standard deviation (SD) and are less sensitive to large sample sizes than traditional hypothesis testing [14]. A potentially important difference is considered to be 0.10 or greater [15]. We calculated the crude counts, cumulative incidence and incidence rates (IR) for outcomes. We used Fine and Gray models, which account for informative censoring and the competing risk of non-CV death [16, 17], to calculate sub-distribution hazard ratios (sHR), after overlap weighting, for all outcomes other than all-cause mortality where Cox proportional hazards models were used. The 95% confidence intervals (CIs) were estimated using bootstrapping to account for variability in the propensity scores used for weighting [18]. To examine if the CV risk differs in the early period after AAV diagnosis, as suggested by prior studies [19, 20], we also limited follow-up to 365 days after index date. After seeing a very early separation in cumulative incidence curves for most CV outcomes, we decided to also examine results limited to 90-day follow-up, since this is when AAV tends to be most active. All analyses were conducted with SAS Enterprise Guide 7.15 (SAS Institute Inc., Cary, NC, USA). Confidence intervals that did not overlap with 1 or P ≤ 0.05 was considered statistically significant.
Additional analyses
We performed the following additional analyses. Firstly, we examined a more rigorous diagnosis of AAV defined as any hospitalization or ED visit with a diagnosis of AAV or nephritis (ICD10 code in any position; see Supplementary data, Table S3) and a positive ANCA serology (defined as a value above the manufacturer recommended reference range for the test used) within 365 days before or after the ICD10 diagnosis date. The addition of a positive ANCA serological test to an ICD diagnostic code has been shown to improve the accuracy for identifying AAV compared with only using ICD codes [10, 21]. This ‘serological’ AAV cohort was similarly 1:4 matched to controls and we analyzed the IRs for outcomes. Secondly, we repeated our analyses after excluding any outcomes occurring during the index hospitalization.
RESULTS
Study cohort and baseline characteristics
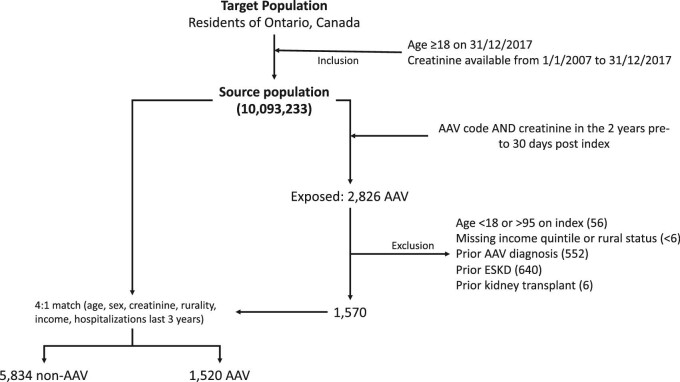
The study population consisted of 1520 patients with AAV and 5834 matched controls (Figure 1). For the study population, the mean duration of follow-up was 1387 days, mean age was 61 years, 51% were female, mean eGFR was 63 mL/min, 34% had a previous diagnosis of diabetes and 60% had a previous diagnosis of hypertension (Table 1). Overlap propensity score weighting led to no significant imbalances between AAV and non-AAV groups except for index year (see Table 1 and Supplementary data, Figure S1).
FIGURE 1:
Study flow chart. Flow chart of cohort creation for the study project, with inclusion and exclusion criteria, from target population, to source population and then exposure and control group populations.
Table 1.
Baseline characteristics of the study cohort
| Variable | Controls (n = 5834)a | AAV (n = 1520) | Standardized difference (pre-weighting)b | Standardized difference (weighted) |
|---|---|---|---|---|
| Age at index date, mean (SD) | 61.1 (17.3) | 60.8 (17.4) | 0.01928 | 0.000010 |
| Female, % | 50.5 | 50.5 | 0.00093 | 0.000000 |
| Baseline eGFR, mean (SD) | 62.9 (34.4) | 61.7 (34.9) | 0.03357 | 0.000017 |
| eGFR at baseline <15, % | 7.7 | 9.1 | 0.04925 | 0.000011 |
| eGFR at baseline 15–29, % | 16.3 | 16.3 | 0.00179 | 0.000010 |
| eGFR at baseline 30–59, % | 23.9 | 24.1 | 0.00586 | 0.000003 |
| eGFR at baseline 60–89, % | 24.2 | 23.3 | 0.02227 | 0.000010 |
| eGFR at baseline ≥90, % | 27.9 | 27.2 | 0.01644 | 0.000009 |
| Income quintile 1, % | 20.7 | 20.8 | 0.00205 | 0.000005 |
| Income quintile 2, % | 18.9 | 18.8 | 0.00144 | 0.000001 |
| Income quintile 3, % | 19.9 | 19.7 | 0.00490 | 0.000001 |
| Income quintile 4, % | 22.0 | 22.2 | 0.00349 | 0.000001 |
| Income quintile 5, % | 18.5 | 18.6 | 0.00060 | 0.000004 |
| Rural living, % | 12.0 | 12.7 | 0.02071 | 0.000003 |
| Index date fiscal year 2006, % | 0 | < 0.4 | 0.03629 | 0.032452 |
| Index date fiscal year 2007, % | 1.4 | 1.1 | 0.03204 | 0.070778 |
| Index date fiscal year 2008, % | 4.3 | 4.1 | 0.01115 | 0.043811 |
| Index date fiscal year 2009, % | 7.0 | 7.5 | 0.02021 | 0.036131 |
| Index date fiscal year 2010, % | 7.2 | 7.8 | 0.02343 | 0.003075 |
| Index date fiscal year 2011, % | 6.8 | 9.0 | 0.08257 | 0.070839 |
| Index date fiscal year 2012, % | 8.1 | 10.2 | 0.07314 | 0.056 474 |
| Index date fiscal year 2013, % | 9.7 | 10.4 | 0.02363 | 0.028 870 |
| Index date fiscal year 2014, % | 12.0 | 12.8 | 0.02374 | 0.048566 |
| Index date fiscal year 2015, % | 14.0 | 12.2 | 0.05437 | 0.045784 |
| Index date fiscal year 2016, % | 15.6 | 12.9 | 0.07693 | 0.035369 |
| Index date fiscal year 2017, % | 14.0 | 12.1 | 0.05737 | 0.015663 |
| Hospitalizations in year prior to baseline, mean (SD) | 1.2 (1.4) | 1.8 (1.4) | 0.41933 | 0.000043 |
| ED visits in year prior to baseline, mean (SD) | 1.5 (2.4) | 2.9 (3.3) | 0.48539 | 0.000045 |
| Visits to cardiologist in year prior to baseline, mean (SD) | 2.0 (4.2) | 2.3 (4.1) | 0.07048 | 0.000021 |
| Visits to nephrologist in year prior to baseline, mean (SD) | 0.9 (2.7) | 1.6 (4.1) | 0.21164 | 0.000014 |
| Visits to rheumatologist in year prior to baseline, mean (SD) | 0.2 (1.4) | 1.3 (3.1) | 0.46540 | 0.000012 |
| Diabetes mellitus, % | 35.3 | 30.2 | 0.10946 | 0.000009 |
| Hypertension, % | 60.3 | 57.9 | 0.04897 | 0.000012 |
| Ischemic stroke, % | 3.4 | 3.4 | 0.00039 | 0.000007 |
| Myocardial infarction, % | 6.8 | 5.3 | 0.06343 | 0.000009 |
| Arrhythmia, % | 14.0 | 15.9 | 0.05327 | 0.000017 |
| Atrial fibrillation, % | 9.8 | 11.0 | 0.04047 | 0.000014 |
| Congestive heart failure, % | 17.9 | 19.5 | 0.03961 | 0.000018 |
| Coronary artery disease, % | 24.4 | 21.5 | 0.06889 | 0.000010 |
| CABG, % | 2.0 | 1.1 | 0.07158 | 0.000001 |
| PVD, % | 2.2 | 1.3 | 0.06577 | 0.000004 |
| COPD, % | 8.2 | 12.0 | 0.12579 | 0.000015 |
| Major cancer, % | 17.5 | 19.1 | 0.04128 | 0.000010 |
| Chronic liver disease, % | 8.5 | 9.1 | 0.02451 | 0.000007 |
| Osteoarthritis, % | 7.9 | 5.8 | 0.08246 | 0.000003 |
Matched 4:1 to patients with AAV on age, sex, serum creatinine, income quintiles, rurality status and number of hospitalizations in the 3 years prior to index date.
SD >0.1 were considered significant.
CV risk in AAV
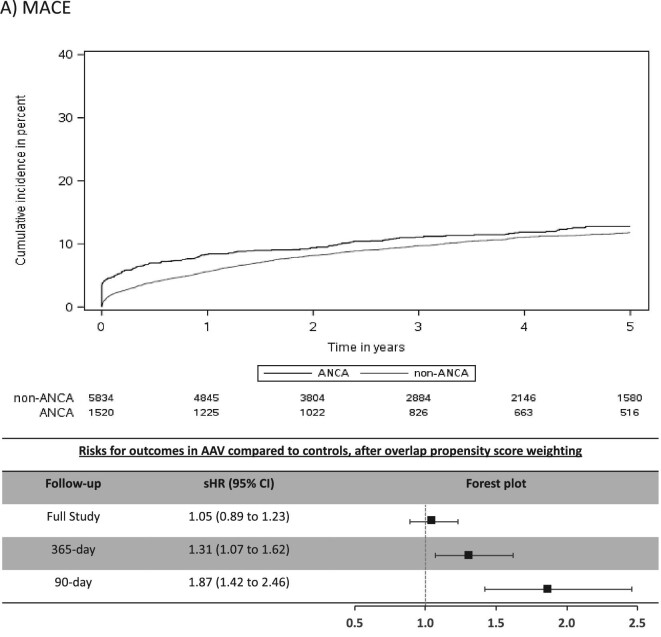
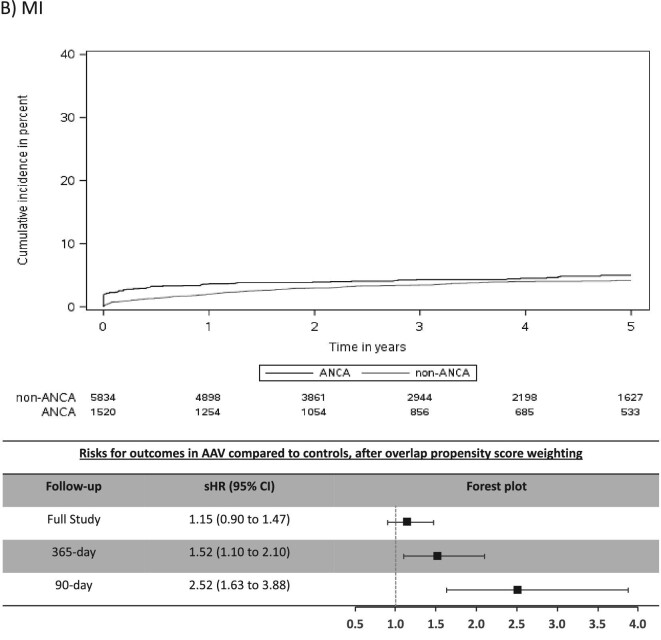
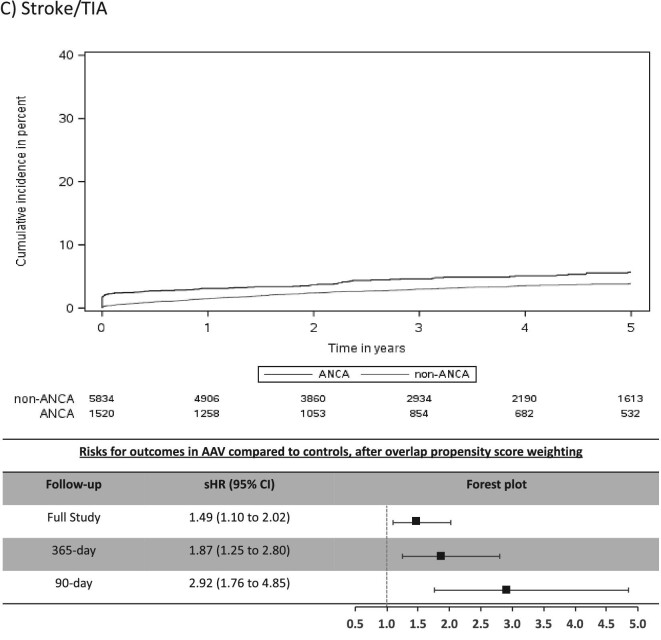
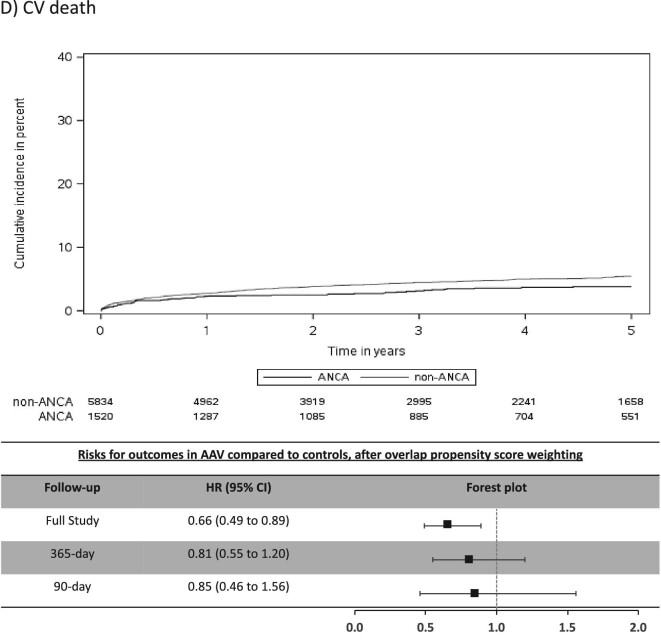
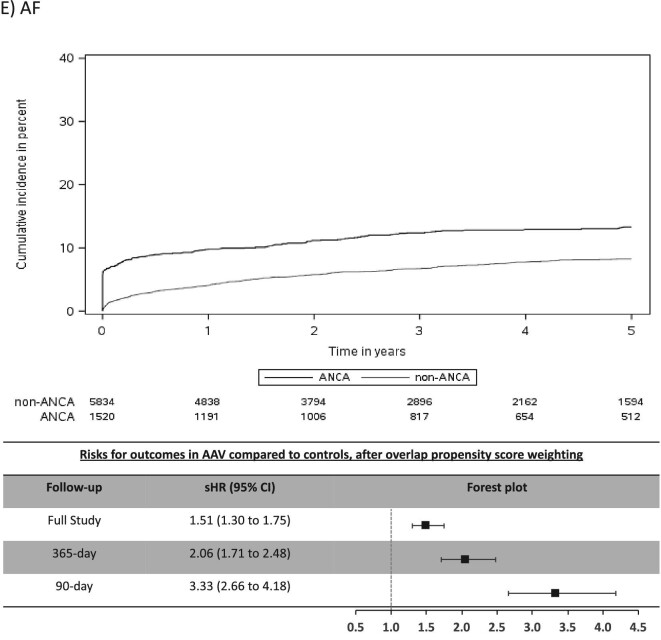
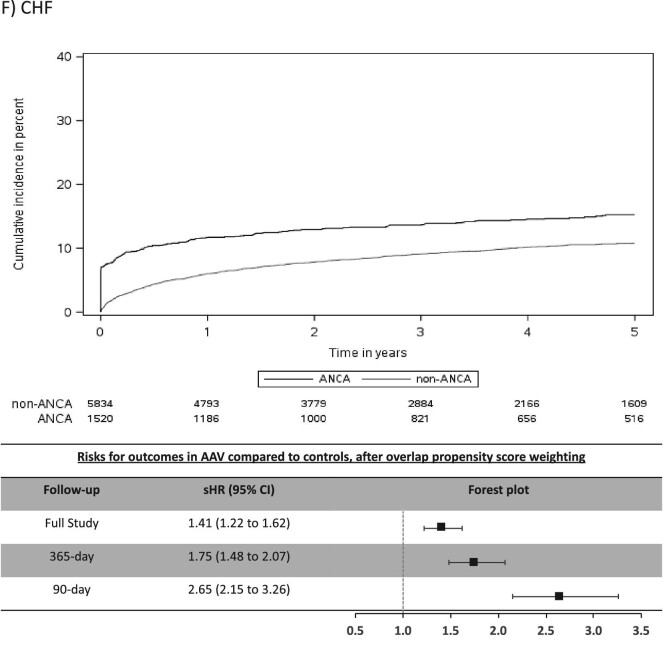
The mean (SD) days of follow-up for the full study period was 1522 (1084) in AAV and 1352 (996) in non-AAV. The cumulative incidence for CV outcomes in AAV was 15.4% for MACE, 6.6% for MI, 7.0% for stroke/TIA, 4.1% for CV death, 16.4% for AF and 20.8% for CHF (Table 2). Individuals with AAV were found to be at significantly higher risk (sHR, 95% CI) for stroke/TIA (1.49, 1.10–2.02), AF (1.51, 1.30–1.75) and CHF (1.41, 1.22–1.62), whereas there was no significantly increased risk for MACE, MI or CV death (Figure 2).
Table 2.
Event counts and cumulative incidence for CV events at full study, 365-day and 90-day follow-up for AAV (n = 1520) compared with controls (n = 5834)
| Follow-up | Group | Events | Cumulative incidence (%) | Crude IR (per 1000 person-years) | |
|---|---|---|---|---|---|
| MACE | Full study | Controls | 642 | 15.1 | 30.72 |
| AAV | 192 | 15.4 | 32.13 | ||
| 365-day | Controls | 326 | 5.6 | 63.25 | |
| AAV | 126 | 8.3 | 96.98 | ||
| 90-day | Controls | 162 | 2.8 | 119.81 | |
| AAV | 89 | 5.9 | 260.68 | ||
| MI | Full study | Controls | 234 | 5.8 | 11.00 |
| AAV | 77 | 6.6 | 12.54 | ||
| 365-day | Controls | 115 | 2.0 | 22.18 | |
| AAV | 54 | 3.6 | 40.71 | ||
| 90-day | Controls | 53 | 0.9 | 39.08 | |
| AAV | 42 | 2.8 | 120.67 | ||
| Stroke/TIA | Full study | Controls | 205 | 5.2 | 9.66 |
| AAV | 85 | 7.0 | 13.81 | ||
| 365-day | Controls | 85 | 1.5 | 16.36 | |
| AAV | 47 | 3.1 | 35.35 | ||
| 90-day | Controls | 37 | 0.6 | 27.23 | |
| AAV | 37 | 2.4 | 106.27 | ||
| CV death | Full study | Controls | 285 | 6.2 | 13.20 |
| AAV | 54 | 4.1 | 8.53 | ||
| 365-day | Controls | 158 | 2.7 | 30.21 | |
| AAV | 34 | 2.2 | 25.06 | ||
| 90-day | Controls | 85 | 1.5 | 62.36 | |
| AAV | 17 | 1.1 | 47.90 | ||
| AF | Full study | Controls | 460 | 11.5 | 21.95 |
| AAV | 205 | 16.4 | 34.87 | ||
| 365-day | Controls | 236 | 4.1 | 46.02 | |
| AAV | 148 | 9.8 | 117.21 | ||
| 90-day | Controls | 131 | 2.2 | 97.37 | |
| AAV | 124 | 8.2 | 373.32 | ||
| CHF | Full study | Controls | 598 | 13.3 | 28.57 |
| AAV | 240 | 20.8 | 40.94 | ||
| 365-day | Controls | 350 | 6.0 | 68.54 | |
| AAV | 177 | 11.7 | 141.05 | ||
| 90-day | Controls | 170 | 2.9 | 126.52 | |
| AAV | 143 | 9.4 | 435.15 |
FIGURE 2:
Cumulative incidence function curves and forest plots with adjusted risks for outcomes. Cumulative incidence curves for each CV outcome by AAV status, along with forest plots of the sHR or outcomes in AAV group for 90-day, 365-day and full-study follow-up time. The sHR are adjusted for index year due to imbalances in this baseline characteristics between the two groups despite overlap propensity weighting. (A) MACE; (B) MI; (C) stroke/TIA; (D) CV death; (E) AF; (F) CHF.
Early risk period after AAV diagnosis
Most CV events occurred in the early period after AAV diagnosis (Table 2) and this was a period of heightened risk. In the first 365 days after diagnosis, AAV was associated with an increased risk (sHR, 95% CI) for MACE (1.31, 1.07–1.62), MI (1.52, 1.10–2.10), stroke/TIA (1.87, 1.25–2.80), AF (2.06, 1.71–2.48) and CHF (1.75, 1.48–2.07), but not for CV death (Figure 2). CV risks were predominantly elevated in the first 90 days of diagnosis of AAV, particularly for AF and CHF, where the sHR (95% CI) was 3.33 (2.66–4.18) for AF and 2.65 (2.15–3.26) for CHF (Table 2 and Figure 2).
All-cause mortality and ESKD in AAV
The cumulative incidences and IRs for all-cause mortality and ESKD were similar between AAV patients and controls. AAV was associated with a lower all-cause mortality throughout the full study follow-up (HR 0.82, 95% CI 0.74–0.90), in the first 365 days (HR 0.82, 95% CI 0.71–0.95) and in the first 90 days (HR 0.82, 95% CI 0.66–1.01) after AAV diagnosis. The risks for ESKD were not significantly different between AAV patients and controls regardless of follow-up time (Supplementary data, Table S5).
Additional analysis
Using our more stringent AAV diagnosis definition incorporating a positive ANCA serology (n = 89; Supplementary data, Figure S2), individuals with AAV demonstrated similarly elevated rates for CV events in the period after AAV diagnosis as was seen in the original analysis (Supplementary data, Table S6 and Figure S3). After excluding events captured during the index hospitalization of AAV diagnosis, the risks for each outcome attenuated, but remained elevated for AF and CHF (Supplementary data, Table S7).
DISCUSSION
In this population-based, cohort study of 1520 individuals with incident AAV diagnosed during a hospital encounter and followed for a mean duration of 3.8 years, we found similar rates of MACE and MI, but higher rates of stroke/TIA (1.5-fold risk), AF (1.5-fold risk) and CHF (1.4-fold risk) in those with AAV compared with controls matched on important prognostic variables. The majority of excess risk occurred immediately after the diagnosis of AAV, particularly for AF and CHF. At 90 days a 3.3-fold risk for AF and 2.7-fold risk for CHF were observed for individuals with AAV and by 1-year these attenuated to a 2.1-fold and 1.8-fold risk for AF and CHF, respectively. Our study reveals important, under-recognized adverse CV outcomes associated with AAV and identifies a key period of heightened risk.
Our findings are consistent with and expand on previous studies examining CV risks in AAV, underscoring the high-risk nature of this population for adverse CV outcomes. Long-term follow-up of clinical trials in AAV demonstrated CV disease as a major contributor to mortality after 1 year [7]. We found that individuals with AAV have high rates of CV events immediately after the diagnosis of AAV, comparable to previous observational studies [19, 20, 22–24]. Furthermore, our finding of a cumulative incidence of 15.4% for MACE over approximately 4 years identifies individuals with AAV as being high-risk for CV events [25, 26], and they appear to be at an especially high risk for AF and CHF. A case-control study recently reported 2.9-fold odds for AF with small-vessel vasculitis [27]. Berti et al. reported 10-year cumulative incidences for AF and CHF of 14.4% and 20.0%, respectively [24]. Both of these studies were small cohorts with few events and the case-control study included other types of vasculitis. Our findings in 1520 individuals with AAV capturing over 200 events each of AF and CHF are consistent with the previous smaller studies and demonstrate high rates of AF and CHF, particularly in the period immediately following AAV diagnosis. Monitoring, heightened awareness and multi-disciplinary care could improve morbidity related to these under-recognized problems.
We found that individuals with AAV were at significantly higher risk for CV events compared with matched controls. Retrospective cohort studies found that AAV was associated with 1.5 to 3-fold greater risk for ischemic heart disease, MI and stroke, and that this was greatest in the first year after diagnosis, similar to our study [19, 20, 22–24]. Moreover, we demonstrated the first 3 months after onset of AAV as the most crucial period when individuals with AAV are at greatest risk for CV events. Although many CV events seemed to occur at time of AAV diagnosis, risk of AF and CHF remained elevated after excluding events occurring during the index AAV hospitalization. When an individual is diagnosed with AAV, this has likely been active for weeks to months prior to diagnosis, therefore it is likely that CV events diagnosed during the index hospitalization are a consequence of active vasculitis. That being said, the increased risk for AF and CHF even after excluding such events strengthens our study findings in regard to AF and CHF. To our knowledge, prior studies on CV risks in AAV did not address this issue.
There are multiple potential mechanisms for CVD in patients with AAV. First, glucocorticoids, a mainstay of treatment of AAV, are known to cause dyslipidemia and hypertension and are associated with coronary artery disease in patients with systemic inflammatory conditions [28–30]. Second, a systemic inflammatory response in of itself is thought to be a risk factor for CV disease, possibly mediated by inflammatory cytokines [31–33]. Third, in regard to stroke/TIA, the heightened early risk for AF may indicate cardioembolism as a culprit. Fourth, being a disease of small vessels, AAV causes direct endothelial damage that may promote diffuse atherosclerosis and vascular stiffening [34–37]. Such changes could directly affect coronary vessels and lead to increased strain on cardiac myocytes, predisposing to MI, AF and CHF. Interestingly, it has been suggested that endothelial damage may be reversible with suppression of inflammation in AAV [37]. Also, AAV often causes glomerulonephritis, manifesting with acute kidney injury and hypertension, both risk factors for CV events including AF and CHF [38–42]. Taken together, these hypotheses could explain why the highest risks for CV events occur in the early period following diagnosis, when organ involvement, systemic inflammation and doses of corticosteroids are at their highest.
Our study has limitations. First, since we defined AAV patients based on hospital ICD discharge codes, our findings may not be generalizable to individuals with less severe disease diagnosed in the outpatient setting. Second, as an observational study using administrative data, it has limitations inherent to the study design such as misclassification and unmeasured confounding (for example, we lacked certain clinical parameters such as the type of AAV organ involvement, or the types and doses of medications used for treatment). That being said, we used validated definitions for exposure and outcomes and the ICD10 AAV codes have a high specificity. Also, we undertook a number of measures to limit confounding including hard matching on a number of important risk factors for CVD, such as kidney function and the use of overlap propensity score weighting, a fairly new but recognized and valid method, to create near perfect balance in our analytical groups with regard to baseline characteristics [11–13, 43]. Third, since AAV is a treatable condition where the patient's clinical condition, including acute kidney injury, may improve with treatment, the controls matched on eGFR at time of AAV diagnosis may be at inherently greater risk for adverse outcomes since their kidney function would not be expected to improve. This could explain the unexpected lack of increased ESKD and lower all-cause and CV mortality in AAV. On the other hand, this means we had an appropriate high-risk control group whereby we were able to dampen the confounding effect from impaired kidney function, a major risk factor for CV disease. Finally, since AAV was diagnosed in hospital, there may be detection bias since an acutely ill individual with AAV is more likely to get diagnosed with a CV event than someone without AAV. We performed sensitivity analyses excluding events occurring on index hospitalization, thereby limiting detection bias, however we could not account for the more frequent follow-up afforded to individuals with new onset AAV and therefore cannot rule out the presence of detection bias.
CONCLUSION
In conclusion, individuals with incident AAV are at high risk for adverse CV events, in particular AF and CHF. These risks are highest in the immediate 3 months and 1 year following diagnosis. Our study demonstrates a key ‘high-risk window’ that should prompt careful monitoring for CV disease and aggressive risk factor reduction. Future prospective studies targeting the prevention of CV events in AAV may be warranted. This study highlights the complexity of caring for patients with AAV and additional benefits that may be derived from focused, multidisciplinary care in specialty clinics.
Supplementary Material
ACKNOWLEDGEMENTS
The Institute for Clinical Evaluative Sciences (ICES) supported this study, which is funded by an annual grant from the Ontario Ministry of Health and Long-Term Care (MOHLTC). The ICES Ottawa site completed this study. University of Ottawa, The Ottawa Hospital Research Institute (OHRI) and the Heart and Stroke Foundation of Canada provide core funding for ICES Ottawa. Members of the ICES Kidney, Dialysis and Transplantation team conducted the research. Parts of this material are based on data and/or information compiled and provided by the Canadian Institute for Health Information (CIHI) and by the ORGD, the original source of which is ServiceOntario. However, the analyses, conclusions, opinions and statements expressed herein are solely those of the authors and do not reflect those of the funding or data sources; no endorsement is intended or should be inferred. We thank IMS Brogan Inc. for use of their Drug Information Database. The Jindal Research Chair supports M.M.S. for the Prevention of Kidney Disease. M.W. is supported by a McMaster University Department of Medicine Clive Kearon Mid-Career Award.
Contributor Information
David Massicotte-Azarniouch, Department of Medicine, University of Ottawa, Ontario, Canada.
William Petrcich, Institute for Clinical Evaluative Sciences, Ottawa, Ontario, Canada.
Michael Walsh, Departments of Medicine and Health Research Methods, Evidence & Impact, McMaster University, Hamilton, Canada; Population Health Research Institute, Hamilton Health Sciences/McMaster University, Hamilton, Canada; St Joseph's Healthcare Hamilton, Hamilton, Canada.
Mark Canney, Division of Nephrology, The Ottawa Hospital Research Institute, Department of Medicine, University of Ottawa, Ontario, Canada.
Gregory L Hundemer, Division of Nephrology, The Ottawa Hospital Research Institute, Department of Medicine, University of Ottawa, Ontario, Canada.
Nataliya Milman, Division of Rheumatology, Department of Medicine, University of Ottawa, Ontario, Canada.
Michelle A Hladunewich, Division of Nephrology, Department of Medicine, Sunnybrook Health Sciences Centre, University of Toronto, Toronto, Ontario, Canada.
Todd Fairhead, Division of Nephrology, The Ottawa Hospital Research Institute, Department of Medicine, University of Ottawa, Ontario, Canada.
Manish M Sood, Institute for Clinical Evaluative Sciences, Ottawa, Ontario, Canada; Division of Nephrology, The Ottawa Hospital Research Institute, Department of Medicine, University of Ottawa, Ontario, Canada.
FUNDING
This project was supported by a resident research grant from the Physician's Services Incorporated (PSI) Foundation (grant # R19-17). The funder had no role in the study design, analysis, interpretation of data or writing of the manuscript.
AUTHORS’ CONTRIBUTIONS
D.M.-A., M.W. and M.M.S. came up with the study design. W.P. was responsible for conceiving and carrying out the statistical analysis. D.M.-A. and M.M.S. were responsible for the analysis and interpretation of the data. D.M.-A. and M.M.S. drafted the first manuscript. All co-authors provided revisions for the manuscript. Each author contributed important intellectual content and approved the final manuscript version.
CONFLICT OF INTEREST STATEMENT
M.M.S. received a speaker fee from AstraZeneca. All other authors have nothing to declare.
REFERENCES
- 1.Jennette JC, Falk RJ, Bacon PAet al. . 2012 Revised international Chapel Hill consensus conference nomenclature of vasculitides. Arthritis Rheum 2013; 65: 1–11 [DOI] [PubMed] [Google Scholar]
- 2.De Groot K, Harper L, Jayne DRWet al. . Pulse versus daily oral cyclophosphamide for induction of remission in antineutrophil cytoplasmic antibody-associated vasculitis: a randomized trial. Ann Intern Med 2009; 150: 670. [DOI] [PubMed] [Google Scholar]
- 3.Jones RB, Cohen Tervaert JW, Hauser Tet al. . Rituximab versus cyclophosphamide in ANCA-associated renal vasculitis. N Engl J Med 2010; 363: 211–220 [DOI] [PubMed] [Google Scholar]
- 4.Stone JH, Merkel PA, Spiera Ret al. . Rituximab versus cyclophosphamide for ANCA-associated vasculitis. N Engl J Med 2010; 363: 221–232 [DOI] [PMC free article] [PubMed] [Google Scholar]
- 5.Robson J, Doll H, Suppiah Ret al. . Damage in the ANCA-associated vasculitides: long-term data from the European vasculitis study group (EUVAS) therapeutic trials. Ann Rheum Dis 2015; 74: 177–184 [DOI] [PubMed] [Google Scholar]
- 6.Rhee RL, Hogan SL, Poulton CJet al. . Trends in long-term outcomes among patients with antineutrophil cytoplasmic antibody-associated vasculitis with renal disease. Arthritis Rheumatol 2016; 68: 1711–1720 [DOI] [PMC free article] [PubMed] [Google Scholar]
- 7.Flossmann O, Berden A, de Groot Ket al. . Long-term patient survival in ANCA-associated vasculitis. Ann Rheum Dis 2011; 70: 488–494 [DOI] [PubMed] [Google Scholar]
- 8.Suppiah R, Judge A, Batra Ret al. . A model to predict cardiovascular events in patients with newly diagnosed Wegener's granulomatosis and microscopic polyangiitis. Arthritis Care Res (Hoboken) 2011; 63: 588–596 [DOI] [PMC free article] [PubMed] [Google Scholar]
- 9.Benchimol EI, Smeeth L, Guttmann Aet al. . The REporting of studies Conducted using Observational Routinely-collected health Data (RECORD) statement. PLOS Med 2015; 12: e1001885. [DOI] [PMC free article] [PubMed] [Google Scholar]
- 10.Garner S, Massicotte-Azarnio D, Molnar Aet al. . Utilization of Canadian healthcare administrative databases to accurately identify cases of ANCA-associated vasculitis. Rheumatology (Oxford) 2019; 58 (Suppl 2): kez059.016 [Google Scholar]
- 11.Li F, Morgan KL, Zaslavsky AM.. Balancing covariates via propensity score weighting. J Am Stat Assoc 2018; 113: 390–400 [Google Scholar]
- 12.Li F, Thomas LE.. Addressing extreme propensity scores via the overlap weights. Am J Epidemiol 2019; 188: 250–257 [DOI] [PubMed] [Google Scholar]
- 13.Thomas LE, Li F, Pencina MJ.. Overlap weighting: a propensity score method that mimics attributes of a randomized clinical trial. JAMA 2020; 323: 2417. [DOI] [PubMed] [Google Scholar]
- 14.Austin PC. Balance diagnostics for comparing the distribution of baseline covariates between treatment groups in propensity-score matched samples. Stat Med 2009; 28: 3083–3107 [DOI] [PMC free article] [PubMed] [Google Scholar]
- 15.Cohen J. Statistical Power Analysis for the Behavioral Sciences. 2nd ed. Lawrence Erlbaum Associates. 1988. doi: 10.4324/9780203771587. [Google Scholar]
- 16.Lau B, Cole SR, Gange SJ.. Competing risk regression models for epidemiologic data. Am J Epidemiol 2009; 170: 244–256 [DOI] [PMC free article] [PubMed] [Google Scholar]
- 17.Noordzij M, Leffondré K, Van Stralen KJet al. . When do we need competing risks methods for survival analysis in nephrology? Nephrol Dial Transplant 2013; 28: 2670–2677 [DOI] [PubMed] [Google Scholar]
- 18.Austin PC. Variance estimation when using inverse probability of treatment weighting (IPTW) with survival analysis. Stat Med 2016; 35: 5642–5655 [DOI] [PMC free article] [PubMed] [Google Scholar]
- 19.Aviña-Zubieta JA, Mai A, Amiri Net al. . Risk of myocardial infarction and stroke in patients with granulomatosis with polyangiitis (Wegener's): a population-based study. Arthritis Rheumatol 2016; 68: 2752–2759 [DOI] [PubMed] [Google Scholar]
- 20.Zöller B, Li X, Sundquist Jet al. . Risk of subsequent ischemic and hemorrhagic stroke in patients hospitalized for immune-mediated diseases: a nationwide follow-up study from Sweden. BMC Neurol 2012; 12: 41. [DOI] [PMC free article] [PubMed] [Google Scholar]
- 21.Sreih AG, Annapureddy N, Springer Jet al. . Development and validation of case-finding algorithms for the identification of patients with anti-neutrophil cytoplasmic antibody-associated vasculitis in large healthcare administrative databases. Pharmacoepidemiol Drug Saf 2016; 25: 1368–1374 [DOI] [PMC free article] [PubMed] [Google Scholar]
- 22.Morgan MD, Turnbull J, Selamet Uet al. . Increased incidence of cardiovascular events in patients with antineutrophil cytoplasmic antibody-associated vasculitides: a matched-pair cohort study. Arthritis Rheum 2009; 60: 3493–3500 [DOI] [PubMed] [Google Scholar]
- 23.Faurschou M, Mellemkjaer L, Sorensen IJet al. . Increased morbidity from ischemic heart disease in patients with Wegener's granulomatosis. Arthritis Rheum 2009; 60: 1187–1192 [DOI] [PubMed] [Google Scholar]
- 24.Berti A, Matteson EL, Crowson CSet al. . Risk of cardiovascular disease and venous thromboembolism among patients with incident ANCA-associated vasculitis: a 20-year population-based cohort study. Mayo Clin Proc 2018; 93: 597–606 [DOI] [PMC free article] [PubMed] [Google Scholar]
- 25.Goff DC, Lloyd-Jones DM, Bennett Get al. . 2013 ACC/AHA guideline on the assessment of cardiovascular risk: a report of the American College of Cardiology/American Heart Association task force on practice guidelines. Circulation 2014; 129: S49–S73 [DOI] [PubMed] [Google Scholar]
- 26.Wanner C, Tonelli M.. KDIGO clinical practice guideline for lipid management in CKD: summary of recommendation statements and clinical approach to the patient. Kidney Int 2014; 85: 1303–1309 [DOI] [PubMed] [Google Scholar]
- 27.Melduni RM, Cooper LT, Gersh BJet al. . Association of autoimmune vasculitis and incident atrial fibrillation: a population-based case-control study. J Am Heart Assoc 2020; 9: e015977. [DOI] [PMC free article] [PubMed] [Google Scholar]
- 28.Ettinger WH, Goldberg AP, Applebaum-Bowden Det al. . Dyslipoproteinemia in systemic lupus erythematosus. Effect of corticosteroids. Am J Med 1987; 83: 503–508 [DOI] [PubMed] [Google Scholar]
- 29.Bulkley BH, Roberts WC.. The heart in systemic lupus erythematosus and the changes induced in it by corticosteroid therapy. A study of 36 necropsy patients. Am J Med 1975; 58: 243–264 [DOI] [PubMed] [Google Scholar]
- 30.Petri M, Perez-Gutthann S, Spence Det al. . Risk factors for coronary artery disease in patients with systemic lupus erythematosus. Am J Med 1992; 93: 513–519 [DOI] [PubMed] [Google Scholar]
- 31.Ridker PM, Hennekens CH, Buring JEet al. . C-reactive protein and other markers of inflammation in the prediction of cardiovascular disease in women. N Engl J Med 2000; 342: 836–843 [DOI] [PubMed] [Google Scholar]
- 32.Ridker PM, Cushman M, Stampfer MJet al. . Inflammation, aspirin, and the risk of cardiovascular disease in apparently healthy men. N Engl J Med 1997; 336: 973–979 [DOI] [PubMed] [Google Scholar]
- 33.Pai JK, Pischon T, Ma Jet al. . Inflammatory markers and the risk of coronary heart disease in men and women. N Engl J Med 2004; 351: 2599–2610 [DOI] [PubMed] [Google Scholar]
- 34.Chironi G, Pagnoux C, A Simonet al. . Increased prevalence of subclinical atherosclerosis in patients with small-vessel vasculitis. Heart 2007; 93: 96–99 [DOI] [PMC free article] [PubMed] [Google Scholar]
- 35.de Leeuw K, Bijzet J, van der Graaf AMet al. . Patients with Wegener's granulomatosis: a long-term follow-up study. Clin Exp Rheumatol 2010; 28: 18–23 [PubMed] [Google Scholar]
- 36.Nienhuis HLA, De Leeuw K, Smit AJet al. . Enhanced endothelium-dependent microvascular responses in patients with Wegener's granulomatosis. J Rheumatol 2007; 34: 1875–1881 [PubMed] [Google Scholar]
- 37.Raza K, Thambyrajah J, Townend JNet al. . Suppression of inflammation in primary systemic vasculitis restores vascular endothelial function: lessons for atherosclerotic disease? Circulation 2000; 102: 1470–1472 [DOI] [PubMed] [Google Scholar]
- 38.Odutayo A, Wong CX, Farkouh Met al. . AKI and long-term risk for cardiovascular events and mortality. J Am Soc Nephrol 2017; 28: 377–387 [DOI] [PMC free article] [PubMed] [Google Scholar]
- 39.Go AS, Hsu CY, Yang Jet al. . Acute kidney injury and risk of heart failure and atherosclerotic events. Clin J Am Soc Nephrol 2018; 13: 833–841 [DOI] [PMC free article] [PubMed] [Google Scholar]
- 40.Ng RRG, Tan GHJ, Liu Wet al. . The association of acute kidney injury and atrial fibrillation after cardiac surgery in an Asian prospective cohort study. Medicine 2016; 95: e3005. [DOI] [PMC free article] [PubMed] [Google Scholar]
- 41.Dunlay SM, Weston SA, Jacobsen SJet al. . Risk factors for heart failure: a population-based case-control study. Am J Med 2009; 122: 1023–1028 [DOI] [PMC free article] [PubMed] [Google Scholar]
- 42.Huxley RR, Lopez FL, Folsom ARet al. . Absolute and attributable risks of atrial fibrillation in relation to optimal and borderline risk factors: the atherosclerosis risk in communities (ARIC) study. Circulation 2011; 123: 1501–1508 [DOI] [PMC free article] [PubMed] [Google Scholar]
- 43.Mehta N, Kalra A, Nowacki ASet al. . Association of use of angiotensin-converting enzyme inhibitors and angiotensin II receptor blockers with testing positive for coronavirus disease 2019 (COVID-19). JAMA Cardiol 2020; 5: 1020. [DOI] [PMC free article] [PubMed] [Google Scholar]
Associated Data
This section collects any data citations, data availability statements, or supplementary materials included in this article.


