

Abstract

Volatile chemical products (VCPs) have recently been identified as potentially important unconventional sources of secondary organic aerosol (SOA), in part due to the mitigation of conventional emissions such as vehicle exhaust. Here, we report measurements of SOA production in an oxidation flow reactor from a series of common VCPs containing oxygenated functional groups and at least one oxygen within the molecular backbone. These include two oxygenated aromatic species (phenoxyethanol and 1-phenoxy-2-propanol), two esters (butyl butyrate and butyl acetate), and four glycol ethers (carbitol, methyl carbitol, butyl carbitol, and hexyl carbitol). We measured gas- and particle-phase products with a suite of mass spectrometers and particle-sizing instruments. Only the aromatic VCPs produce SOA with substantial yields. For the acyclic VCPs, ether and ester functionality promotes fragmentation and hinders autoxidation, whereas aromatic rings drive SOA formation in spite of the presence of ether groups. Therefore, our results suggest that a potential strategy to reduce urban SOA from VCPs would be to reformulate consumer products to include less oxygenated aromatic compounds.
Keywords: secondary organic aerosol, volatile chemical product, PM2.5, aerosol mass yield, oxidation flow reactor, NOx
Short abstract
This work demonstrates that some classes of acyclic oxygenated hydrocarbons are poor SOA producers and oxygenated aromatic compounds commonly found in VCPs have reasonable SOA yields.
Introduction
Fine particles with diameters smaller than 2.5 μm (PM2.5) can penetrate deep into the lungs and lead to respiratory problems and oxidative stress.1 PM2.5 pollution is responsible for over 4 million global premature deaths annually.2 Burnett et al. estimated that a 20% reduction in PM2.5 could prevent 450,000–1.4 million deaths annually worldwide.3 Air quality in the United States has improved dramatically because of regulations and enforcement of the Clean Air Act, yet PM2.5 is still responsible for up to 100,000 premature deaths annually.4
Organic aerosols (OAs) make up a significant fraction of PM2.5 mass, with fine particles in the Northern Hemisphere containing approximately 50% OA on average.5 OA includes directly emitted primary organic aerosols, but the majority often consists of secondary organic aerosols (SOAs).6,7 However, SOA is among the least understood class of pollutants,7,8 and chemical transport models typically underestimate OA mass.9,10 These underestimates are the result of a combination of missing SOA formation pathways and missing precursors.9,11
Anthropogenic SOA precursors can generally be grouped into different categories including mobile sources, such as motor vehicle exhaust and volatile chemical products (VCPs), such as emissions from cleaning agents, coatings, and a range of other products and materials.11,12 Because of the successful control of combustion sources, VCPs now account for approximately half of urban anthropogenic organic gas-phase emissions in the United States,11 and their share of total emissions has increased over time.12 McDonald et al. hypothesized that VCPs could account for much of the unexplained SOA mass in Los Angeles,11 Shah et al. presented in situ evidence of significant SOA formation from VCPs,13 and Sheu et al. observed a wide range of oxygenated VCPs in residential emissions,14 There are two major challenges with constraining ambient SOA formation from VCPs: (1) there are hundreds of VCP species, many with limited data on SOA yields, and (2) many of these VCP species are oxygenates, so we cannot easily apply known SOA yields or oxidation mechanisms from traditional anthropogenic species, which are dominated by aliphatic and aromatic hydrocarbons.
Recent experimental studies have shown that oxygenated VCPs can serve as SOA precursors. Li et al. and Li & Cocker demonstrated SOA formation from high concentrations of various glycol ethers.15,16 Charan et al. found high SOA mass yields for benzyl alcohol, indicating strong SOA formation potential for oxygenated aromatics.17 However, these are just a few compounds found in VCPs. The oxygen-containing functional groups in many VCPs are likely to influence the oxidation pathways and SOA formation potentials.
SOA yields depend on the molecular structure. Yields generally increase with increasing carbon number and the presence of cyclic structures and unsaturated bonds, while decreasing with greater branching and fragmentation.18−20 However, the effects of adding oxygen on SOA yields are more complicated. By adding functional groups to the gas-phase parent molecule and maintaining the carbon backbone, oxidation may increase both the molecular weight and polarity, which reduces the vapor pressure and promotes partitioning to the particle phase.5,21,22 However, oxidants also have the potential to cleave carbon–carbon bonds (i.e., fragmentation) and form higher volatility species.22 The structure of the parent molecule plays a critical role in SOA formation as branched molecules enhance alkoxy radical decomposition, whereas cyclic and linear molecules more readily isomerize to add at least two functional groups without fragmentation.5 Oxygenated functional groups in the gas-phase parent molecule also contribute to this dual effect by lowering the vapor pressure and contributing to particle formation when the carbon backbone remains intact or contributing to fragmentation and forming smaller high-vapor pressure gas-phase products.5 The position of the oxygen group also plays a major role in SOA formation as it may change the size of decomposition products and/or hinder the self-isomerization via 1,5 and 1,6-H shifts.23 The presence of oxygen groups may also inhibit the autoxidation pathways that are responsible for generating highly oxygenated, low-volatility products found in many SOA-forming systems.24
NOx is also important in SOA formation because its presence controls the fate of organic peroxy radicals. NOx influences the oxidation pathway and changes the composition of the oxidation products primarily by preventing organo-peroxy radicals (RO2•) from reacting with other peroxy radicals (HO2• and RO2•).25 The reaction of organo-peroxy radicals with NO forms alkoxy radicals (RO•).19 In addition, NOx can form species not commonly found in low-NOx environments such as organic nitrates.25 For some common SOA precursors such as terpenes, reaction pathways involving NOx may form higher volatility products that lead to lower SOA yields, in part because it precludes autoxidation pathways.24,25 However, for large-carbon number alkane species such as dodecane and heptadecane, SOA yields were higher under high-NOx conditions.19,26 For linear alkanes, which do not typically autoxidize, RO• formed via high-NO oxidation largely isomerizes to form multiple oxygen functional group-containing products or form low-volatility nitrate species instead of fragmenting.26 Thus, NOx concentrations are an important factor in determining SOA yields, and reductions in NOx emissions could impact SOA formation and need to be considered when simulating SOA formation.7
VCPs are typically selected in product formulations for their favorable properties. While these properties are usually associated with the storage and use of the product, their potential for SOA formation warrants consideration to reduce environmental impacts. Product reformulation could be done to reduce pollution, but this requires improved understanding of pollutant formation from VCPs. One historical example of this strategy is fuel reformulation to reduce the ozone formation potential of vehicle emissions.27 Understanding SOA formation from various common VCPs may allow low SOA formation potential to be an added design criterion during product formulation.
In this manuscript, we examine SOA formation from a suite of oxygenated VCPs used in cleaning products, solvents, paints, and flavoring agents, with a goal of identifying which species or classes of species have substantial SOA mass yields (e.g., >0.1) and may therefore be appreciable contributors to urban SOA. The compounds were chosen to test the underlying chemical structures of three oxygenated VCP classes: two oxygenated aromatic species (phenoxyethanol and 1-phenoxy-2-propanol; Table 1), two esters (butyl butyrate and butyl acetate), and four glycol ethers (carbitol, methyl carbitol, butyl carbitol, and hexyl carbitol). These compound classes are also selected because McDonald et al. hypothesized that these sorts of oxygenated VCPs include important contributors to SOA and have been observed in residential VCP-related emissions.11,14 All of these species, except butyl butyrate and butyl acetate (Table 1), are intermediate volatility organic compounds (IVOCs) with vapor pressures <0.1 mmHg and are therefore exempt from the U.S. EPA’s VOC emission limits for VCPs.28 Finally, chemical transport models such as the box model utilized by McDonald et al. are increasingly being run to estimate SOA yields of various species, and testing these compounds would evaluate the models’ efficacy.11
Table 1. SOA Mass Yields and Molecular Structures of Oxygenated VCPs at High and Low NOx.

Materials and Methods
We measured SOA formation using a custom-built 3.6 L aluminum oxidation flow reactor (OFR). The OFR is described in detail in the study by Shah et al.13 In the OFR, two mercury lamps photolyze oxygen at 185 and 254 nm in humidified air to generate the main oxidant OH as well as HO2 and O3 to simulate atmospheric aging on the order of hours to weeks of oxidation.29 The inlet air is humidified to 50% to enable formation of OH radicals via photolysis. The total flow rate through the OFR is 5 L/min for a mean residence time τ = 43.2 s. Individual VCP compounds (30–100 ppb) are injected into the inlet air using a syringe pump. All VCP compounds (2-phenoxyethanol, 1-phenoxy-2-propanol, butyl butyrate, butyl acetate, carbitol, methyl carbitol, butyl carbitol, and hexyl carbitol) were obtained from Sigma-Aldrich. The VCPs are coinjected with deuterated butanol (d9-butanol) (98% Cambridge Isotope Laboratories) that acts as an OH tracer based on a reaction rate constant of k = (3.4 ± 0.88) × 10–12 cm3 molecule–1 s–1 with OH.30 OH concentrations were over a range from 1.0 × 10⁹ to 2.5 × 10¹⁰ molecule cm–3. The average OH concentration was approximately 2.1 × 10⁹ molecule cm–3 (Table S1). All experiments were performed without the presence of seed aerosols at 25 °C.
For high-NOx experiments, NO (500 ppm in N2) was injected at 20 standard cm3/min for a final inlet concentration of 2 ppm and an initial NOx:VOC > 10 ppb:ppb (∼2–10 ppb:ppb C). NO concentration was not measured at the OFR exit but we are confident in the significant presence of NOx due to consistent nitrate molar yields as detailed in the Particle Composition Section. This high NOx ratio is greater than the overall molar NOx:C VOC ratio in typical urban environments such as 0.25 ppb/ppb NOx:C VOC seen in the Los Angeles urban area.7 Therefore, the experimental ratio would still be far greater even if some NOx were consumed. This is intended to ensure the NO + RO2• reaction pathway dominated, consistent with high-NOx urban conditions.7
Gas-phase concentrations of VCPs, d9-butanol, and product gases were measured using a proton transfer reaction mass spectrometer (PTRMS, Ionicon Analytik, Innsbruck, Austria). The PTRMS was calibrated using a standard gas mixture (Airgas Specialty Gases, Plumsteadville, PA) for a wide range of compounds at various m/z (Supporting Information Section S.2). The particle composition was measured with a high-resolution time-of-flight aerosol mass spectrometer (AMS). AMS data were analyzed with Squirrel (v. 1.61) and PIKA (v. 1.21) in Igor (v. 7.08). Particle size distributions and particle mass concentration were measured with a scanning mobility particle sizer (SMPS, Model 3082/3775, TSI, Shoreview, MN) assuming a unit density of 1.0 μg/m3.
In addition, for some oxidation experiments, we used an iodide-adduct time-of-flight chemical ionization mass spectrometer (ToF-CIMS, Aerodyne) to determine the gas-phase product composition. The iodide CIMS measures the mass of ions with a resolution of 10,000 m/Δm. We also aim to quantify product volatility, expressed as saturation concentration (c0), which is a function of both the molecular composition and the specific (polar) functional groups present in the molecule. Using these data, we compared and contrasted the presence of oxygenated groups and the extent of fragmentation.
Product volatility was estimated using the two-dimensional volatility basis set parameterizations:
, where nCi and nO are the number of carbon and oxygen atoms in species i, nC0 is the carbon number of a c0 = 1 μg m–3 alkane, and bC, bO, and bCO represent the decrease in log10ci from carbon–carbon interaction, oxygen–oxygen interaction, and carbon–oxygen nonideality, respectively.31 The volatility of the compounds is temperature-dependent and can be described by a pseudo-Arrhenius expression.31 Hence, we can expect volatility to be slightly greater at higher temperatures, shifting the volatility basis set accordingly. For the aromatic species, we use the parameters from Donahue et al. (n0C = 25, bC = 0.475, bO = 2.3, and bCO = −0.3) to account for the traditional OH oxidation pathways, while for nonaromatic species we used a revised volatility basis set from Bianchi et al. with bO = 0.2 and bCO = 0.9 to account for the autoxidation pathways.24,31 This is appropriate for molecules where the oxygens have less effect on the volatility of the molecule (e.g., because of hydroperoxide groups). The presence of autoxidation is further supported empirically in the Gas-Phase Composition section. These two volatility relations have been confirmed experimentally using temperature-programmed desorption volatility measurements in a FIGAERO chemical ionization mass spectrometer.32 Hence, for a similar number of oxygen and carbon atoms, products formed from the aromatic hydrocarbons will have a lower volatility than nonaromatic hydrocarbons and will be more likely to partition into the particle phase.
SOA mass yield is defined as the mass of SOA formed divided by the mass of precursor vapor consumed (Yield = ΔMo/ΔROG). We define ΔROG as the change in VCP concentration measured by the PTRMS, and ΔMo is calculated from the SMPS assuming spherical particles and unit density. The yield depends on a number of factors, including chemical pathways dictated by the VOC to NOx ratio (VOC:NOx) and the aerosol loading. Using the aerosol mass yield, we roughly divided the VCP precursors into “high yield” (>0.1) versus “low yield” (<0.1) SOA precursors.
We tested the performance of the OFR using α-pinene, an extensively studied unsaturated hydrocarbon SOA precursor. When injecting 48 ppb of α-pinene and oxidizing it with 1.8 × 10⁸–2.2 × 10⁹ mol/cm3 of OH, equivalent to 0.1–0.85 days of oxidation, we observed mass yields of 0.03–0.14. This is consistent with previous measurements of SOA yield from α-pinene.33
Wall losses of particles, precursor vapors, and product vapors can be significant confounders in SOA formation experiments using either smog chambers or flow tubes.6,34 This is particularly important for this work in which experiments were conducted unseeded. There is evidence of vapor wall losses in our OFR. For many lower volatility compounds, it took several minutes to achieve a stable concentration, whereas SOA and VOC concentrations stabilized relatively quickly once the UV lights were turned on. Vapor and particle wall losses are extensively evaluated and discussed in the Supporting Information (Section S.3) and were not a major issue with regard to SOA yields, with product vapor loss fractions of 0.18 or less and negligible particle losses to the walls.
Results and Discussion
Measured SOA Yields
Table 1 summarizes the SOA yields measured via the SMPS. Phenoxypropanol and phenoxyethanol are the only species to form significant SOA, with yields of ∼0.15 g–OA/g. These compounds both have aromatic rings, which are known to promote SOA production.9,35 The particle-phase SOA products had a concentration of COA = ∼10–80 μg/m3 (Table S1).
Though the aromatic species had a large SOA yield, overall these results suggest that many acyclic VCPs are poor SOA precursors. Yields were well below 0.01 for many of the compounds we tested, even though the majority of them are IVOCs. Li and Cocker also found a low yield (<0.01) for methyl carbitol, yet obtained a wide range of yields from 0.03–0.17 and 0.24–0.35 for carbitol and butyl carbitol, respectively.15 These differences in yield may be qualitatively consistent with our results as they used much higher concentrations of precursors (327–436 ppb of carbitol and 264–527 ppb of butyl carbitol versus ∼10–100 ppb for all compounds in our experiments).15 By comparison, Charan et al. found higher yields (∼0.35–1.0) for the oxygenated aromatic species benzyl alcohol.17 Several factors may have led to this difference with phenoxypropanol and phenoxyethanol in this study, including larger (>100 ppb) precursor concentration, the absence of an ether group in benzyl alcohol, or the presence of ammonium sulfate seeds. Presto et al. measured the high NOx SOA yields for a series of n-alkanes with similar volatilities to the glycol ethers at COA ∼ 10 μg/m3: n-dodecane (C* ∼ 106 μg/m3), n-pentadecane (C* ∼ 105 μg/m3), and n-heptadecane (C* ∼ 104 μg/m3) of 0.09, 0.35, and 0.44, respectively.36 This demonstrates the inhibiting effect of ether groups for SOA formation and the importance of the underlying structure of the precursor when extrapolating yield data to new classes of compounds.
Low or no SOA formation indicates that the oxidation products of a specific precursor are too volatile to partition into the particle phase for the experimental conditions. As discussed above, there are generally two reasons why this may happen. First, the precursor species is so volatile that even after oxidation, all of the oxidation products are sufficiently volatile to reside either mostly or entirely in the gas phase (e.g., the products are all IVOCs or VOCs). Second, even in cases where the precursor species can produce low-volatility products, the dominant reaction mechanism leads to volatile products.
Two of the species that we tested (butyl butyrate and butyl acetate) are VOCs. The negligible SOA formation from these species may therefore be a result of high precursor volatility leading to volatile products. However, given that the acyclic IVOC species listed in Table 1 also made little or no SOA, precursor volatility alone cannot explain the consistently low SOA yields. Furthermore, a subset of VOCs, including some monoterpenes, can be SOA precursors depending on their molecular structure.37 This suggests that the low SOA yields for the oxygenated VCPs we studied are the result of the reaction mechanisms generating more volatile products, for example because of fragmentation reactions. We examine this possibility in the next section.
Gas-Phase Product Composition
We measured gas-phase products with a PTRMS and an iodide CIMS. Data from the CIMS offer insights regarding the gas-phase composition and the SOA formation, or lack thereof, for different precursors. Figure 1 shows examples for a precursor that forms SOA (phenoxypropanol) and a precursor that does not form SOA (hexyl carbitol). In each case, we present the relative ion intensities in two types of plots: intensity in a two-dimensional space defined by the number of carbon atoms and the number of oxygen atoms (nC, nO) and peak area versus volatility. Each plot has four corresponding shaded regions, which represent various volatility classes. From lowest to highest volatility, these include extremely low volatility organic compounds (ELVOCs) in gray (−8.5 ≤ log c0 ≤ −4.5), low-volatility organic compounds (LVOCs) in red (−4.5 ≤ log c0 ≤ −0.5), semivolatile organic compounds (SVOCs, −0.5 ≤ log c0 ≤ 2.5) in green, and intermediate volatility organic compounds (IVOCs, 2.5 ≤ log c0 ≤ 6.5) in blue.
Figure 1.

(Top) Gas-phase product distribution for oxidation of phenoxypropanol (nC = 9) and (bottom) hexyl carbitol (nC = 10) measured using an I– chemical ionization mass spectrometer. Panels on the left show product peak area (as symbol area) vs carbon and oxygen number (nC, nO). Panels on the right show product peak area vs volatility (log c0). Volatility classes (extremely, low, semivolatile, and intermediate volatility organic compounds) are shown as colored regions. Calibrated parameterizations defining the ranges differ for aromatics such as phenoxypropanol and aliphatics such as hexyl carbitol. The points above the black contour line in the left panel and to the left of the black contour line in the right panel correspond to lower volatility products that easily enter the particle phase; these are in the LVOC and ELVOC volatility classes, indicating significant aerosol formation.
Highly oxygenated condensable products for phenoxypropanol are largely nC = 6 and lower, suggesting that the aromatic ring plays a key role.
No products are observed in the ELVOC or LVOC range for hexyl carbitol (nor do we observe any SOA formation), though products are widely distributed up to nC = 10.
Under ambient conditions, ELVOCs and LVOCs are essentially always in the particle phase, and these species are of sufficiently low volatility to participate in the growth of freshly nucleated particles.38 Depending on production rates (and thus potential for supersaturation), ELVOCs can nucleate directly.39 SVOCs partition between the gas and particle phases under ambient conditions, but at high OA concentrations will favor the particle phase. IVOCs are overwhelmingly in the gas phase except at very high OA concentrations. The black lines in Figure 1 demarcate the boundaries between SVOCs and LVOCs. Species falling below (in left panels) or to the left of (in right panels) the black lines should form SOA under all conditions, while species above/to the right of the black line will remain largely in the vapor phase. Hence, the presence or absence of products below the black demarcation line further supports the SOA formation potential of these VCPs and their oxidation products. The boundary influencing partitioning would vary in the case of indoor VCP oxidation, as indoor settings have additional surfaces and other reservoirs that greatly increase condensed phase organic loadings, such that the surfaces and additional reservoirs significantly shift the partitioning for typically gas-phase species.14,40
Oxidation of phenoxypropanol, which had an SOA mass yield ∼0.15, generated products in the ELVOC (10% signal) and LVOC (32% signal) range (Figure 1) in addition to the SVOC (46% signal) and IVOC (13% signal) range. By contrast, the product ions from hexyl carbitol oxidation are either SVOCs (48% signal) or IVOCs (52% signal) (Figure 1). Dimer formation was not observed for either species.
As described in the Methods Section, we use different parameterizations to convert the number of carbon and oxygen atoms to log c0 for aromatic and nonaromatic precursors. Functional groups that are polar and promote strong dipole–dipole interactions or induce hydrogen bonding will lower the volatility considerably.32 Hence, species with similar molecular formulas can have widely different volatilities. This is especially true for hydroxyl groups (−OH) vs hydroperoxide groups (−OOH), where the “extra” oxygen has almost no effect on the overall volatility for −OOH.24,41 Aromatic compounds often undergo multiple generations of OH oxidation rapidly, with OH adding to the aromatic ring, whereas acyclic compounds are more likely to initiate autoxidation, which leads to multiple −OOH function groups. This is supported by substantial oxygenation and highly oxidized molecule formation with a lack of dimer formation for hexyl carbitol.42 For this reason, oxidation products from aromatic precursors have lower volatility for a given nC and nO than oxidation products from acyclic precursors.32
This difference between the volatilities of the products for hexyl carbitol and phenoxypropanol is evident in the shading for Figure 1. The parameterizations used here assume that aromatic-containing species have a lower volatility for the same nC and nO as the products of the nonaromatic VCPs. This is consistent with volatility trends captured by group contribution methods such as Pankow and Asher’s SIMPOL model, which uses the number of constituent groups to determine the vapor pressure.41
The clearest contrast for the effect of the structure on product volatility comes for butyl butyrate (C8H16O2) and butyl acetate (C6H12O2). Their sole constituent group, an ester (−1.2 to log c0), has less effect on volatility than a single hydroxyl (−2.23 to log c0) or two ethers (−0.718 to log c0 each) as in the glycol ethers.41 However, these glycol ethers themselves have less potential to form lower volatility products than the aromatic species. First, the aromatic species each have a hydroxyl group as well as an aromatic ether (−1.03 to log c0), which together have lower volatility more than two alkane ethers.41 Second, the aromatic ring favors the formation of several low volatility functional groups per oxygen, such as aromatic hydroxyls (−2.14 to log c0) and carboxylic acids (−3.58 to log c0), when oxidized.32,41
In addition to the SIMPOL model and product formation illustrated in Figure 1, we can further identify oxidation pathways using Ziemann and Atkinson’s 2012 structure activity relationship (SAR) model.5 From the SAR model, we were able to determine the reaction rates with OH for each species (Table S1), generally seeing the highest rate of oxidation by OH to occur for the glycol ethers, then the two aromatics, and finally the two esters.5
SAR models indicate substantial hydrogen abstraction from ether-adjacent carbons, leading to the formation of peroxy species (RO2•), which under high-NOx conditions react further to mostly form alkoxy radicals (RO•) in addition to organic nitrates.5,43 The alkoxy radicals then decompose via breakage of the ether bond, forming esters and alkyl radicals which are mostly high volatility and will not condense to form SOA.44 Under low-NOx conditions, RO2• + RO2• reactions can form either RO• radicals or an alcohol and carbonyl pair, with each pathway occurring in roughly equal proportions. Thereafter, the alcohol-carbonyl pair will be able to undergo multiple generations of oxidation and further fragment to form volatile products.45
The ester group is expected to have little effect on hydrogen abstraction, with a lower rate of abstraction from the carbon adjacent to the C=O group offset by an increase in abstraction from the carbon adjacent to the oxygen.5 Coupled with the high volatility of the two ester species studied here and their propensity to rapidly fragment after reacting with OH or via RO• isomerization, this leads to high-volatility oxidation products that are unable to form SOA.23,44 Similar to the glycol ethers, the two esters may also form alcohols and carbonyls via RO2• + RO2• reactions, though they likely lead to limited SOA formation because of further OH reactions and fragmentation.45
Based on their predicted reaction rates, the oxygenated aromatic species are oxidized to a relatively moderate extent, between that of the glycol ethers and the two esters tested, with similar probability of hydrogen abstraction occurring adjacent to the ether group as OH addition to the aromatic ring.5 These roughly equivalent reaction probabilities for the oxygenated aromatics are largely consistent with the observed distribution of products (Figure 1), where the substantial amount of observed products with low volatility and ≤6 carbon atoms likely corresponds to the occurrence of H abstraction adjacent to the ether group and subsequent fragmentation, whereas the products with >6 carbons are suggestive of OH addition and ring-opening reactions that kept the ether linkage intact. The hydrogen abstraction would follow similar patterns to those noted for the glycol ethers and esters above, although OH-addition and ring-opening products both with and without the ether bond intact would be able to generate substantial SOA. This reinforces the critical importance aromatic rings have in forming low-volatility products and driving SOA formation for a wide variety of oxidation mechanisms even for similar numbers of carbons and oxygens.
Particle Composition
The SOA composition was measured with the AMS, where the total fraction of AMS organic signals at m/z = 43 (f43) and m/z = 44 (f44) can be used to characterize the oxidation level for oxygenated organic aerosol.46 In general, f44 increases and f43 decreases with the oxidation level of the SOA.47Figure 2 indicates that both aromatic precursor species formed highly oxidized products (f44 > 0.15), though products formed under high-NOx conditions were slightly less oxygenated.
Figure 2.
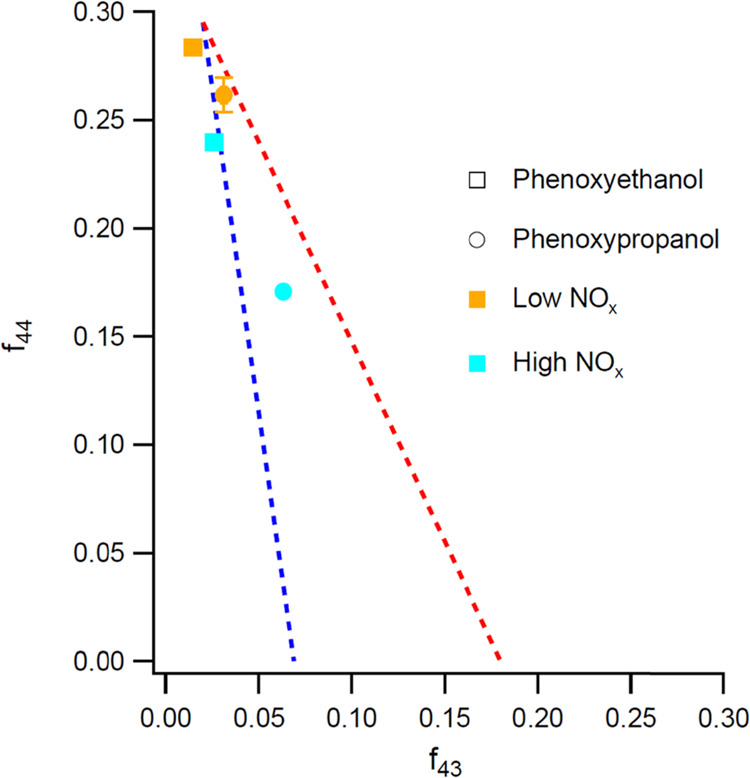
Average f43 vs f44 plot for SOA formed from aromatic VCPs under high- and low-NOx conditions. For both species, the extent of oxidation (indicated by a higher ratio of f44 to f43) was greater under low-NOx conditions. The red and blue dashed lines represent the region in which ambient oxidized OA typically falls. Representative error bars (1σ) are shown for low NOx phenoxypropanol.
The difference between low NOx and high NOx is further demonstrated over the full aerosol mass spectrum, as shown for phenoxypropanol in Figure 3. Overall, the SOA formed is highly oxygenated for both NOx regimes. Under both high- and low-NOx conditions, the aerosol mass is dominated by oxygenated ions (79% in low NOx and 67% in high NOx).
Figure 3.

SOA mass spectra for phenoxypropanol under low-NOx (top) and high-NOx (bottom) conditions. The graphs contain the fraction of signal vs fragment size (m/z) and are colored based on the chemical family. Purple fragments represent oxygenated species with either one oxygen (dark) or greater than one oxygen (bright) while blue species are nitrogen containing. The graphs indicate a low amount of nitrogen-containing species overall and a lower oxygenation for high NOx products.
Under high-NOx conditions, nitrogen-containing peaks account for 1.6% of the total aerosol mass. This is evidence of organic nitrate formation and can be used to estimate the molar yield of nitrate as some of the organic fragments under high NOx may have formed from organic nitrates. From the CIMS data, we can estimate a typical organic product of nC = 6, nO = 5, and nH = 8 (C6H8O5) with a molar mass of 160 g/mol and use the ratio of NO:NO2 to find an average molar mass of 32 g/mol for the NO and NO2 fragments. Using the ratio of the molar mass of the average organic nitrate to this average molar mass and multiplying by the mass yield of the NO and NO2 fragments, we get a total organic nitrate mass fraction of 0.08. Assuming that the organic nitrates have roughly equal molar mass as other products, this would give a total molar fraction of 0.08. This is consistent with compounds such as toluene, which has been noted to have an organic nitrate fraction of 0.07–0.18.48
The lower level of oxidation under high NOx for phenoxypropanol can partially be explained by a slightly lower OH concentration. However, it is clear that the presence of NOx limited the extent of oxidation. This is indicated by higher f44 to f43 ratios for both aromatic species under low NOx as shown in Figure 2, as well as the larger fraction of nonoxygenated green peaks in the bottom panel in Figure 3 and the presence of organic nitrate consistent with similar hydrocarbons.
We can look more closely at the difference between the two NOx regimes in Figure 4, which shows a difference plot where the fractional signal at low NOx is subtracted from high NOx. Hence, positive numbers indicate higher concentrations under high NOx and negative numbers indicate higher concentrations under low NOx. To highlight the differences for larger fragments, m/z greater than 58 (to the right of the dashed line) are expanded to 10 times their actual value.
Figure 4.

Difference between the high NOx fraction and low NOx fraction of SOA from phenoxypropanol, colored by family. Positive numbers indicate higher fractions under high-NOx conditions, and negative numbers indicate higher fractions under low NOx. Embedded in the graph is the calculated angle between high and low NOx vectors. Angles closer to 90° show a substantial difference between high and low NOx, whereas angles closer to 0° show no difference. The signal for the mass fragments greater than 58 (the red vertical dashed line) has been multiplied by a factor of 10.
At m/z 44 and below, two different patterns indicate less oxygenated compound formation under high NOx. First, there are substantially more hydrocarbons without an oxygen, as indicated by the large number of positive green bars. Second, the differences for the single oxygen signal at m/z 28 and multiple oxygen signals at m/z 44 are over three times larger for the low-NOx regime than any other difference. Above m/z 44, there are larger amounts of single-oxygen and nonoxygenated compounds formed under high NOx. For multiple oxygen species, there is a considerably higher signal at low NOx between m/z 44 and 50 and a mix of higher and lower signals beyond m/z 50, though the latter constitute less of the total signal.
In addition, we can compare
the two mass spectra over the whole
range of m/z by treating the fraction of total signals
measured at each m/z as a dimension in a vector and
calculating the cosine similarity. We then calculate the cosine of
the angle between them by dividing the dot product by the Euclidean
distances, that is, using the formula , where MSLowNOx and
MSHighNOx are the mass spectra for
low and high NOx, respectively.49 The arccosine can also be taken to obtain the
angle and the process repeated for different families (Figure 4). Mass spectra that are very
similar will have a nearly 0° angle between them. Spectra with
angles larger than 30° are generally considered to be significantly
different.49
, where MSLowNOx and
MSHighNOx are the mass spectra for
low and high NOx, respectively.49 The arccosine can also be taken to obtain the
angle and the process repeated for different families (Figure 4). Mass spectra that are very
similar will have a nearly 0° angle between them. Spectra with
angles larger than 30° are generally considered to be significantly
different.49
For the full phenoxypropanol mass spectra, the angle is 18°, which indicates some similarities, but also significant differences. The greatest agreement is for multiple oxygen fragments (CxHyOz>1), which have an angle of ∼5°, indicating strong agreement. However, this is largely driven by the massive signal at m/z 44. Excluding this ion increases the angle to 24°. The nonoxygenated species form an angle of 31°, indicating significant differences for these ions under the different NOx conditions. This is due to the large numbers of nonoxygenated hydrocarbons at high NOx for the whole range of m/z. The angle for single-oxygen ions (CxHyO) is 16°. This family has a greater high NOx signal at some m/z such as 43 and above m/z 50 and a greater signal for low NOx at m/z 28. The similarity for this family holds even when removing the signal of CO, which gives a similar angle of 14°.
High-NOx condition fragments were more likely to lack an oxygen or to have only a single oxygen. This is not surprising, as high NOx concentrations have been shown to lead to shorter RO2• lifetimes and inhibit autoxidation via NO + RO2 reactions.24,25 High NOx concentrations can also lead to nitrogen-containing compounds such as RO2NO2 and RONO2 species, which are overwhelmingly represented by signals of NO+ at m/z 30 and NO2+ at m/z 46.25,50 This ratio can vary significantly depending on the instrument and calibration.50 The NO:NO2 ratio for the high NOx phenoxypropanol mass spectrum shown in Figure 3 is ∼7 compared to ∼3 for phenoxyethanol (though on a different AMS due to instrument repair). These large ratios are indicative of the nitrates being dominated by organic, rather than inorganic, nitrates.50,51 Thus, in addition to the lower level of oxygenation there is also organic nitrate formation under high NOx that drives the difference between both regimes. In spite of this though, many similarities remain, including the overall SOA yield.
Atmospheric Implications
This work supports the overall importance of VCP emissions and their NOx-dependent oxidation chemistry leading to urban SOA formation. However, the SOA potential varies considerably by the molecular structure. We have demonstrated that many acyclic oxygenated hydrocarbon species such as glycol ethers and esters have limited potential as SOA precursors, while oxygenated aromatic species are able to generate significant yields of SOA. These aromatic ring-containing species are capable of generating significantly oxygenated products in both the gas and particle phases, though to a somewhat lesser extent under high-NOx conditions. This demonstrates both the critical importance of aromatic rings in SOA formation and the importance of fragmentation and higher volatility of the constituent groups resulting from acyclic aliphatic compounds.
These findings are particularly important given the key role oxygenated VOCs and nonoxygenated aromatics play in estimates of urban SOA. Oxygenates and aromatics comprise approximately 49% (of which ≤1% are aromatic) and 6% of total VCP-related VOC emissions in prior work, respectively.11 The model in the study by McDonald et al. estimates that SOA formation from oxygenated VOCs and nonoxygenated aromatics accounts for 14 and 12% of all the predicted anthropogenic SOA formation in the study, respectively.11 However, our results suggest that many of the acyclic oxygenated VCPs estimated to be major SOA precursors may not be as large of contributors to urban SOA, whereas the two oxygenated aromatics we tested would be more significant SOA precursors. For example, the glycol ethers methyl carbitol, carbitol, and butyl carbitol had estimated SOA yields of 0.066, 0.087, and 0.16 g/g respectively, while phenoxyethanol and 1-phenoxy-2-propanol had mass yields of 0.023 and 0.036 g/g.11 In contrast, we found that all three glycol ethers had no significant SOA formation and the SOA yields of the two aromatics were much higher. Overall, this would suggest that urban SOA estimates should be less dependent on acyclic oxygenated VCPs such as glycol ethers and esters and more sensitive to the aromatic content in both oxygenated and nonoxygenated forms.
As SOA formation from VCPs might be minimized by removing aromatic species and selectively utilizing species such as smaller (nC < 10) acyclic ethers that are more likely to fragment and form only gas-phase products, the results suggest that strategic product formulation may be a valuable approach to reducing the SOA formation potential of VCP emissions. However, additional considerations are required for differences in ozone formation potential, oxidation byproducts, and shifts with evolving urban NOx levels that impact oxidation pathways. While future work should continue to experimentally compare the SOA formation potential of larger sets of common VCPs such as unsaturated carboxylic acids, ketones, and esters for both traditional gas-to-particle and aqueous phase oxidation, these observations indicate that even for IVOCs the SOA formation potential from consumer, commercial, and industrial products may be mitigated through holistic design and green engineering.
Acknowledgments
This work was funded by the National Science Foundation (Award 1848324). D.R.G. and J.E.M. are grateful for support from NSF (CBET-2011362). This publication was developed under Assistance Agreements RD835871 (Yale University) and 83587301 (Carnegie Mellon University) awarded by the U.S. Environmental Protection Agency. It has not been formally reviewed by EPA. The views expressed in this document are solely those of the authors and do not necessarily reflect those of the Agency. EPA does not endorse any products or commercial services mentioned in this publication.
Supporting Information Available
The Supporting Information is available free of charge at https://pubs.acs.org/doi/10.1021/acs.est.1c07354.
Oxygenated VCP concentrations, OH concentrations, SOA mass yields, wall loss calculations, and description of the calibration gas used for the PTRMS (PDF)
The authors declare no competing financial interest.
Supplementary Material
References
- Deng X.; Zhang F.; Rui W.; Long F.; Wang L.; Feng Z.; Chen D.; Ding W. PM2.5-induced oxidative stress triggers autophagy in human lung epithelial A549 cells. Toxicol. In Vitro 2013, 27, 1762–1770. 10.1016/j.tiv.2013.05.004. [DOI] [PubMed] [Google Scholar]
- Apte J. S.; Marshall J. D.; Cohen A. J.; Brauer M. Addressing Global Mortality from Ambient PM2.5. Environ. Sci. Technol. 2015, 49, 8057–8066. 10.1021/acs.est.5b01236. [DOI] [PubMed] [Google Scholar]
- Burnett R.; Chen H.; Szyszkowicz M.; Fann N.; Hubbell B.; Pope C. A.; Apte J. S.; Brauer M.; Cohen A.; Weichenthal S.; Coggins J.; di Q.; Brunekreef B.; Frostad J.; Lim S. S.; Kan H.; Walker K. D.; Thurston G. D.; Hayes R. B.; Lim C. C.; Turner M. C.; Jerrett M.; Krewski D.; Gapstur S. M.; Diver W. R.; Ostro B.; Goldberg D.; Crouse D. L.; Martin R. V.; Peters P.; Pinault L.; Tjepkema M.; van Donkelaar A.; Villeneuve P. J.; Miller A. B.; Yin P.; Zhou M.; Wang L.; Janssen N. A. H.; Marra M.; Atkinson R. W.; Tsang H.; Quoc Thach T.; Cannon J. B.; Allen R. T.; Hart J. E.; Laden F.; Cesaroni G.; Forastiere F.; Weinmayr G.; Jaensch A.; Nagel G.; Concin H.; Spadaro J. V. Global estimates of mortality associated with longterm exposure to outdoor fine particulate matter. Proc. Natl. Acad. Sci. U. S. A. 2018, 115, 9592–9597. 10.1073/pnas.1803222115. [DOI] [PMC free article] [PubMed] [Google Scholar]
- Goodkind A. L.; Tessum C. W.; Coggins J. S.; Hill J. D.; Marshall J. D. Fine-scale damage estimates of particulate matter air pollution reveal opportunities for location-specific mitigation of emissions. Proc. Natl. Acad. Sci. U. S. A. 2019, 116, 8775–8780. 10.1073/pnas.1816102116. [DOI] [PMC free article] [PubMed] [Google Scholar]
- Ziemann P. J.; Atkinson R. Kinetics, products, and mechanisms of secondary organic aerosol formation. Chem. Soc. Rev. 2012, 41, 6582–6605. 10.1039/c2cs35122f. [DOI] [PubMed] [Google Scholar]
- Palm B. B.; Campuzano-Jost P.; Ortega A. M.; Day D. A.; Kaser L.; Jud W.; Karl T.; Hansel A.; Hunter J. F.; Cross E. S.; Kroll J. H.; Peng Z.; Brune W. H.; Jimenez J. L. In situ secondary organic aerosol formation from ambient pine forest air using an oxidation flow reactor. Atmos. Chem. Phys. 2016, 16, 2943–2970. 10.5194/acp-16-2943-2016. [DOI] [Google Scholar]
- Zhao Y.; Saleh R.; Saliba G.; Presto A. A.; Gordon T. D.; Drozd G. T.; Goldstein A. H.; Donahue N. M.; Robinson A. L. Reducing secondary organic aerosol formation from gasoline vehicle exhaust. Proc. Natl. Acad. Sci. U. S. A. 2017, 114, 6984–6989. 10.1073/pnas.1620911114. [DOI] [PMC free article] [PubMed] [Google Scholar]
- Ye Q.; Upshur M. A.; Robinson E. S.; Geiger F. M.; Sullivan R. C.; Thomson R. J.; Donahue N. M. Following Particle-Particle Mixing in Atmospheric Secondary Organic Aerosols by Using Isotopically Labeled Terpenes. Chem 2018, 4, 318–333. 10.1016/j.chempr.2017.12.008. [DOI] [Google Scholar]
- Carlton A. G.; Bhave P. V.; Napelenok S. L.; Edney E. O.; Sarwar G.; Pinder R. W.; Pouliot G. A.; Houyoux M. Model representation of secondary organic aerosol in CMAQv4.7. Environ. Sci. Technol. 2010, 44, 8553–8560. 10.1021/es100636q. [DOI] [PubMed] [Google Scholar]
- Pai S. J.; Heald C. L.; Pierce J. R.; Farina S. C.; Marais E. A.; Jimenez J. L.; Campuzano-Jost P.; Nault B. A.; Middlebrook A. M.; Coe H.; Shilling J. E.; Bahreini R.; Dingle J. H.; Vu K. An evaluation of global organic aerosol schemes using airborne observations. Atmos. Chem. Phys. 2020, 20, 2637–2665. 10.5194/acp-20-2637-2020. [DOI] [Google Scholar]
- McDonald B. C.; de Gouw J. A.; Gilman J. B.; Jathar S. H.; Akherati A.; Cappa C. D.; Jimenez J. L.; Lee-Taylor J.; Hayes P. L.; McKeen S. A.; Cui Y. Y.; Kim S. W.; Gentner D. R.; Isaacman-VanWertz G.; Goldstein A. H.; Harley R. A.; Frost G. J.; Roberts J. M.; Ryerson T. B.; Trainer M. Volatile chemical products emerging as largest petrochemical source of urban organic emissions. Science 2018, 359, 760–764. 10.1126/science.aaq0524. [DOI] [PubMed] [Google Scholar]
- Khare P.; Gentner D. R. Considering the future of anthropogenic gas-phase organic compound emissions and the increasing influence of non-combustion sources on urban air quality. Atmos. Chem. Phys. 2018, 18, 5391–5413. 10.5194/acp-18-5391-2018. [DOI] [Google Scholar]
- Shah R. U.; Coggon M. M.; Gkatzelis G. I.; McDonald B. C.; Tasoglou A.; Huber H.; Gilman J.; Warneke C.; Robinson A. L.; Presto A. A. Urban Oxidation Flow Reactor Measurements Reveal Significant Secondary Organic Aerosol Contributions from Volatile Emissions of Emerging Importance. Environ. Sci. Technol. 2020, 54, 714–725. 10.1021/acs.est.9b06531. [DOI] [PubMed] [Google Scholar]
- Sheu R.; Fortenberry C. F.; Walker M. J.; Eftekhari A.; Stönner C.; Bakker A.; Peccia J.; Williams J.; Morrison G. C.; Williams B. J.; Gentner D. R. Evaluating Indoor Air Chemical Diversity, Indoor-to-Outdoor Emissions, and Surface Reservoirs Using High-Resolution Mass Spectrometry. Environ. Sci. Technol. 2021, 55, 10255–10267. 10.1021/acs.est.1c01337. [DOI] [PMC free article] [PubMed] [Google Scholar]
- Li L.; Cocker D. R. III Molecular structure impacts on secondary organic aerosol formation from glycol ethers. Atmos. Environ. 2018, 180, 206–215. 10.1016/j.atmosenv.2017.12.025. [DOI] [Google Scholar]
- Li W.; Li L.; Chen C. L.; Kacarab M.; Peng W.; Price D.; Xu J.; Cocker D. R. III Potential of select intermediate-volatility organic compounds and consumer products for secondary organic aerosol and ozone formation under relevant urban conditions. Atmos. Environ. 2018, 178, 109–117. 10.1016/j.atmosenv.2017.12.019. [DOI] [Google Scholar]
- Charan S. M.; Buenconsejo R. S.; Seinfeld J. H. Secondary Organic Aerosol Yields from the Oxidation of Benzyl Alcohol. Atmos. Chem. Phys. 2020, 20, 13167–13190. 10.5194/acp-20-13167-2020. [DOI] [Google Scholar]
- Lim Y. B.; Ziemann P. J. Effects of molecular structure on aerosol yields from OH radical-initiated reactions of linear, branched, and cyclic alkanes in the presence of NO x. Environ. Sci. Technol. 2009, 43, 2328–2334. 10.1021/es803389s. [DOI] [PubMed] [Google Scholar]
- Loza C. L.; Craven J. S.; Yee L. D.; Coggon M. M.; Schwantes R. H.; Shiraiwa M.; Zhang X.; Schilling K. A.; Ng N. L.; Canagaratna M. R.; Ziemann P. J.; Flagan R. C.; Seinfeld J. H. Secondary organic aerosol yields of 12-carbon alkanes. Atmos. Chem. Phys. 2014, 14, 1423–1439. 10.5194/acp-14-1423-2014. [DOI] [Google Scholar]
- Tkacik D. S.; Presto A. A.; Donahue N. M.; Robinson A. L. Secondary organic aerosol formation from intermediate-volatility organic compounds: Cyclic, linear, and branched alkanes. Environ. Sci. Technol. 2012, 46, 8773–8781. 10.1021/es301112c. [DOI] [PubMed] [Google Scholar]
- Aimanant S.; Ziemann P. J. Chemical mechanisms of aging of aerosol formed from the reaction of n-pentadecane with OH radicals in the presence of NOx. Aerosol Sci. Technol. 2013, 47, 979–990. 10.1080/02786826.2013.804621. [DOI] [Google Scholar]
- Kroll J. H.; Seinfeld J. H. Chemistry of secondary organic aerosol: Formation and evolution of low-volatility organics in the atmosphere. Atmos. Environ. 2008, 42, 3593–3624. 10.1016/j.atmosenv.2008.01.003. [DOI] [Google Scholar]
- Algrim L. B.; Ziemann P. J. Effect of the Keto Group on Yields and Composition of Organic Aerosol Formed from OH Radical-Initiated Reactions of Ketones in the Presence of NOx. J. Phys. Chem. A 2016, 120, 6978–6989. 10.1021/acs.jpca.6b05839. [DOI] [PubMed] [Google Scholar]
- Bianchi F.; Kurtén T.; Riva M.; Mohr C.; Rissanen M. P.; Roldin P.; Berndt T.; Crounse J. D.; Wennberg P. O.; Mentel T. F.; Wildt J.; Junninen H.; Jokinen T.; Kulmala M.; Worsnop D. R.; Thornton J. A.; Donahue N.; Kjaergaard H. G.; Ehn M. Highly Oxygenated Organic Molecules (HOM) from Gas-Phase Autoxidation Involving Peroxy Radicals: A Key Contributor to Atmospheric Aerosol. Chem. Rev. 2019, 119, 3472–3509. 10.1021/acs.chemrev.8b00395. [DOI] [PMC free article] [PubMed] [Google Scholar]
- Presto A. A.; Huff Hartz K. E.; Donahue N. M. Secondary organic aerosol production from terpene ozonolysis. 2. Effect of NOx concentration. Environ. Sci. Technol. 2005, 39, 7046–7054. 10.1021/es050400s. [DOI] [PubMed] [Google Scholar]
- Presto A. A.; Miracolo M. A.; Kroll J. H.; Worsnop D. R.; Robinson A. L.; Donahue N. M. Intermediate-volatility organic compounds: A potential source of ambient oxidized organic aerosol. Environ. Sci. Technol. 2009, 43, 4744–4749. 10.1021/es803219q. [DOI] [PubMed] [Google Scholar]
- Kirchstetter T. W.; Singer B. C.; Harley R. A.; Kendall G. R.; Hesson J. M. Impact of California reformulated gasoline on motor vehicle emissions. 2. Volatile organic compound speciation and reactivity. Environ. Sci. Technol. 1999, 33, 329–336. 10.1021/es980374g. [DOI] [Google Scholar]
- U.S. Environmental Protection Agency . National Volatile Organic Compound Emission Standards For Consumer Products—Background for Promulgated Standards; Washington, DC, 1998. [Google Scholar]
- Li R.; Palm B. B.; Ortega A. M.; Hlywiak J.; Hu W.; Peng Z.; Day D. A.; Knote C.; Brune W. H.; de Gouw J. A.; Jimenez J. L. Modeling the radical chemistry in an oxidation flow reactor: Radical formation and recycling, sensitivities, and the OH exposure estimation equation. J. Phys. Chem. A 2015, 119, 4418–4432. 10.1021/jp509534k. [DOI] [PubMed] [Google Scholar]
- Barmet P.; Dommen J.; DeCarlo P. F.; Tritscher T.; Praplan A. P.; Platt S. M.; Prévôt A. S. H.; Donahue N. M.; Baltensperger U. OH clock determination by proton transfer reaction mass spectrometry at an environmental chamber. Atmos. Meas. Tech. 2012, 5, 647–656. 10.5194/amt-5-647-2012. [DOI] [Google Scholar]
- Donahue N. M.; Epstein S. A.; Pandis S. N.; Robinson A. L. A two-dimensional volatility basis set: 1. organic-aerosol mixing thermodynamics. Atmos. Chem. Phys. 2011, 11, 3303–3318. 10.5194/acp-11-3303-2011. [DOI] [Google Scholar]
- Wang M.; Chen D.; Xiao M.; Ye Q.; Stolzenburg D.; Hofbauer V.; Ye P.; Vogel A. L.; Mauldin R. L. III; Amorim A.; Baccarini A.; Baumgartner B.; Brilke S.; Dada L.; Dias A.; Duplissy J.; Finkenzeller H.; Garmash O.; He X. C.; Hoyle C. R.; Kim C.; Kvashnin A.; Lehtipalo K.; Fischer L.; Molteni U.; Petäjä T.; Pospisilova V.; Quéléver L. L. J.; Rissanen M.; Simon M.; Tauber C.; Tomé A.; Wagner A. C.; Weitz L.; Volkamer R.; Winkler P. M.; Kirkby J.; Worsnop D. R.; Kulmala M.; Baltensperger U.; Dommen J.; el-Haddad I.; Donahue N. M. Photo-oxidation of Aromatic Hydrocarbons Produces Low-Volatility Organic Compounds. Environ. Sci. Technol. 2020, 54, 7911–7921. 10.1021/acs.est.0c02100. [DOI] [PubMed] [Google Scholar]
- Lambe A. T.; Chhabra P. S.; Onasch T. B.; Brune W. H.; Hunter J. F.; Kroll J. H.; Cummings M. J.; Brogan J. F.; Parmar Y.; Worsnop D. R.; Kolb C. E.; Davidovits P. Effect of oxidant concentration, exposure time, and seed particles on secondary organic aerosol chemical composition and yield. Atmos. Chem. Phys. 2015, 15, 3063–3075. 10.5194/acp-15-3063-2015. [DOI] [Google Scholar]
- Simonen P.; Saukko E.; Karjalainen P.; Timonen H.; Bloss M.; Aakko-Saksa P.; Rönkkö T.; Keskinen J.; Dal Maso M. A new oxidation flow reactor for measuring secondary aerosol formation of rapidly changing emission sources. Atmos. Meas. Tech. 2017, 10, 1519–1537. 10.5194/amt-10-1519-2017. [DOI] [Google Scholar]
- Chen T.; Liu Y.; Liu C.; Liu J.; Chu B.; He H. Important role of aromatic hydrocarbons in SOA formation from unburned gasoline vapor. Atmos. Environ. 2019, 201, 101–109. 10.1016/j.atmosenv.2019.01.001. [DOI] [Google Scholar]
- Presto A. A.; Miracolo M. A.; Donahue N. M.; Robinson A. L. Secondary organic aerosol formation from high-NOx Photo-oxidation of low volatility precursors: N-alkanes. Environ. Sci. Technol. 2010, 44, 2029–2034. 10.1021/es903712r. [DOI] [PubMed] [Google Scholar]
- Gentner D. R.; Isaacman G.; Worton D. R.; Chan A. W. H.; Dallmann T. R.; Davis L.; Liu S.; Day D. A.; Russell L. M.; Wilson K. R.; Weber R.; Guha A.; Harley R. A.; Goldstein A. H. Elucidating secondary organic aerosol from diesel and gasoline vehicles through detailed characterization of organic carbon emissions. Proc. Natl. Acad. Sci. U. S. A. 2012, 109, 18318–18323. 10.1073/pnas.1212272109. [DOI] [PMC free article] [PubMed] [Google Scholar]
- Trump E. R.; Riipinen I.; Donahue N. M. Interactions between atmospheric ultrafine particles and secondary organic aerosol mass: A model study. Boreal Environ. Res. 2014, 19, 352–362. [Google Scholar]
- Donahue N. M.; Ortega I. K.; Chuang W.; Riipinen I.; Riccobono F.; Schobesberger S.; Dommen J.; Baltensperger U.; Kulmala M.; Worsnop D. R.; Vehkamaki H. How do organic vapors contribute to new-particle formation?. Faraday Discuss. 2013, 165, 91–104. 10.1039/c3fd00046j. [DOI] [PubMed] [Google Scholar]
- Wang C.; Collins D. B.; Arata C.; Goldstein A. H.; Mattila J. M.; Farmer D. K.; Ampollini L.; DeCarlo P. F.; Novoselac A.; Vance M. E.; Nazaroff W. W.; Abbatt J. P. D. Surface reservoirs dominate dynamic gas-surface partitioning of many indoor air constituents. Sci. Adv. 2020, 6, eaay8973 10.1126/sciadv.aay8973. [DOI] [PMC free article] [PubMed] [Google Scholar]
- Pankow J. F.; Asher W. E. SIMPOL.1: A simple group contribution method for predicting vapor pressures and enthalpies of vaporization of multifunctional organic compounds. Atmos. Chem. Phys. 2008, 8, 2773–2796. 10.5194/acp-8-2773-2008. [DOI] [Google Scholar]
- Schervish M.; Donahue N. M. Peroxy radical chemistry and the volatility basis set. Atmos. Chem. Phys. 2020, 20, 1183–1199. 10.5194/acp-20-1183-2020. [DOI] [Google Scholar]
- Espada C.; Shepson P. B. The production of organic nitrates from atmospheric oxidation of ethers and glycol ethers. Int. J. Chem. Kinet. 2005, 37, 686–699. 10.1002/kin.20121. [DOI] [Google Scholar]
- Vereecken L.; Peeters J. Decomposition of substituted alkoxy radicals - Part I: A generalized structure-activity relationship for reaction barrier heights. Phys. Chem. Chem. Phys. 2009, 11, 9062–9074. 10.1039/b909712k. [DOI] [PubMed] [Google Scholar]
- Orlando J. J.; Tyndall G. S. Laboratory studies of organic peroxy radical chemistry: An overview with emphasis on recent issues of atmospheric significance. Chem. Soc. Rev. 2012, 41, 6294–6317. 10.1039/c2cs35166h. [DOI] [PubMed] [Google Scholar]
- Ng N. L.; Canagaratna M. R.; Zhang Q.; Jimenez J. L.; Tian J.; Ulbrich I. M.; Kroll J. H.; Docherty K. S.; Chhabra P. S.; Bahreini R.; Murphy S. M.; Seinfeld J. H.; Hildebrandt L.; Donahue N. M.; DeCarlo P. F.; Lanz V. A.; Prévôt A. S. H.; Dinar E.; Rudich Y.; Worsnop D. R. Organic aerosol components observed in Northern Hemispheric datasets from Aerosol Mass Spectrometry. Atmos. Chem. Phys. 2010, 10, 4625–4641. 10.5194/acp-10-4625-2010. [DOI] [Google Scholar]
- Lambe A. T.; Onasch T. B.; Massoli P.; Croasdale D. R.; Wright J. P.; Ahern A. T.; Williams L. R.; Worsnop D. R.; Brune W. H.; Davidovits P. Laboratory studies of the chemical composition and cloud condensation nuclei (CCN) activity of secondary organic aerosol (SOA) and oxidized primary organic aerosol (OPOA). Atmos. Chem. Phys. 2011, 11, 8913–8928. 10.5194/acp-11-8913-2011. [DOI] [Google Scholar]
- Liu J.; Lin P.; Laskin A.; Laskin J.; Kathmann S. M.; Wise M.; Caylor R.; Imholt F.; Selimovic V.; Shilling J. E. Optical properties and aging of light-absorbing secondary organic aerosol. Atmos. Chem. Phys. 2016, 16, 12815–12827. 10.5194/acp-16-12815-2016. [DOI] [Google Scholar]
- Kostenidou E.; Lee B. H.; Engelhart G. J.; Pierce J. R.; Pandis S. N. Mass spectra deconvolution of low, medium, and high volatility biogenic secondary organic aerosol. Environ. Sci. Technol. 2009, 43, 4884–4889. 10.1021/es803676g. [DOI] [PubMed] [Google Scholar]
- Farmer D. K.; Matsunaga A.; Docherty K. S.; Surratt J. D.; Seinfeld J. H.; Ziemann P. J.; Jimenez J. L. Response of an aerosol mass spectrometer to organonitrates and organosulfates and implications for atmospheric chemistry. Proc. Natl. Acad. Sci. U. S. A. 2010, 107, 6670–6675. 10.1073/pnas.0912340107. [DOI] [PMC free article] [PubMed] [Google Scholar]
- Brownwood B.; Turdziladze A.; Hohaus T.; Wu R.; Mentel T. F.; Carlsson P. T. M.; Tsiligiannis E.; Hallquist M.; Andres S.; Hantschke L.; Reimer D.; Rohrer F.; Tillmann R.; Winter B.; Liebmann J.; Brown S. S.; Kiendler-Scharr A.; Novelli A.; Fuchs H.; Fry J. L. Gas-Particle Partitioning and SOA Yields of Organonitrate Products from NO3-Initiated Oxidation of Isoprene under Varied Chemical Regimes. ACS Earth Space Chem. 2021, 5, 785–800. 10.1021/acsearthspacechem.0c00311. [DOI] [PMC free article] [PubMed] [Google Scholar]
Associated Data
This section collects any data citations, data availability statements, or supplementary materials included in this article.