Abstract
Objective:
To test the effects of a sustained nystagmus on the head impulse response of the vestibulo-ocular reflex (VOR) in healthy subjects.
Methods:
VOR gain (slow-phase eye velocity/head velocity) was measured using video-head impulse test (vHIT) goggles. Acting as a surrogate for a spontaneous nystagmus (SN) a post-rotatory nystagmus (PRN) was elicited after a sustained, constant-velocity rotation and then head impulses were applied.
Results:
‘Raw’ VOR gain, uncorrected for PRN, in healthy subjects in response to head impulses with peak velocities in the range of 150- 250 deg/s was significantly increased (as reflected in an increase of the slope of the gain versus head velocity relationship) after inducing PRN with slow phases of nystagmus of high intensity (>30deg/s) in the same but not in the opposite direction as the slow-phase response induced by the head impulses. The values of VOR gain themselves, however, remained in the normal range with slow-phase velocities of PRN <30deg/s. Finally, quick phases of PRN were suppressed during the first 20-160ms of a head impulse; the time frame of suppression depended on the direction of PRN but not on the duration of the head impulse.
Conclusions:
Our results in normal subjects suggest that VOR gains measured using head impulses may have to be corrected for any superimposed spontaneous nystagmus when the slow-phase velocity of nystagmus is relatively high and the peak velocity of the head movements is relatively low. The suppression of quick phases during head impulses may help to improve steady fixation during rapid head movements.
Keywords: Video head impulse test, vHIT, vestibulo-ocular reflex (VOR), nystagmus
INTRODUCTION
The head impulse test (HIT) is an invaluable clinical tool for evaluating the vestibulo-ocular reflex (VOR) in patients with vertigo and imbalance (Halmagyi and Curthoys 1988). Using simple visual inspection at the bedside, as the patient fixes upon a target (often the examiner’s nose) one rotates the head with a brief, small-amplitude excursion but of high acceleration, an “impulse”, toward the side of the labyrinth being evaluated. One then looks for the telltale sign of a hypoactive labyrinth; a corrective saccade that follows and is in the direction of the inadequate slow-phase response (Halmagyi and Curthoys 1988). Using high-resolution measuring techniques that can be easily applied at the bedside, such as the video head impulse test (vHIT) (MacDougall et al. 2009), one can quantify the vestibular response, both measuring the gain (slow-phase eye movement/ head movement) of the VOR as well as the amplitude and timing of any corrective saccades (Bartl et al. 2009; MacDougall et al. 2009; Chen et al. 2014). One potential problem, however, is that patients with acute vertigo often have a spontaneous nystagmus (SN), which may make it difficult to discern any corrective saccades following the head impulse because of confounding involuntary quick phases of nystagmus. Furthermore, the slow phases of the SN might interact with the dynamic response of the VOR to the head impulse, for example, by adding or subtracting the slow-phase velocity of the SN, or altering the dynamic response directly. This in turn could lead to “false positive” corrective saccades, even when the underlying dynamic VOR response itself might be normal. This potential confound becomes a particular problem in patients with the acute vestibular syndrome and a spontaneous nystagmus when one is trying to distinguish peripheral, benign disorders such as vestibular neuritis, from central, ominous disorders such as brainstem or cerebellar stroke (Kattah et al. 2009). Indeed the absence of a head impulse sign in a patient with an acute vestibular syndrome is an important clinical clue to the localization of the lesion. With a normal head impulse response a central lesion, especially in the medial and caudal parts of the cerebellum that are supplied by the posterior inferior cerebellar artery, becomes more likely (Newman-Toker et al. 2008; Kattah et al. 2009).
As a first attempt to disentangle the effects of a nystagmus on dynamic measures of the VOR using the vHIT, we induced a transient nystagmus in healthy individuals using as a surrogate for a natural spontaneous nystagmus (SN), the post-rotatory nystagmus (PRN) that immediately occurs when the chair stops after a sustained, constant-velocity rotation. We then quantified their HIT responses until the PRN had subsided.
MATERIAL AND METHODS
Test subjects
Seven healthy individuals (two men, five women, mean age 30y, range 21-41, SD+/− 6.3) with no history of a vestibular disorder participated in this study. All subjects had normal visual acuity and normal gains (eye velocity/head velocity measured with HIT) of the VOR. Research subjects gave written informed consent, and the study was approved by the institutional review board. We performed horizontal head impulses at rest and after stopping from a sustained, constant-velocity rotation around an earth-vertical axis to see the effect of a PRN on measures of the VOR gain. PRN is not equivalent to SN occurring after an acute peripheral or central lesion since the origin and mechanism of SN is different. Although nystagmus elicited by thermal (caloric) vestibular stimulation would last longer and thus allow more time for VOR measurements, we chose rotational stimuli because responses from caloric vestibular stimulation are considerably more variable than to a chair rotation stimulus and require a supine position with the head 30 degrees up in which it would be harder to elicit head impulses.
vHIT device
Portable light-weight vHIT goggles (EyeSeeCam, University of Munich Hospital, Munich, Germany) were used for quantitative horizontal head impulse testing. A digital high-speed infrared camera (250 frames/s sample rate) was mounted on the spectacle frame and connected to a laptop through a fire wire (IEEE 1394a). A build-in inertial sensor measured head velocity during the head impulse. This VHIT device has been simultaneously tested with scleral search coils and proven reliable for quantifying head impulse responses in healthy subjects (Agrawal et al. 2014).
Vestibular stimulation
Subjects were seated on a rotational chair. The computer operating the vHIT-goggles was placed on the subject’s lap. The vHIT software was operated remotely. After calibrating the video goggles by asking the subject to look between fixed stationary targets, a baseline horizontal gain was measured (20-30 head impulses) before rotation of the chair. The chair was rotated at a constant speed of 200 deg/s in a random clockwise or counter-clockwise direction for >1 minute until the per-rotatory nystagmus had decayed to zero. The chair then stopped at a predefined position opposite to a fixation target 1.5 m away to which the subjects were instructed to look. Outwards and inward passive horizontal HITs were manually performed with unpredictable direction and timing at a maximal head velocities between 60-300°/s and with a head excursion range of 5-20°. The number of impulse stimuli applied for each subject before rotation ranged between 26 and 50 and during PRN between 14 and 54. Each subject was tested for both CW and CCW chair rotations.
Analysis of gain and nystagmus
Data were analyzed using custom programs written in Matlab™. A mean uncorrected (for SN) ‘raw’ gain (eye velocity/ head velocity) for each head impulse was calculated at the time of peak head velocity. A value for the underlying slow-phase velocity of the post-rotatory nystagmus was inferred for each head impulse by taking the average of the peak velocity of the individual slow phases (3-4 beats) just before and just after the head impulse. To calculate a ‘corrected’ gain, the inferred slow-phase velocity of the post-rotatory nystagmus was added or subtracted to the ‘raw’ peak eye velocity during the head impulse resulting in a new ‘corrected eye velocity’ which was then divided by the peak head velocity. The time of onset of quick phases occurring during each head impulse was also calculated.
Statistics
Summary statistics were calculated to describe the demographic information of the participants. The Pearson’s correlation coefficients (r) were calculated to characterize the strength and direction (negative or positive correlation) of the linear relationship between peak head velocity and gain in all three conditions: 1) No nystagmus, 2) PRN slow phase to the same direction of the slow phase of the HIT, and 3) PRN slow phase to the opposite direction of the slow phases of the HIT. We used a mixed effects model with random intercepts to account for individual variability (Zeger and Liang 1986). To examine the impact of the PRN on the relationship between peak head velocity and gain, we divided trials post-hoc into those with slow-phase velocities of PRN higher and those lower than 30 deg/s.
RESULTS
Figure 1 illustrates a typical response from one healthy individual after a leftward constant-velocity rotation of 200deg/s. The post-rotatory nystagmus (PRN) with slow phases to the left is shown before, during and after a head impulse (HIT). The insets show two consecutive head impulses, one with VOR slow phases opposite and one in the same direction, of the slow phases of PRN. One can see how the slow phases of the PRN add or subtract to the slow-phase eye velocity during the head impulses (see arrows HIT 1 and HIT 2). Slow phases of PRN reached a velocity up to 80deg/s and ‘raw’ (uncorrected for PRN) VOR gains were affected at this magnitude of nystagmus: ‘Raw’ VOR gains appeared deficient (gain 0.5, HIT 1 in fig. 1) but they grew towards 1.0 over time as the PRN dissipated. Figure 2 shows this behavior for one healthy individual. The decaying values of PRN and a “corrected” VOR gain, in which the slow-phase velocity of the PRN was added to the estimated contribution from the VOR induced by each head impulse, using the value of its maximum head velocity, are also shown. Note that the uncorrected ‘raw’ VOR gain values agree with the hypothesis that slow-phase velocity of the PRN is added to the dynamic VOR gain response. While all individuals had the same pattern of VOR gains over time, not all individuals reached a PRN with slow phases higher than 50deg/s. Aggregate results are shown in figure 3: The baseline, pre-rotation, median ‘raw’ gain value (uncorrected, on y-axis) was 0.99 (interquartile range (IQR) 0.17) and the ‘raw’ gain increased to a median value of 1.23 (IQR 0.22) with PRN with slow-phase velocities of nystagmus >30deg/s towards the same side and decreased to a median gain of 0.68 (IQR 0.18) if the slow-phases of PRN were in the opposite direction of the VOR.
Fig. 1.
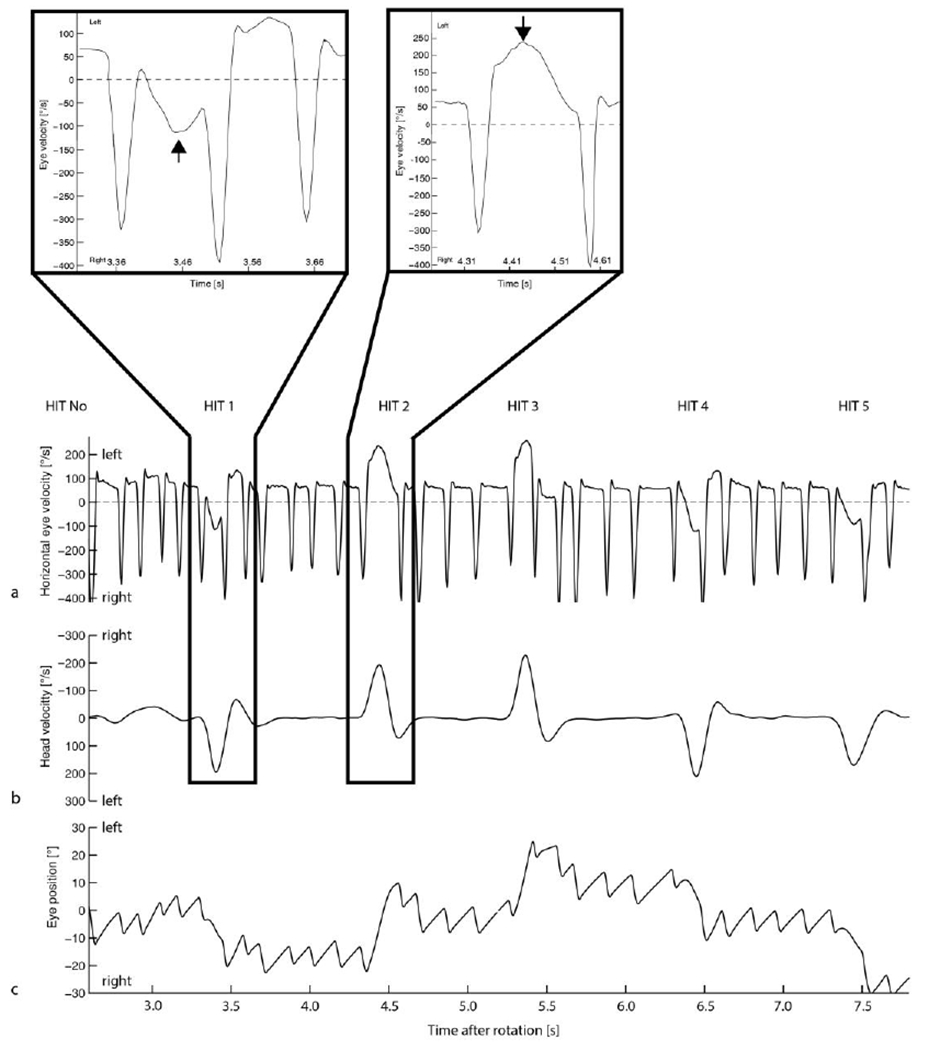
Representative illustration of five head impulses (HIT, 1-5) after a left earth-vertical-axis rotation at 200deg/s. Horizontal eye velocity is shown in (a) with the higher-velocity, downward spikes indicating the occurrence of quick phases and the lower-velocity, flatter portion of the traces reflecting the slow phases of the post-rotatory nystagmus (PRN) plus the additional dynamic VOR response stimulated by the superimposed head impulse. Head velocity is shown in b. Eye position traces are shown in c. The first head impulse (HIT1) with the slow phase of PRN directed oppositely to the slow phase of the HIT induced VOR (b) and the second impulse with slow phases in the same direction, are magnified and shown in the insets.
Fig. 2.
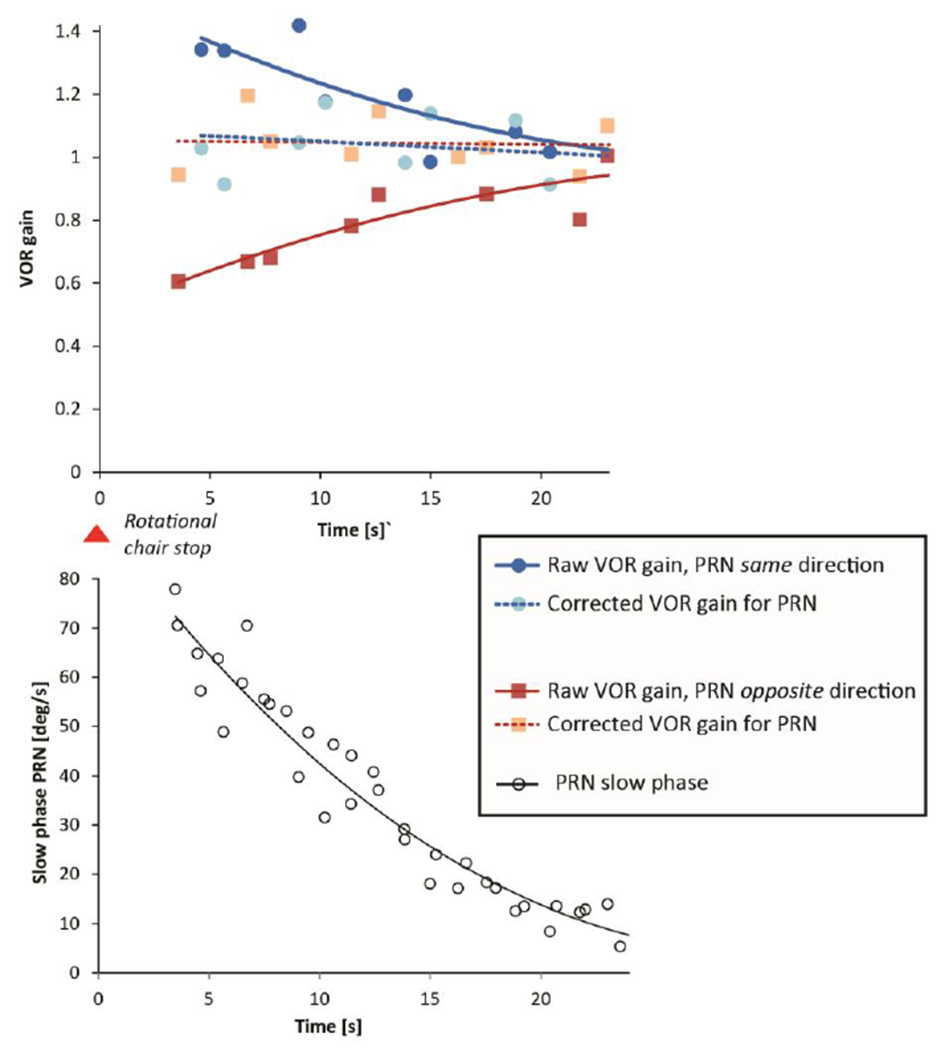
Uncorrected VOR ‘raw’ gain (eye velocity/head velocity) over time is depicted for one healthy subject after an earth-vertical-axis rotation at 200deg/s. VOR ‘raw’ gain is shown with superimposed, post-rotatory, nystagmus (PRN) slow phases in the same direction as the VOR slow phases (blue dots) or in the opposite direction (red squares). Second degree polynomial curves are fit to the VOR gain points. Light red squares or light blue dots indicate the ‘corrected’ VOR gain. The ‘corrected’ VOR gain was calculated from an expected, ideal value for slow-phase velocity, based on head velocity with a correction for the contribution from the inferred slow-phase velocity of the PRN (white circles), based on the pre and post impulse values of the nystagmus. All of the corrected VOR values cluster around a gain of 1.0.
Fig. 3.
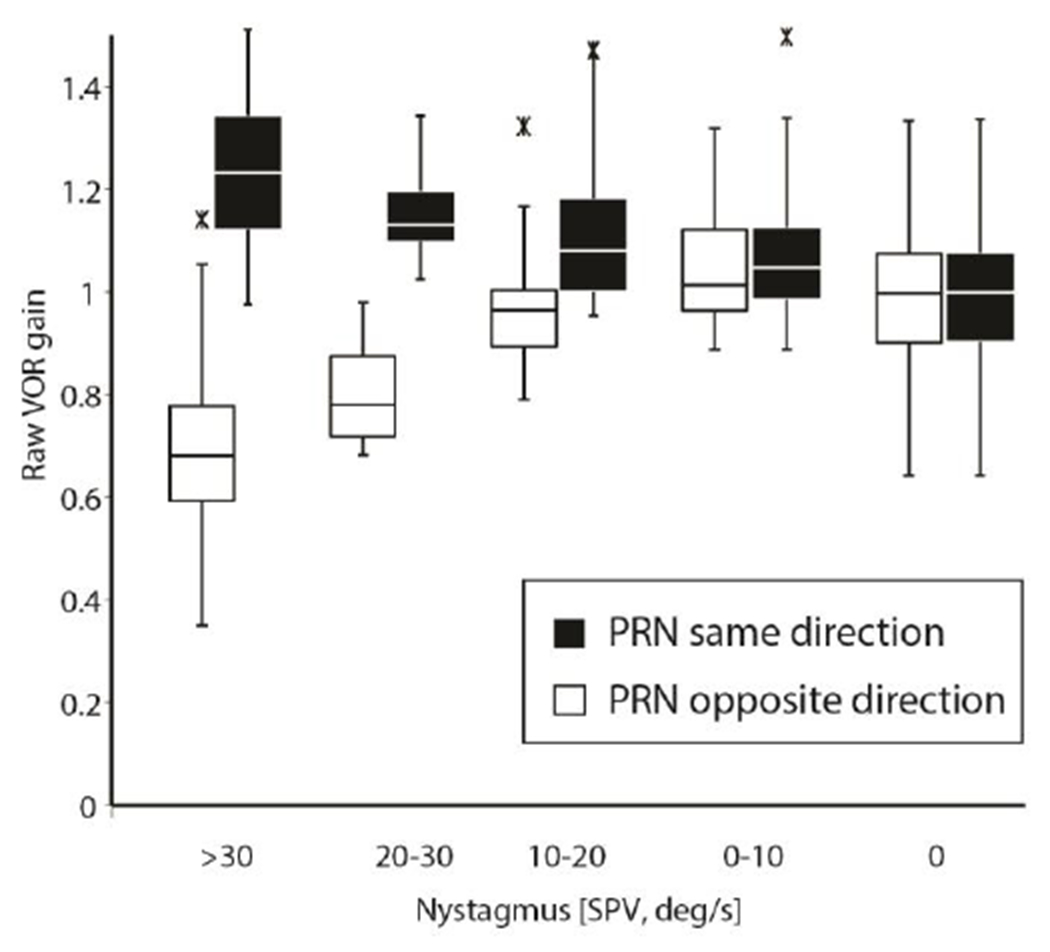
Box plots (lower quartile, median, and upper quartile, and whiskers representing 1.5 times the interquartile range) demonstrating aggregate uncorrected ‘raw’ gain results from all trials at all head speeds (60-300deg/s), segregated by different ranges of PRN and direction of rotation. Outliers are shown as asterisks. There was a significant change in VOR ‘raw’ gain at PRN > 10deg/s depending on the relative directions of the head impulse and the slow phases of the nystagmus (see details in text).
Low intensity slow-phase velocity nystagmus and VOR gain
Figure 4 shows the uncorrected ‘raw’ VOR gain with and without PRN. The uncorrected ‘raw’ VOR gain also depended on peak head velocity showing a negative correlation at baseline (Fig. 4, no PRN, baseline slope (dotted line) = −0.0011 unit Gain/ unit of head velocity, r =−0.42). At lower slow-phase velocities (10-30 deg/s) of PRN the superimposed nystagmus did not significantly affect the baseline slope of ‘raw’ gain as a function of head velocity if the slow phase of PRN was in the same (p=0.4399, t=−0.77df=323) direction of the slow phase of the VOR induced by the head impulse. The slope of ‘raw’ gain was, however, affected by PRN with slow phases in the opposite direction (p=0.0321, t=2.15, df=323) though VOR gain values still remained within the normal range (Figure 3)(Weber et al. 2008a; Weber et al. 2009).
Fig. 4. ‘Raw’ VOR gain with low intensity PRN (<30deg/s).
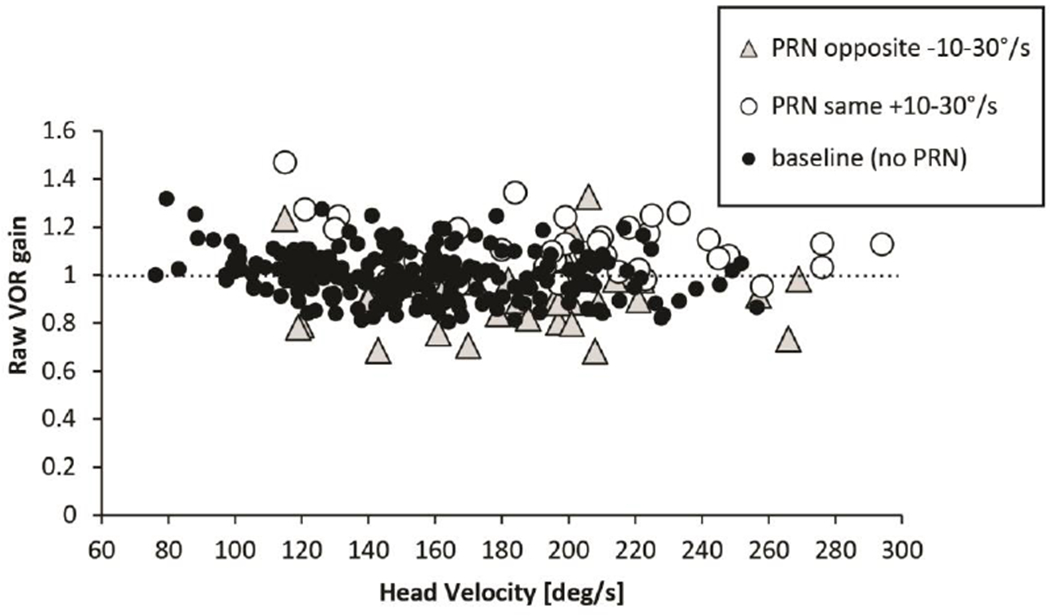
Scatterplot illustrating ‘raw’, uncorrected VOR gain (a-c) as a function of head velocity with low PRN (range 10-30 deg/s). The regression coefficients of head impulses without PRN (baseline) were not significantly different than for test conditions with superimposed low intensity PRN (<30deg/s) when slow phases were in the same direction as the induced response to the head impulse but there was an effect when they were in the opposite direction.
The mean velocity and acceleration time series of the head impulses were monitored in order to guarantee a similar spectrum of head impulses under different conditions: Mean peak head acceleration occurred at nearly the same time whether or not there was a superimposed PRN (23.3ms (+/−SD 11.2) for baseline head impulses without PRN, 27.9ms (+/−SD 14.9) for head impulses with PRN with the same slow-phase direction, and 25.8ms (+/−SD 12.3) for head impulses with PRN with the opposite slow-phase direction).
High intensity slow-phase velocity nystagmus and VOR gain
Figure 5 shows a scatter plot (‘Raw’ gain in response to impulses plotted versus head velocity) with regression slopes for trials comparing baseline results with high intensity slow-phase velocities (30-70deg/s) of PRN in either direction. This magnitude of PRN affected the slopes significantly if the slow phases of PRN were in the same direction as the slow phases of the VOR. Gain was relatively increased at lower head velocities when the superimposed slow phases of PRN were in the same direction as the slow phases of the VOR (p=0.008, t=−2.67, df=319, addition effect). When the slow phases of PRN were directed oppositely to the slow phases of the VOR, there was a non-significant trend (p=0.1028, t=1.64, df=319, subtraction effect) for a decrease in the gain (fig. 3 and 5). Figure 6, using a three axis plot, helps one to visualize the interaction between VOR gain, head velocity and PRN in healthy subjects (compare with data in figures 3 and 4): one sees again a negative correlation between VOR gain and head velocity and a positive correlation between uncorrected VOR gain and the velocity of the slow phases of PRN (direction dependent, compare with data in figure 3). Once the VOR gains are corrected for the PRN (Fig. 6b), the VOR gain is much less influenced by the PRN though there still is an inverse relationship between VOR gain and head velocity.
Fig. 5. ‘Raw’ VOR gain with high intensity PRN (>30deg/s).
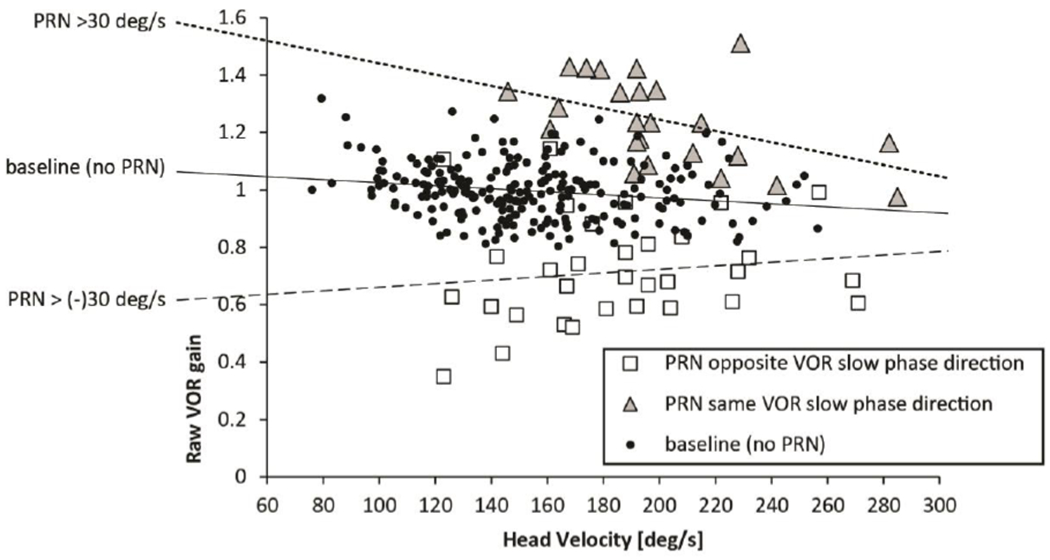
Head velocity is plotted against ‘raw’ VOR gain in seven healthy subjects with high intensity PRN (30-70deg/s). Note the different slopes of the dotted regression lines biased by the direction and the degree of PRN.
Fig. 6.
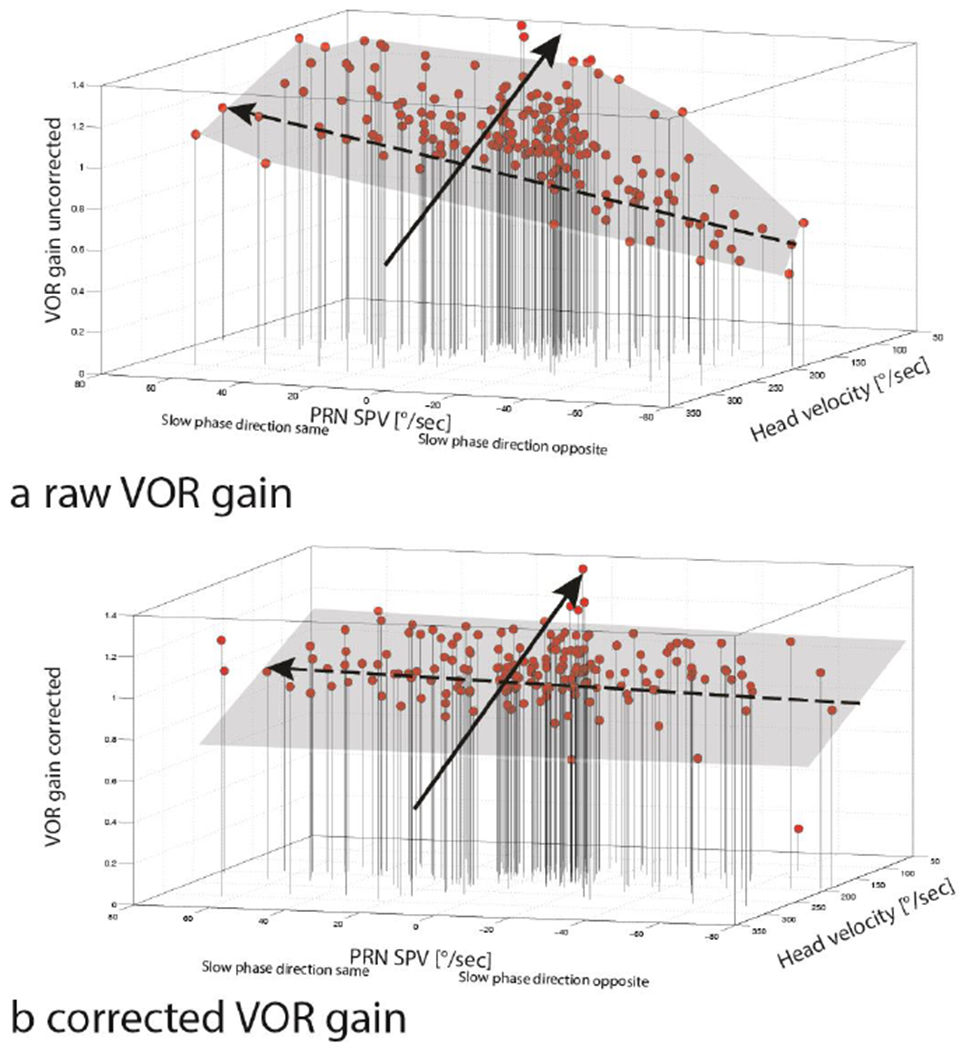
3d plots showing the effects of PRN and head velocity on uncorrected,’ raw’ (a) and corrected (b) VOR gain from seven health subjects (189 HITs) after a constant -velocity rotation (200°/s). In (a) one sees that very fast head movements (>250°/s) in conjunction with high-velocity slow phases of PRN directed opposite to the VOR slow phase were associated with lower gains (<0.8, right anterior, inferior corner), however low head velocities (<100°/s) in conjunction with high-velocity slow phases of PRN to the same direction as the VOR slow phase , were associated with high VOR gains (>1.2) (left superior, posterior corner). Panel b shows a corrected VOR gain after adding the slow-phase velocity of the PRN to the slow-phase velocity measured during the HIT. Note that the interaction between PRN and VOR gain isconsiderably attenuated but there still is an inverse relationship between head velocity and VOR gain. Dashed black arrows indicate the trend line showing the interaction between PRN and VOR gain. Continuous black arrows illustrate the trend line showing the interaction between head velocity and VOR gain.
Suppression of nystagmus quick phases
The density plot of quick phases of nystagmus (slow phases the same (blue) versus opposite (red) direction as the slow phases of the VOR) occurring at a specific time during a head impulse (latency onset of quick phase relative to onset of head movement, absolute latencies) is shown in figure 7a. Note that quick phases could occur before the head impulse as they would be triggered as part of the PRN response. The latencies of quick phases were normalized to a standard HIT duration of 200ms (fig. 7b, relative latencies). Both density plots showed a reduced number of quick phases beating in either direction relative to the direction of the slow phase occurring during the first 0-60ms (fig. 7, red curves) or 20-150ms (fig. 7, blue curves) of a head impulse. We detected two inhibitory patterns depending on the direction of PRN slow phase: There was a sustained delayed suppression (+20ms) of the PRN slow phases beating towards the same direction as the SPV HIT (blue curve) and a slightly later but longer lasting suppression to PRN SPV opposite direction to the SPV HIT (red curve). Neither inhibitory pattern depended on the normalized HIT duration; both density plots (fig. 7a and b) show statistically the same frequency distribution in relation to a HIT.
Fig. 7.
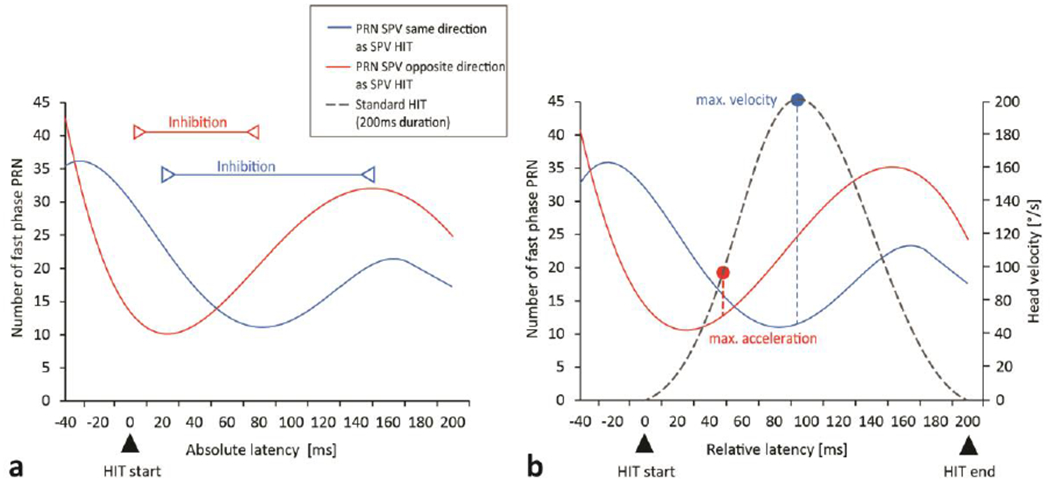
The frequency of quick phases of PRN appearing at a specific time just before and during a head impulse is shown in density plots for absolute latencies [based on actual HIT length] (a) and relative latencies [normalized to a standard HIT length of 200ms] (B). Zero milliseconds indicates the beginning of a head impulse (a and b), 200ms indicates the end of the normalized head impulse duration (b). Solid lines illustrate the frequency of PRN (slow phase) beating in the same direction (blue curves) to the slow phase HIT or in the opposite direction (red curves). The inhibitory time frame is shown by red and blue lines. Peak head velocity and acceleration are shown relative to the suppression of quick phases (b). There is no change between density plot a and b which indicates the suppression effect is also related to dynamic characteristics of the head and eye movements rather than just the specific time in the impulse response.
DISCUSSION
The main finding of this study was that measures of the VOR gain using high-acceleration, high-velocity head impulses were affected by a post-rotatory nystagmus (PRN)with slow-phase velocities in the range of 10-30 deg/s (as reflected in the slopes of VOR gain and head velocity relationship), however, uncorrected VOR gain values still remained within the normal range (Weber et al. 2008a; Weber et al. 2009). On the other hand, uncorrected VOR gain values did change significantly at higher nystagmus velocities and at lower head velocities. The implication of a normal VOR gain at low intensity PRN is that even though the vestibular nuclei on the two sides are imbalanced, as reflected in the PRN, the slow-phase response to a superimposed high-acceleration, high-speed stimulus remains intact. An uncorrected VOR gain is most affected when 1) the nystagmus is quite brisk (>30deg/s SPV), 2) the slow phase of the SN is in the same direction as the slow phase of the VOR (addition effect of the slow-phase velocity, fig. 5), and 3) head velocities are relatively low (<150deg/s). There was also a trend towards lower, uncorrected VOR gains at higher head velocities when the slow phase of the SN was in the opposite direction as the slow phase of the VOR (subtraction effect of slow-phase eye velocity, fig. 5).
Just as for head impulse responses in the absence of nystagmus, VOR gain in the presence of nystagmus depended on the velocity of the head, decreasing with higher head speeds. In addition, the quick phases of nystagmus were often suppressed during the initial phase of a HIT.
Background and comparison with other studies
Early on, in previous experimental animal studies, VOR gain was corrected based on the underlying slow-phase velocity of the nystagmus, assuming a linear (superposition) interaction (Fetter and Zee 1988) (Fetter et al. 1988). This kind of VOR gain adjustment to correct for spontaneous nystagmus was used with human subjects as well (Glasauer et al. 2004). Glasauer et al. showed that downbeating nystagmus did not affect the vertical VOR when corrected for the spontaneous nystagmus (Glasauer et al. 2004), though the slow-phase velocity of the downbeat nystagmus velocity was low, ranging only from 0.8-9.4 deg/s. The results in our study are in line with previous studies though we did show that the horizontal uncorrected VOR was modulated by PRN in healthy subjects when slow-phase velocities were higher than 30deg/s.
In our study, VOR gain decreased with increasing head velocity (Fig. 4–6). A decrease of the VOR response at higher frequencies was found in monkeys at high peak velocities (Fetter and Zee 1988) and also at high accelerations (Lasker et al. 2000). Similar changes in the dynamic responses of the VOR have been found in cats (Maioli et al. 1983) and in guinea pigs (Gilchrist et al. 1998). This phenomenon is also present in healthy human subjects (Paige 1989) and in patients with unilateral vestibular hypofunction (Halmagyi et al. 2001; Weber et al. 2008a). Healthy subjects show a linear response of the rotational VOR to en bloc body rotations up to velocities of 350 deg/s (Pulaski et al. 1981). This velocity saturation has been attributed to Ewald’s second law meaning that the firing rate of the contralateral vestibular nuclei would have been driven to an inhibitory cutoff at higher speeds and not able to contribute further to the VOR response.
In our study a PRN had no influence on the overall linearity of the VOR, however, the size of the effect (negative correlation (r), slopes in fig. 4) changed with PRN . If the slow-phase speed did not exceed 30deg/s, the response to HITs at velocities higher than 180deg/s still showed gain values within normal limits. In addition, VOR gain decreased with increasing head velocity, as was shown by Halmagyi and colleagues (Halmagyi et al. 2001). We were able to influence uncorrected ‘raw’ VOR gain measures in healthy subjects by superimposing brisk nystagmus at velocities > 30deg/s with slow phases in the same direction of the slow phases of the VOR induced by the HIT (fig. 3 and 5) but this effect was not statistically significant for slow phases of PRN directed oppositely to the slow phase of the VOR induced by the HIT. The complicated interaction between head velocity and PRN on VOR gain (fig. 6), and the consequent differences between the addition and subtraction effects of the PRN depending on the direction of the VOR, reflect the fact that effects of the PRN are more pronounced at low head velocities, but also that VOR gain increases with lower head velocities. Thus, for example, the subtraction effects did not significantly reduce higher VOR gains at low head velocities.
Finally, by analyzing the time frame and frequency of superimposed PRN quick phases during the head impulses, we observed a short period (60ms if PRN slow phases were in the same direction as the head impulse induced response, 130ms if PRN slow phases were in the opposite direction to the head impulse induced response) of relative quick phase inhibition, maximal at 20ms and 80 ms, respectively, after HIT onset. There are analytical models that simulate the generation of quick phases in the VOR (Schmid and Lardini 1976; Chun and Robinson 1978). A common feature is that the quick phases are triggered when a specific threshold variable is reached which depends on the position of the eye in the orbit and the strength of the vestibular signal, i.e. head or eye velocity. Our study showed a reduced number of quick phases of nystagmus during and even before the initial portion of the head impulse response. The mechanism of this suppression of quick phases could be related to factors including mental set (attempted fixation of a stationary target which inhibits quick phases naturally) as well dynamic signals of head velocity or acceleration from neck afferents or the labyrinth. Such a suppression of nystagmus during a quick head rotation might be helpful for stabilizing images on the retina in healthy subjects.
Potential Implications
With the advent of quantitative bedside testing of the VOR, and especially using the head impulse test (HIT) in patients with spontaneous nystagmus as part of the acute vestibular syndrome (Tarnutzer et al. 2011) it is necessary to know how a spontaneous nystagmus might influence the dynamic response of the vestibular system to superimposed head rotations. Our main result is that the “artificial” spontaneous nystagmus induced following a sustained constant-velocity rotation did not meaningfully alter the dynamic (time to peak velocity) VOR response to the head impulse, and that the uncorrected gains were within the normal range, provided head velocities were relatively high (>150 deg/s) and spontaneous nystagmus was relatively low (< 30deg/s) (figures 3 and 4). These results suggest that quantitative measures of the VOR during head impulses give reliable measures of VOR gain in patients with acute vertigo and spontaneous nystagmus (Mantokoudis et al. 2015b). One caveat, of course, is that the clinician must know whether or not a spontaneous nystagmus is already being corrected for by the analysis software. Furthermore, the suppression of SN quick phases during a HIT might actually help the interpretation of responses recorded using video goggles since automated VOR gain calculations using slow-phase velocities are more accurate if there are no intervening corrective saccades or nystagmus (Mantokoudis et al. 2015a). In addition, a period of suppression of quick phases during fast head movements might influence the analysis of corrective saccade latencies and cumulative saccade amplitudes, which differ in patients with central and peripheral causes of vertigo (Chen et al. 2014).
Strengths and limitations of the study
To our knowledge, this is the first study investigating the influence of nystagmus on h-HIT testing. Several caveats must be remembered. First, a spontaneous nystagmus from a loss of vestibular function produces an asymmetrical unnatural pattern of labyrinthine stimulation that is quite different from the more normal pattern of stimulation during post-rotatory nystagmus. We also measured the PRN in the light so that visual fixation could have reduced the slow-phase velocity of the PRN (nystagmus suppression). Thus, the degree of tone imbalance between the vestibular nuclei could have been at a higher level than expected from the observed degree of nystagmus with fixation. Furthermore we chose to measure responses in the light to better simulate how head impulses would be tested under normal clinical conditions. For the same reason, we chose a mobile vHIT device which is easily used at the bedside. The starting and ending positions of the eye in the orbit were not uniform in each h-HIT, and depended on the h-HIT direction and starting position of the head. The VOR gain in healthy subjects, however, is modulated little by the position of the eye in the orbit (Anagnostou et al. 2011). Our analysis of the occurrence of quick phases was also likely influenced by the attempt of fixation of a stationary target. Only the right eye was recorded. Depending on which eye is recorded, gain could be slightly over- or underestimated since the neural pathways differ between adduction and abduction (Weber et al. 2008b). These VOR gain differences, however, are small and would not affect our overall conclusions.
Conclusions
Moderate degrees of a post rotatory nystagmus (up to 30deg/s), little altered measurements of the horizontal VOR gain using high speed HITs. When speeds of spontaneous nystagmus were relatively high (> 30 deg/s) and head velocities were relatively low (<150deg/s) a correction for the SN was needed. Those who use head impulses to assay the function of the VOR should perform head impulses in an optimal velocity range (approximately 150-250deg/s) in order to get a best estimate of the VOR gain. Corrections for spontaneous nystagmus are recommended when its slow-phase velocity exceeds 30 deg/s or head velocities are low. Quick phase eye movements are suppressed during the initial phase of a head impulse, which may help in interpreting the results of quantitative HIT on the gain of the VOR.
Acknowledgement
The research was supported by grants from the Swiss National Science Foundation (Dr. Mantokoudis, PBBEP2 136573). Dr. Newman-Toker’s effort was supported in part by a grant from the National Institutes of Health (1U01DC013778-01A1). Interacoustics loaned vHIT equipment for research.
Footnotes
Conflict of Interest
The authors declare that they have no conflict of interest.
Contributor Information
Georgios Mantokoudis, Department of Neurology, Johns Hopkins University School of Medicine and University Department of Otorhinolaryngology, Head and Neck Surgery, Inselspital Bern, Switzerland.
Ali S. Saber Tehrani, Department of Neurology, Johns Hopkins University School of Medicine.
Li Xie, Department of Biostatistics, The Johns Hopkins University School of Public Health, Baltimore.
Karin Eibenberger, Department of Otolaryngology – Head and Neck Surgery, Johns Hopkins University School of Medicine and University of Applied Sciences Upper Austria, Department of Medical Engineering, Linz, Austria.
Bernhard Eibenberger, Department of Otolaryngology – Head and Neck Surgery, Johns Hopkins University School of Medicine.
Dale Roberts, Department of Neurology, Johns Hopkins University School of Medicine.
David E. Newman-Toker, Department of Neurology, Johns Hopkins University School of Medicine.
David S. Zee, Department of Neurology, Johns Hopkins University School of Medicine.
REFERENCES
- Agrawal Y, Schubert MC, Migliaccio AA, Zee DS, Schneider E, Lehnen N, Carey JP (2014) Evaluation of quantitative head impulse testing using search coils versus video-oculography in older individuals. Otol Neurotol 35:283–288 doi: 10.1097/MAO.0b013e3182995227 [DOI] [PMC free article] [PubMed] [Google Scholar]
- Anagnostou E, Heimberger J, Sklavos S, Anastasopoulos D (2011) Alexander’s law during high-acceleration head rotations in humans. Neuroreport 22:239–243 doi: 10.1097/WNR.0b013e3283451769 [DOI] [PubMed] [Google Scholar]
- Bartl K, Lehnen N, Kohlbecher S, Schneider E (2009) Head impulse testing using video-oculography. Ann N Y Acad Sci 1164:331–333 doi: NYAS03850 [pii] 10.1111/j.1749-6632.2009.03850.x [DOI] [PubMed] [Google Scholar]
- Chen L, Todd M, Halmagyi GM, Aw S (2014) Head impulse gain and saccade analysis in pontine-cerebellar stroke and vestibular neuritis. Neurology 83:1513–1522 doi: 10.1212/WNL.0000000000000906 [DOI] [PMC free article] [PubMed] [Google Scholar]
- Chun KS, Robinson DA (1978) A model of quick phase generation in the vestibuloocular reflex. Biol Cybern 28:209–221 [DOI] [PubMed] [Google Scholar]
- Fetter M, Zee DS (1988) Recovery from unilateral labyrinthectomy in rhesus monkey. J Neurophysiol 59:370–393 [DOI] [PubMed] [Google Scholar]
- Fetter M, Zee DS, Proctor LR (1988) Effect of lack of vision and of occipital lobectomy upon recovery from unilateral labyrinthectomy in rhesus monkey. J Neurophysiol 59:394–407 [DOI] [PubMed] [Google Scholar]
- Gilchrist DP, Curthoys IS, Cartwright AD, Burgess AM, Topple AN, Halmagyi M (1998) High acceleration impulsive rotations reveal severe long-term deficits of the horizontal vestibulo-ocular reflex in the guinea pig. Exp Brain Res 123:242–254 [DOI] [PubMed] [Google Scholar]
- Glasauer S, von Lindeiner H, Siebold C, Buttner U (2004) Vertical vestibular responses to head impulses are symmetric in downbeat nystagmus. Neurology 63:621–625 [DOI] [PubMed] [Google Scholar]
- Halmagyi GM, Aw ST, Cremer PD, Curthoys IS, Todd MJ (2001) Impulsive testing of individual semicircular canal function. Ann.N.Y.Acad.Sci 942:192–200 [DOI] [PubMed] [Google Scholar]
- Halmagyi GM, Curthoys IS (1988) A clinical sign of canal paresis. Arch.Neurol 45:737–739 [DOI] [PubMed] [Google Scholar]
- Kattah JC, Talkad AV, Wang DZ, Hsieh YH, Newman-Toker DE (2009) HINTS to diagnose stroke in the acute vestibular syndrome: three-step bedside oculomotor examination more sensitive than early MRI diffusion-weighted imaging. Stroke 40:3504–3510 doi: STROKEAHA.109.551234 [pii] 10.1161/STROKEAHA.109.551234 [doi] [DOI] [PMC free article] [PubMed] [Google Scholar]
- Lasker DM, Hullar TE, Minor LB (2000) Horizontal vestibuloocular reflex evoked by high-acceleration rotations in the squirrel monkey. III. Responses after labyrinthectomy. J Neurophysiol 83:2482–2496 [DOI] [PubMed] [Google Scholar]
- MacDougall HG, Weber KP, McGarvie LA, Halmagyi GM, Curthoys IS (2009) The video head impulse test: diagnostic accuracy in peripheral vestibulopathy. Neurology 73:1134–1141 [DOI] [PMC free article] [PubMed] [Google Scholar]
- Maioli C, Precht W, Ried S (1983) Short- and long-term modifications of vestibulo-ocular response dynamics following unilateral vestibular nerve lesions in the cat. Exp Brain Res 50:259–274 [DOI] [PubMed] [Google Scholar]
- Mantokoudis G, Saber Tehrani AS, Kattah JC, Eibenberger K, Guede CI, Zee DS, Newman-Toker DE (2015a) Quantifying the vestibulo-ocular reflex with video-oculography: nature and frequency of artifacts. Audiol Neurootol 20:39–50 doi: 10.1159/000362780 [DOI] [PubMed] [Google Scholar]
- Mantokoudis G, Saber Tehrani AS, Wozniak A, et al. (2015b) VOR Gain by Head Impulse Video-Oculography Differentiates Acute Vestibular Neuritis from Stroke. Otol Neurotol 36:457–465 doi: 10.1097/MAO.0000000000000638 [DOI] [PubMed] [Google Scholar]
- Newman-Toker DE, Kattah JC, Alvernia JE, Wang DZ (2008) Normal head impulse test differentiates acute cerebellar strokes from vestibular neuritis. Neurology 70:2378–2385 doi: 70/24_Part_2/2378 [pii] 10.1212/01.wnl.0000314685.01433.0d [doi] [DOI] [PubMed] [Google Scholar]
- Paige GD (1989) Nonlinearity and asymmetry in the human vestibulo-ocular reflex. Acta Otolaryngol 108:1–8 [DOI] [PubMed] [Google Scholar]
- Pulaski PD, Zee DS, Robinson DA (1981) The behavior of the vestibulo-ocular reflex at high velocities of head rotation. Brain Res 222:159–165 [DOI] [PubMed] [Google Scholar]
- Schmid R, Lardini F (1976) On the predominance of anti-compensatory eye movements in vestibular nystagmus. Biol Cybern 23:135–148 [DOI] [PubMed] [Google Scholar]
- Tarnutzer AA, Berkowitz AL, Robinson KA, Hsieh YH, Newman-Toker DE (2011) Does my dizzy patient have a stroke? A systematic review of bedside diagnosis in acute vestibular syndrome. CMAJ 183:E571–592 doi: 10.1503/cmaj.100174 [DOI] [PMC free article] [PubMed] [Google Scholar]
- Weber KP, Aw ST, Todd MJ, McGarvie LA, Curthoys IS, Halmagyi GM (2008a) Head impulse test in unilateral vestibular loss: vestibulo-ocular reflex and catch-up saccades. Neurology 70:454–463 [DOI] [PubMed] [Google Scholar]
- Weber KP, Aw ST, Todd MJ, McGarvie LA, Curthoys IS, Halmagyi GM (2009) Horizontal head impulse test detects gentamicin vestibulotoxicity. Neurology 72:1417–1424 doi: 10.1212/WNL.0b013e3181a18652 [DOI] [PubMed] [Google Scholar]
- Weber KP, Aw ST, Todd MJ, McGarvie LA, Pratap S, Curthoys IS, Halmagyi GM (2008b) Inter-ocular differences of the horizontal vestibulo-ocular reflex during impulsive testing. Prog Brain Res 171:195–198 doi: 10.1016/S0079-6123(08)00626-2 [DOI] [PubMed] [Google Scholar]
- Zeger SL, Liang KY (1986) Longitudinal data analysis for discrete and continuous outcomes. Biometrics 42:121–130 [PubMed] [Google Scholar]


