

Key Points
Question
Is an amyloid probability score based on a mass spectrometry–based blood test measuring plasma amyloid β 42:40 ratio and apoE proteotype plus age, associated with identifying brain amyloidosis among patients with cognitive impairment?
Findings
In this cohort study of 686 participants from 2 separate studies, the developed Amyloid Probability Score showed high concordance with amyloid PET status, with an area under the curve of 0.88 and overall accuracy of 81%. The test’s findings were significantly associated with the presence or absence of brain amyloidosis as determined by positron emission tomography.
Meaning
These findings suggest that this blood test had robust performance in detecting brain amyloidosis and could aid clinicians in the diagnosis of Alzheimer disease among patients with cognitive impairment.
This cohort study assesses the clinical performance associated with a diagnostic algorithm to estimate brain amyloid status in positron emission tomography (PET) findings among adults with cognitive impairment.
Abstract
Importance
The diagnostic evaluation for Alzheimer disease may be improved by a blood-based diagnostic test identifying presence of brain amyloid plaque pathology.
Objective
To determine the clinical performance associated with a diagnostic algorithm incorporating plasma amyloid-β (Aβ) 42:40 ratio, patient age, and apoE proteotype to identify brain amyloid status.
Design, Setting, and Participants
This cohort study includes analysis from 2 independent cross-sectional cohort studies: the discovery cohort of the Plasma Test for Amyloidosis Risk Screening (PARIS) study, a prospective add-on to the Imaging Dementia–Evidence for Amyloid Scanning study, including 249 patients from 2018 to 2019, and MissionAD, a dataset of 437 biobanked patient samples obtained at screenings during 2016 to 2019. Data were analyzed from May to November 2020.
Exposures
Amyloid detected in blood and by positron emission tomography (PET) imaging.
Main Outcomes and Measures
The main outcome was the diagnostic performance of plasma Aβ42:40 ratio, together with apoE proteotype and age, for identifying amyloid PET status, assessed by accuracy, sensitivity, specificity, and area under the receiver operating characteristic curve (AUC).
Results
All 686 participants (mean [SD] age 73.2 [6.3] years; 368 [53.6%] men; 378 participants [55.1%] with amyloid PET findings) had symptoms of mild cognitive impairment or mild dementia. The AUC of plasma Aβ42:40 ratio for PARIS was 0.79 (95% CI, 0.73-0.85) and 0.86 (95% CI, 0.82-0.89) for MissionAD. Ratio cutoffs for Aβ42:40 based on the Youden index were similar between cohorts (PARIS: 0.089; MissionAD: 0.092). A logistic regression model (LRM) incorporating Aβ42:40 ratio, apoE proteotype, and age improved diagnostic performance within each cohort (PARIS: AUC, 0.86 [95% CI, 0.81-0.91]; MissionAD: AUC, 0.89 [95% CI, 0.86-0.92]), and overall accuracy was 78% (95% CI, 72%-83%) for PARIS and 83% (95% CI, 79%-86%) for MissionAD. The model developed on the prospectively collected samples from PARIS performed well on the MissionAD samples (AUC, 0.88 [95% CI, 0.84-0.91]; accuracy, 78% [95% CI, 74%-82%]). Training the LRM on combined cohorts yielded an AUC of 0.88 (95% CI, 0.85-0.91) and accuracy of 81% (95% CI, 78%-84%). The output of this LRM is the Amyloid Probability Score (APS). For clinical use, 2 APS cutoff values were established yielding 3 categories, with low, intermediate, and high likelihood of brain amyloid plaque pathology.
Conclusions and Relevance
These findings suggest that this blood biomarker test could allow for distinguishing individuals with brain amyloid–positive PET findings from individuals with amyloid-negative PET findings and serve as an aid for Alzheimer disease diagnosis.
Introduction
Alzheimer disease (AD) is the most common form of dementia and is one of the greatest health challenges for the 21st century.1 AD or related dementia affects approximately 50 million people worldwide and 6.1 million people in the US, with 1 million more at early disease stages in the US. By 2060, the number of people with AD is estimated to reach 13.8 million people in the US.2 AD is pathologically characterized by extracellular accumulation of amyloid-β (Aβ) in amyloid plaques, intracellular accumulation of tau in tangles, neuronal and synaptic loss, brain atrophy, and inflammation.3,4,5,6 Significant evidence suggests that Aβ peptides accumulate in the brain and generate a cascade of events that results in neurodegeneration and clinical dementia of the Alzheimer type.7,8,9,10
Early AD diagnosis and its differentiation from other dementias are imperative for early treatment and prevention. AD diagnosis based on clinical criteria alone has insufficient sensitivity and specificity, leading to high misdiagnosis rates among individuals with mild cognitive impairment. The clinical sensitivity for AD diagnosis ranges from 70.9% to 87.3% whereas specificity ranges from 44.3% to 70.8%.11 Considerable progress over the last several decades in the development of amyloid positron emission tomography (PET) and cerebrospinal fluid (CSF) biomarkers has enabled the detection of brain amyloid plaques that are necessary for an AD diagnosis.12 The Imaging Dementia–Evidence for Amyloid Scanning (IDEAS) study13 demonstrated that incorporating amyloid PET findings into the clinical evaluation of study patients changed the etiologic diagnosis from AD to non-AD in 25.1% of patients and from non-AD to AD in 10.5% of patients, resulting in changes in their clinical treatment plan after PET in 60.2% patients. While amyloid PET and CSF biomarker measures have reduced misdiagnosis rates when used, broad-scale clinical implementation remains challenging because of their high cost, patient avoidance of invasive diagnostic procedures or radiation exposure, limited reimbursement, and restricted availability.
Several studies have shown that high-precision mass spectrometry (MS) assays for plasma Aβ42 and Aβ40 levels can accurately detect brain amyloidosis as well as estimate conversion to brain amyloid positivity approximately 5 years prior to a positive amyloid result in a PET scan.14,15,16,17 Recently, we reported the analytical validation parameters and proof-of-principle clinical performance for a blood test using high-resolution tandem MS to quantify plasma Aβ42 and Aβ40 concentrations and to identify the presence or absence of plasma apolipoprotein E isoform-specific peptides (apoE proteotype) along with patient age in detecting brain amyloid plaques.18,19 In this study, we report the first application of this validated test, certified by the College of American Pathologists and Clinical Laboratory Improvement Amendments of 1988, for measuring Aβ42:40 ratio and apoE in samples from the discovery cohort of the Plasma Test for Amyloidosis Risk Screening (PARIS) study, a subset of samples prospectively collected for the purpose of establishing test performance. The collected data were used to develop an algorithm using Aβ42:40 ratio, apoE, and age to estimate the amyloid PET status of patients. The developed algorithm was validated on biobanked samples from MissionAD. A final algorithm was constructed combining the samples from both cohorts yielding the Amyloid Probability Score (APS) for estimating brain amyloid PET status in adults aged at least 60 years with mild cognitive impairment (MCI) or mild dementia being evaluated for AD.
Methods
For this cohort study, the PARIS and MissionAD studies were reviewed and approved by central or local ethics and safety review committees or boards. All participants (or their legally authorized representative) reviewed and signed an approved informed consent document. This study is reported following the Strengthening the Reporting of Observational Studies in Epidemiology (STROBE) reporting guideline.
PARIS Study
Participants were prospectively enrolled into the PARIS study, a C2N-sponsored substudy of the IDEAS study (ClinicalTrials.gov Identifier: NCT02420756). IDEAS evaluated the clinical utility of amyloid PET in Medicare beneficiaries with MCI or dementia meeting Appropriate Use Criteria for amyloid PET.13 The objective of the PARIS study was to establish and validate the clinical performance of this MS-based blood test for identifying brain amyloid status as determined by amyloid PET findings. Participants enrolled between October 1, 2018, and January 4, 2019, were included in the PARIS discovery cohort analysis presented here. In the PARIS discovery cohort, 253 plasma samples were collected and analyzed for Aβ40 and Aβ42 concentrations and apoE peptides. Of these, 249 patients-sample pairs had results from both PET images and blood samples.
MissionAD Study
The MissionAD consisted of 2 global phase 3 studies (ClinicalTrials.gov Identifier: NCT02956486) that tested the safety and efficacy of elenbecestat (BACE inhibitor) in participants with MCI due to AD or mild AD dementia with amyloid positivity confirmed by PET visual read or CSF test.20 A total of 516 individual baseline screening plasma samples were selected to yield approximately 50% positive prevalence of amyloid PET results defined by PET visual read. Of these plasma samples, 437 had corresponding amyloid PET performed under the same screening process within 80 days, and these imaging results were used in the final data analysis. eTable 1 in the Supplement lists the eligibility criteria for the 2 cohorts. For analyses of both PARIS and MissionAD samples, investigators remained blinded to all patient demographic data and PET results until plasma analysis was completed and data were locked. Race and ethnicity were self-reported at time of enrollment into the studies according to the US Census Bureau race and ethnicity categories for use as demographic variable in the analysis (PARIS) and per FDA guidance (MissionAD).
Amyloid PET Analysis
In the PARIS discovery cohort, 3 amyloid PET tracers were used: (18F)florbetapir (Amyvid; Lilly Diagnostics), (18F)florbetaben (Neuraceq; Life Molecular Imaging) or (18F)flutemetamol (Vizamyl; GE Healthcare). While in the IDEAS study, amyloid PET scans were interpreted visually by local radiologists and nuclear medicine physicians, for PARIS, amyloid PET images were obtained and processed by the American College of Radiology and analyzed by 2 board-certified radiologists with amyloid PET tracer–specific training. In the MissionAD data set used for this study, 2 amyloid PET tracers were used: (18F)florbetapir and (18F)florbetaben, and amyloid PET images were processed by Bioclinica. Image analyses, including standardized uptake value ratio to Centiloid conversion, are described in the eMethods in the Supplement. For purposes of determining eligibility for MissionAD, PET visual read was used. Based on published evidence,21,22 we a priori defined amyloid positivity for our analyses as Centiloid value greater than 25, which is a more sensitive threshold for brain amyloid plaques than visual read.
Plasma Sample Analyses
Blood sample collection methods were similar between PARIS and MissionAD studies.18,20 MS-based plasma Aβ42:40 ratio and apoE proteotype determination have been described previously18 and outlined in the eMethods in the Supplement.
Statistical Analysis
All data analyses were performed using R statistical software version 4.0.0 (R Project for Statistical Computing). Binary logistic regression models (LRM) were used to estimate amyloid positivity based on plasma Aβ42:40 ratio, apoE proteotype (encoded as presence of either 1 or 2 E4 alleles as well as presence of E2 allele), and age. Detailed methods and algorithm development are described in eMethods in the Supplement. P values were 2-sided, and statistical significance was set at α = .05. Data were analyzed from May to November 2020.
Results
Demographic and Clinical Characteristics
Plasma samples for participants in the PARIS discovery cohort were collected from a total of 253 IDEAS participants, and of these, 249 participants had results from both PET images and blood samples. For MissionAD, 437 out of the 516 baseline samples had corresponding Centiloid values for amyloid PET, plasma Aβ42:40, apoE proteotype, and age, resulting in a total cohort of 686 participants (mean [SD] age, 73 [6.3] years; 368 [53.6%] men). All participants had symptoms of MCI or mild dementia, and all participants had both amyloid PET scans and blood samples assessed. In total, 378 participants (55.1%) had amyloid positive results on PET. Baseline characteristics for the PARIS and MissionAD participants are summarized in Table 1.
Table 1. Baseline Characteristics for PARIS and MissionAD Cohorts.
| Characteristic | Participants, No. (%) | ||
|---|---|---|---|
| PARIS (n = 249) | MissionAD (n = 437) | Combined (N = 686) | |
| Age, mean (SD) [range], y | 74.6 (5.7) [65-91] | 72.4 (6.4) [60-85]a | 73.2 (6.3) [60-91] |
| Sex | |||
| Men | 143 (57.4) | 225 (51.5) | 368 (53.6) |
| Women | 106 (42.6) | 212 (48.5) | 318 (46.4) |
| Disease staging | |||
| Dementia | 77 (30.9) | 17 (3.9)b | 94 (13.7) |
| MCI | 172 (69.1) | 411 (94.1)b | 583 (85.0) |
| MMSE score | |||
| 27-30 | 84 (48.6)c | 250 (57.2) | 334 (54.8) |
| Mean (SD) | 24.7 (5.1)c | 26.8 (1.7) | 26.2 (3.2) |
| Centiloid | |||
| Mean (SD) | 52.3 (46.2) | 42.8 (50.2) | 46.2 (48.9) |
| Positive (>25) | 161 (64.7) | 217 (49.7) | 378 (55.1) |
| Amyloid PET tracer | |||
| Florbetapir | 177 (71.1) | 53 (12.1) | 230 (33.5) |
| Florbetaben | 55 (22.1) | 384 (87.9) | 439 (64.0) |
| Flutemetamol | 17 (6.8) | 0 | 17 (2.5) |
| Race | |||
| African American | 5 (2.0) | 25 (5.7) | 30 (4.4) |
| American Indian | 1 (0.4) | 0 | 1 (0.1) |
| Asian | 3 (1.2) | 12 (2.7) | 15 (2.2) |
| Pacific Islander | 0 | 1 (0.2) | 1 (0.1) |
| White | 228 (91.6) | 393 (89.9) | 621 (90.5) |
| Not reported | 2 (0.8) | 1 (0.2) | 3 (0.4) |
| Otherd | 0 | 5 (1.1) | 5 (0.7) |
| Unknown | 10 (4) | 0 | 10 (1.5) |
| apoE proteotype | |||
| E2/E2 | 0 | 2 (0.5) | 2 (0.3) |
| E2/E3 | 15 (6) | 31 (7.1) | 46 (6.7) |
| E2/E4 | 8 (3.2) | 9 (2.1) | 17 (2.5) |
| E3/E3 | 116 (46.6) | 210 (48.1) | 326 (47.5) |
| E3/E4 | 80 (32.1) | 158 (36.2) | 238 (34.7) |
| E4/E4 | 30 (12) | 27 (6.2) | 57 (8.3) |
| Plasma Aβ42, mean (SD), pg/mL | 47.0 (8.9) | 45.6 (7.9) | 46.1 (8.3) |
| Plasma Aβ40, mean (SD), pg/mL | 542.1 (107.5) | 504.3 (80.3) | 518.0 (92.8) |
| Plasma Aβ42:40 ratio, mean (SD) | 0.087 (0.007) | 0.091 (0.009) | 0.089 (0.009) |
Abbreviations: Aβ, amyloid β; MCI, mild cognitive impairment; MMSE, Mini-Mental State Examination; PARIS, Plasma Test for Amyloidosis Risk Screening.
Although sample selection criteria for MissionAD cohort included participants aged 50 years and older at the time of sample collection, owing to sample availability, only samples from participants aged 60 years and older were received and analyzed.
In the MissionAD cohort, 3 patients did not have a diagnosis and 6 patients had diagnosis of “no criteria met.”
The MMSE data set from the PARIS cohort had 76 missing values.
Patients self-reporting other race did not provide further information.
Participant age, sex, and apoE proteotype frequencies were similar between the PARIS discovery cohort and the included subset of MissionAD samples. The MissionAD cohort, compared with the PARIS cohort, had more participants who were cognitively less impaired (defined as Mini Mental State Examination score, 27-30; 250 participants [57.2%] vs 84 participants [48.6%]; Fisher P = .06) and higher mean Mini Mental State Examination score (mean [SD] score, 26.8 [1.7] vs 24.7 [5.1]; t test P < .001), consistent with the finding that brain amyloidosis prevalence was lower in the MissionAD cohort (217 participants [49.7%]) than the PARIS cohort (161 participants [64.7%]). The MissionAD cohort, compared with the PARIS cohort, had more Asian participants (12 participants [2.7%] vs 3 participants [1.2%]) and African American participants (25 participants [5.7%] vs 5 participants [2.0%]) and fewer White participants (393 participants [89.9%] vs 228 participants [91.6%]). The most common amyloid PET tracer used in the combined cohorts was florbetaben (439 participants [64.0%]) followed by florbetapir (230 participants [33.5%]). Relatively few scans in the PARIS cohort (17 participants [6.8%]) were obtained using flutemetamol.
Accuracy of Plasma Aβ42:40 Ratio Alone and With apoE and Age for Identifying the Presence of Brain Amyloid Positivity
PARIS Cohort
Samples from the prospective PARIS study were analyzed first. In this cohort, the mean plasma Aβ42:40 ratio was 7.6% (95% CI, 5.3%-8.6%) lower in the amyloid-positive than in the amyloid-negative group (P < .001; Figure 1A). Receiver operating characteristics analysis showed that a plasma Aβ42:40 cutoff value of 0.089 maximized sensitivity and specificity (Youden index; Figure 1A). The area under the curve (AUC) was 0.79 (95% CI, 0.73-0.85) (Figure 1D). Aβ42:40 ratios plotted against Centiloid scores for all 249 patients showed that 77% of the patients were in the true positive (137 participants) or true negative (55 participants) quadrants, indicating Aβ42:40 ratios were concordant with amyloid PET status (Figure 1C). A smaller number of patients (22.9% total) were classified as false positive (33 participants) or false negative (24 participants) (Figure 1C). Sensitivity was 85% and specificity 63%. Positive predictive value (PPV) was 81%, and negative predictive value (NPV) was 70%.
Figure 1. Diagnostic Performance of Plasma Amyloid-β (Aβ)42:40 Ratio Alone and Combined With Age and apoE Proteotype.
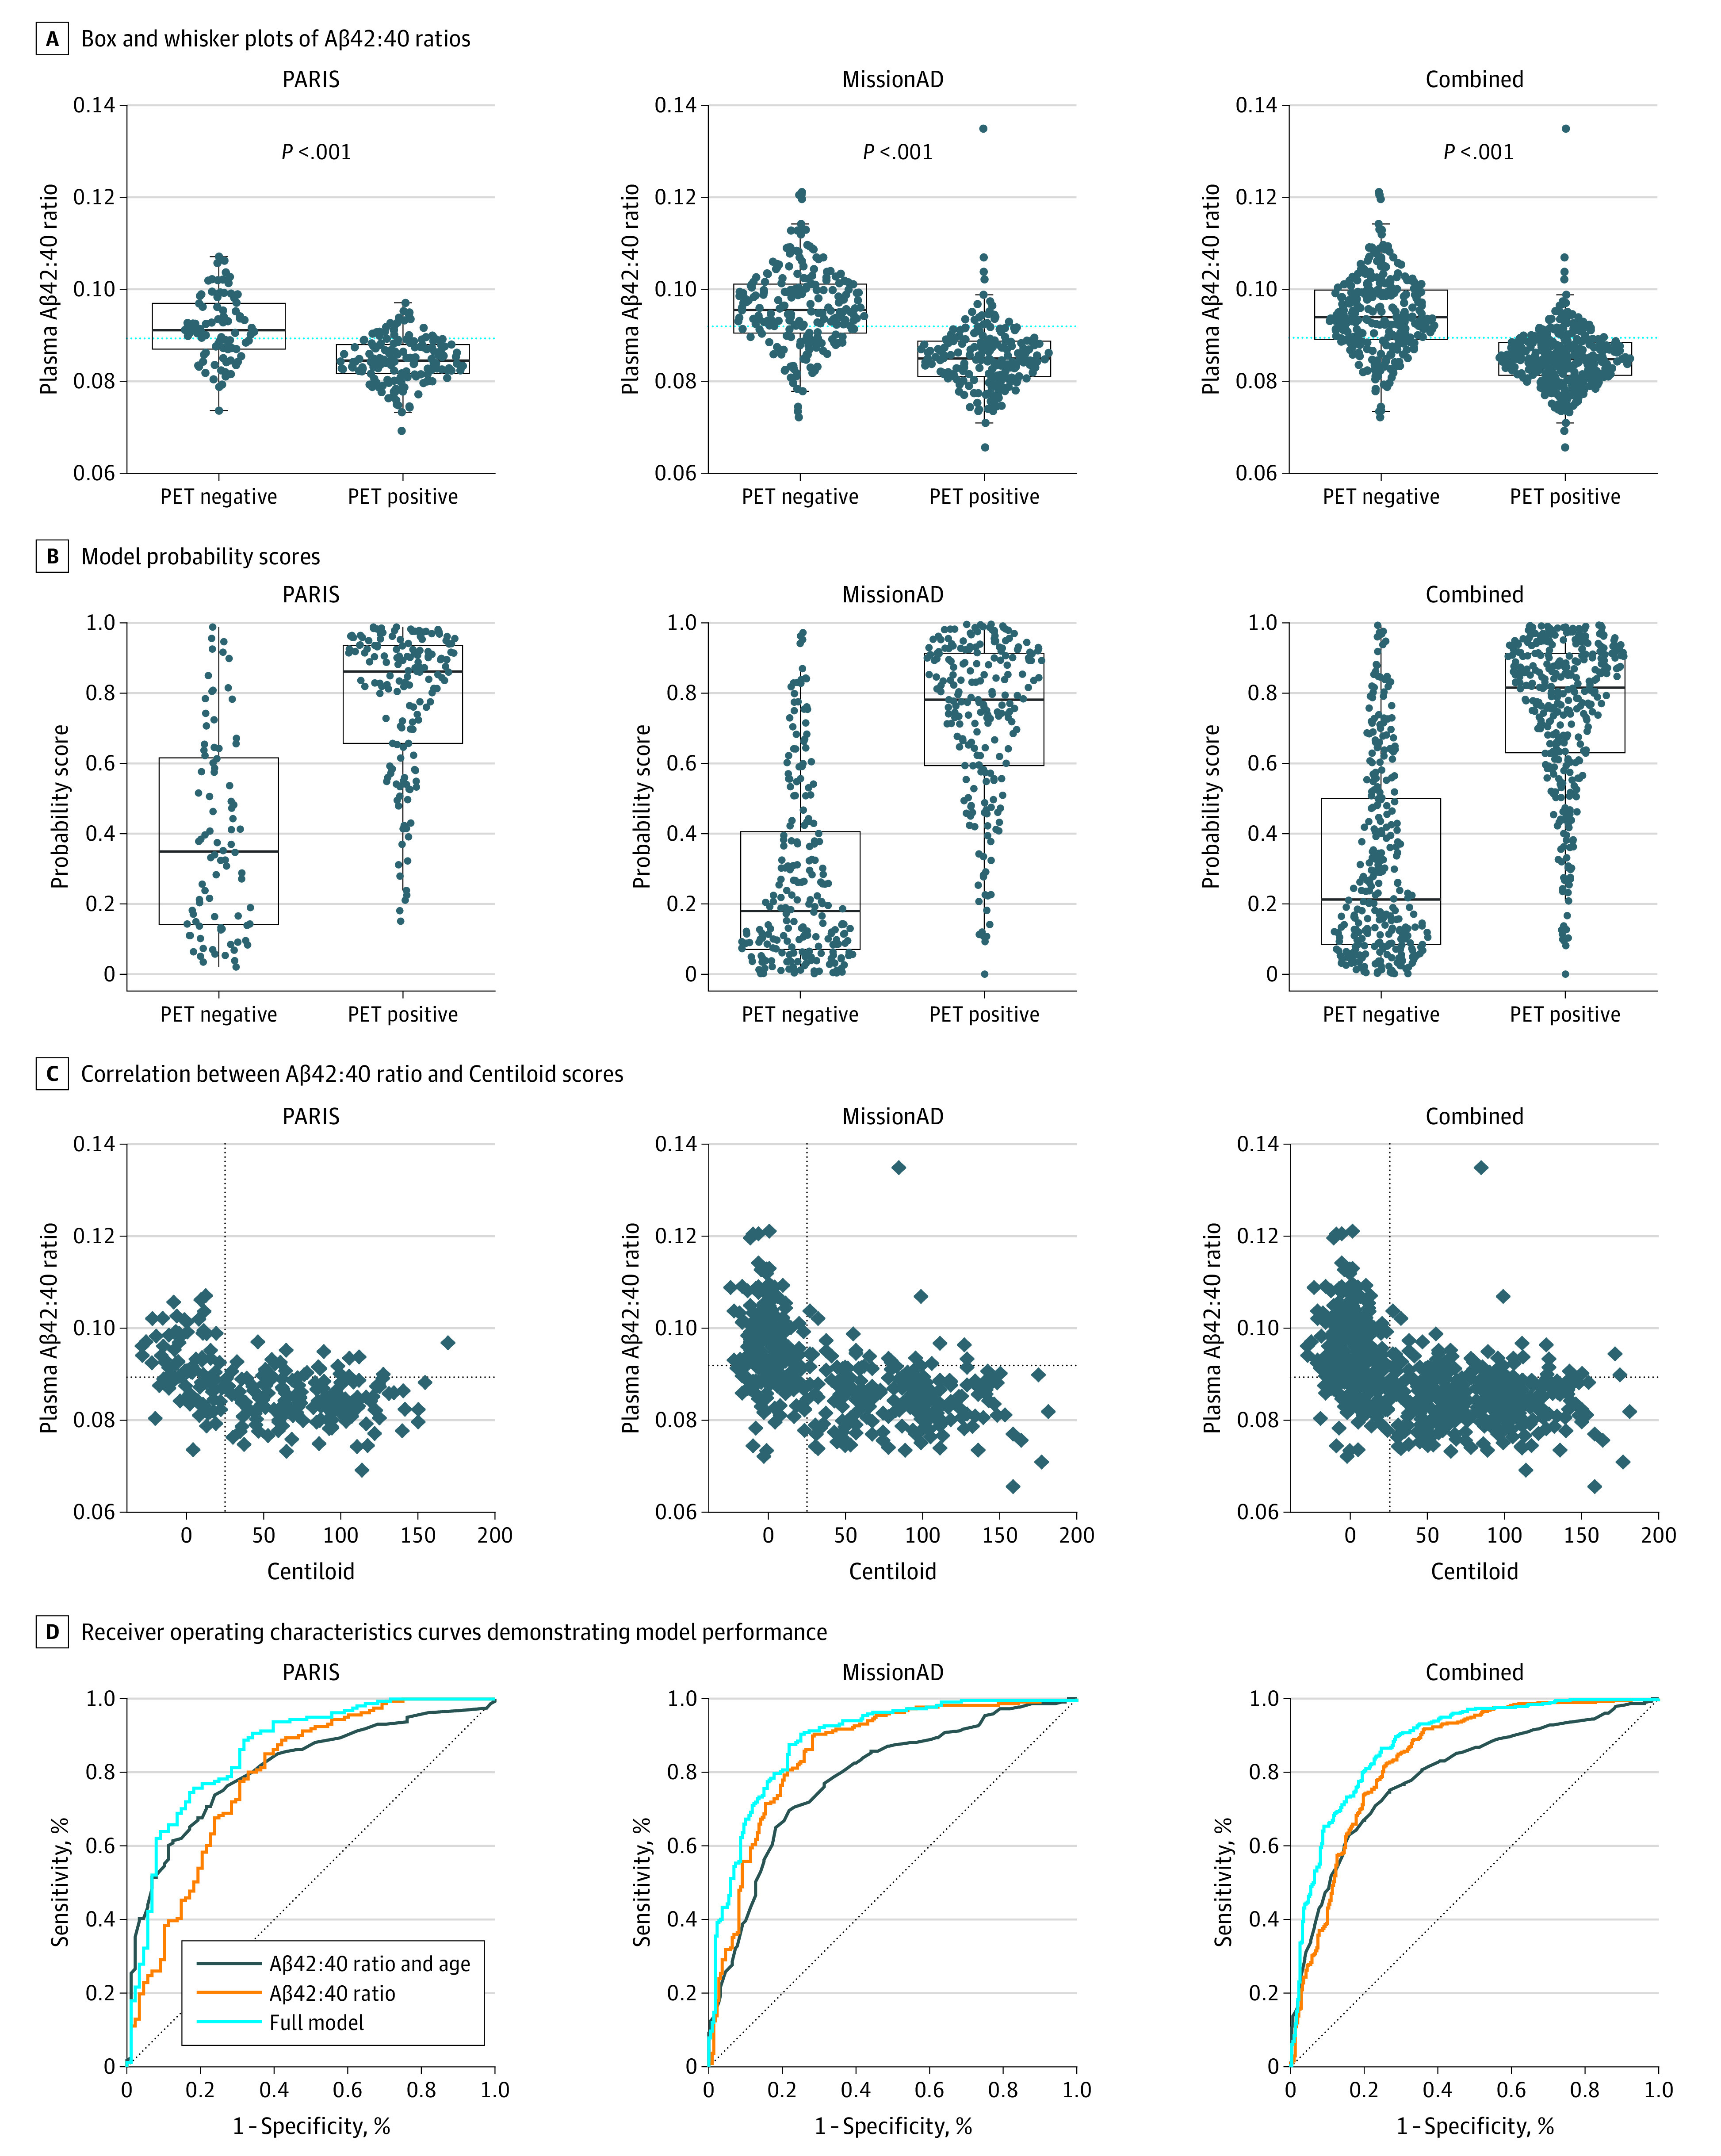
A and B, PET positive indicates Centiloid greater than 25 in positron emission tomograph scans; PET negative, Centiloid of 25 or less; dotted blue line, cutoff value defined by the Youden index for each cohort (A); points, individual patient ratios; bold lines, medians; boxes, IQRs; and whiskers, IQR × 1.5. B, Each plot shows the scores that were calculated using the model trained on that cohort. C, Correlation between Aβ42:40 ratio and Centiloid scores for each of the cohorts. vertical dotted line indicates Centiloid of 25; horizontal dotted line, cohort-specific cutoff value for the Aβ42:40 ratio defined by the Youden index for the Aβ42:40 ratio. Patients falling in the top left quadrant are true-negatives, and patients in the bottom right corner are true-positives.
In addition to the plasma Aβ42:40 ratio, age and apoE proteotype were evaluated to aid in the estimation of amyloid PET results. An LRM was constructed using plasma Aβ42:40 ratio, age, apoE E4 copy number (1 or 2), and apoE E2 presence as variables to optimize estimation of brain amyloid status compared with using plasma Aβ42:40 alone. eTable 3 in the Supplement lists the odds ratios for each of the inputs into the model trained on the PARIS discovery cohort. This LRM improved the AUC to 0.86 (95% CI, 0.81-0.91) (Figure 1D) and overall accuracy to 78% (95% CI, 72%-83%). Model estimation scores and their distributions for the amyloid PET-positive vs amyloid PET-negative groups are shown in Figure 1B. The AUC for a model including just age and apoE (no Aβ) was marginally better than plasma Aβ42:40 ratio alone in this data set, reaching 0.81 (95% CI, 0.76-0.87) (Figure 1D). However, when age, apoE, and Aβ42:40 were combined, model performance significantly improved compared with Aβ42:40 ratio alone (DeLong P < .001). Similarly, the full model was significantly better than the model including just age and apoE (DeLong P = .007).
MissionAD Cohort
After completion of PARIS sample analysis, biobanked samples from MissionAD became available for analysis. In this cohort, plasma Aβ42:40 ratio was 11.1% (95% CI 9.3%-12.3%) lower in the amyloid PET-positive group than in the amyloid-negative group (P < .001), and AUC analysis indicated an optimal (Youden) plasma Aβ42:40 cutoff value of 0.092 (Figure 1A). In MissionAD, the AUC for Aβ42:40 ratio alone was 0.86 (95% CI, 0.82-0.89) (Figure 1D). Figure 1C shows the concordance between plasma Aβ42:40 and brain amyloid PET-positive or amyloid PET-negative status for all 437 patients, with 196 true positives (44.9%), 157 true negatives (35.9%), 63 false positives (14.4%), and 21 false negatives (4.8%). The overall accuracy was 81% (95% CI, 77%-84%). Sensitivity was 90% (95% CI, 86%-94%), and specificity was 71% (95% CI, 65%-77%). PPV was 76% (95% CI, 70%-81%), and NPV was 88% (95% CI, 83%-93%).
As expected, when age, apoE E4 (factor) and apoE E2 (presence) were added to plasma Aβ42:40 ratio to construct an LRM, the performance improved (Figure 1B), with AUC reaching 0.89 (95% CI, 0.86-0.92; DeLong P = .002) and an overall accuracy of 83% (95% CI, 79%-86%). For comparison, the AUC for just age, apoE E4 and apoE E2 was 0.79 (95% CI, 0.74-0.83; DeLong P < .001) (Figure 1D). The model parameters are included in eTable 3 in the Supplement.
Validation of Model From PARIS Cohort on MissionAD Samples
The model developed on the PARIS cohort was applied to the samples from MissionAD to validate the performance of the model generated on the prospectively collected samples on a novel data set (Table 2). AUC and accuracy of the PARIS model was conserved when applied to the Mission AD samples. Similarly, no significant changes were seen in sensitivity or specificity of the test (Table 2). PPVs and NPVs changed in the expected directions considering the difference in amyloid prevalence between the cohorts. The intercept and slope of the estimation model calibration curve shows that the LRM-estimated risk was well calibrated to the observed prevalence in a new data set (eFigure 4 in the Supplement).
Table 2. Performance of Models Developed on PARIS and MissionAD Cohorts, and Validation of PARIS Model on MissionAD.
| Training cohort, % (95% CI)a | |||
|---|---|---|---|
| PARIS | PARIS | MissionAD | |
| Model applied to | PARIS | MissionAD | MissionAD |
| AUC | 0.86 (0.81-0.91) | 0.88 (0.84-0.91) | 0.89 (0.86-0.92) |
| Accuracy | 78 (72-83) | 78 (74-82) | 83 (79-86) |
| Sensitivity | 76 (68-82) | 73 (66-79) | 88 (82-92) |
| Specificity | 82 (72-89) | 83 (77-87) | 78 (72-83) |
| PPV | 88 (82-93) | 81 (74-86) | 80 (74-85) |
| NPV | 65 (55-74) | 76 (70-81) | 86 (81-91) |
Abbreviations: AUC, area under the receiver operating characteristic curve; NPV, negative predictive value; PARIS, Plasma Test for Amyloidosis Risk Screening; PPV, positive predictive value.
Model refers to a logistic regression model that incorporates plasma amyloid β42:40 ratio, age, apoE E4 (factor), and apoE E2 (presence).
Combined Analyses and the APS Score
To develop an LRM for clinical use, the data from both cohorts were combined to train a comprehensive estimating algorithm. The Aβ42:40 ratio was a mean of 10.3% (95% CI, 8.7%-10.9%) lower in the amyloid-positive group (P < .001) (Figure 1A). For the Aβ42:40 ratio, the optimal sensitivity and specificity cutoff (Youden) was 0.089, leading to overall accuracy of 79% (95% CI, 75%-82%), sensitivity of 82% (95% CI, 78%-86%), and specificity of 74% (95% CI, 69%-79%) (Figure 1A).
An LRM that included Aβ42:40 ratio, age, apoE E4 (factor, 1 or 2 alleles) and apoE E2 (presence) was fitted on the combined data sets (Figure 1B and C, model did not take into account which cohort the sample originated from). While the odds ratio for Aβ42:40 was conserved between all models, the value of apoE inclusion was refined in the combined data set, owing to the increase in patients with each of the various genotypes (eTable 3 and eFigure 1 in the Supplement). Values for apoE E2 did not achieve statistical significance but was included in the final model since the direction of the outcome in the model was consistent with the known protective association of apoE E2.23 AUC improved to 0.88 (95% CI, 0.85-0.91), compared with AUC of 0.84 (95% CI, 0.81-0.87) when using Aβ42:40 ratio alone (DeLong P < .001) (Figure 1D). For comparison, the AUC for just age, apoE E4 and apoE E2 was 0.79 (95% CI, 0.76-0.83; DeLong P < .001). Based on this LRM, we derived the APS, calculated from the output of the logistic regression by scaling the output from 0 to 1 to 0 to 100.
Since the prevalence of amyloid positivity in the selected samples from the MissionAD cohort was 50% positive and 50% negative based on sample selection criteria, a population with 60% prevalence was used to select APS cutoff values optimizing the test’s PPVs and NPVs. This prevalence approximates the prevalence in the IDEAS study, a large, nationally representative cohort of patients with MCI and mild dementia of unknown etiology. An intermediate APS range was implemented to increase NPV and PPV. The optimal APS cutoff values were chosen to balance the tradeoff between high accuracy and a low frequency of intermediate results. Based on the association between APS cutoff values and PPV and NPV in a 60% prevalence population (eFigure 2 in the Supplement), 86% agreement between the blood test and amyloid PET status provided an optimal compromise between high overall accuracy and low frequency of intermediate scores. The lower APS cutoff was defined as 35, and the upper cutoff was 58. Applying these APS cutoff values to the combined data set (Figure 2), the algorithm correctly classified 199 of 226 participants with negative amyloid PET findings to the low APS group and 303 of 365 participants with positive amyloid PET findings into the high APS group, corresponding to 88% (95% CI, 83%-92%) NPV and 83% (95% CI, 79%-87%) PPV (Table 3). A total of 95 participants (13.8%) fell into the intermediate category (Table 3). After reweighting for 60% amyloid PET-positive prevalence, the NPV and PPV were both 86% (Table 3). The following APS categories and applicable interpretations were defined: low APS (0-35), consistent with a negative amyloid PET result and a low likelihood of amyloid plaques; intermediate APS (36-57), does not distinguish between the presence or absence of amyloid plaques; and high APS (58-100), consistent with a positive amyloid PET result and a high likelihood of amyloid plaques.
Figure 2. Density Plot Showing the Distribution of the Amyloid Probability Score Results in the Combined Data Set for Amyloid-Positive and Amyloid-Negative Patients.

Vertical lines mark the Amyloid Probability Score cutoffs (35 and 58) for the amyloid-negative (Low APS) and amyloid-positive (High APS) categories based on Centiloid greater than 25.
Table 3. Amyloid PET Result Distribution by APS Category in the Combined Data Sets and in the Expected Population With 60% Prevalence.
| APS level | Combined data sets, No. (%) [95% CI] | Reweighted for 60% prevalence, % | ||
|---|---|---|---|---|
| Amyloid PET negativea | Amyloid PET positiveb | Amyloid PET negativea | Amyloid PET positiveb | |
| Low (0-35) | 199 (88.1) [83.1-92.0] | 27 (11.9) [8.0-16.9] | 86.3 | 13.7 |
| Intermediate (36-57) | 47 (49.5) [39.1-59.9] | 48 (50.5) [40.1-60.9] | 43.9 | 56.1 |
| High (58-100) | 62 (17.0) [13.3-21.2] | 303 (83.0) [78.8-86.7] | 14.1 | 85.9 |
Abbreviations: APS, Amyloid Probability Score; PET, positron emission tomography.
Amyloid PET negativity was defined as Centiloid value of 25 or less in PET scans.
Amyloid PET positivity was defined as Centiloid value of greater than 25 in PET scans.
APS diagnostic performance was consistent, regardless of whether the intermediate data points were excluded or counted as positive or negative (eTable 2 in the Supplement). Excluding intermediate data points resulted in APS performance with sensitivity of 92% (95% CI, 88%-95%) and a specificity of 77% (95% CI, 71%-71%). The overall accuracy of APS performance was reduced from 85% (95% CI, 82%-88%) to 80% (95% CI, 77%-83%) when intermediate data points were either counted as positive or negative, suggesting that the good diagnostic performance of the 2 APS cutoff values did not simply result from not assigning a positive or negative classification to patients with intermediate APS values. When subgroup analyses were performed, the diagnostic accuracy was comparable, as patients were stratified by cohort, sex, amyloid tracer, clinical disease stage, apoE E4 status, age, or race or ethnicity (eFigure 3 in the Supplement), further demonstrating that the 2-cutoff APS was robust and valid.
Discussion
In this cohort study, we developed and analytically validated MS-based assays that quantified the Aβ42:40 ratio and determined apoE proteotype from a single plasma sample.19 Previously, we reported that combining plasma Aβ42:40 ratio, apoE proteotype, and participant’s age was associated with accurately identifying brain amyloid status in a collection of heterogenous cohorts.18 The research prototype of this assay was recently shown to be the best among 8 plasma Aβ42:40 assays in detecting anomalous brain Aβ status in a head-to-head comparison in samples from the Swedish Biomarkers For Identifying Neurodegenerative Disorders Early and Reliably (BIOFINDER) study and the Alzheimer’s Disease Neuroimaging Initiative (ADNI).17 In this study, findings from 2 additional independent cohorts demonstrate that our analytically validated MS-based blood test was clinically valid for identifying the presence of brain amyloid plaque pathology compared with amyloid PET findings as reference standard.
Increasing evidence has shown that plasma Aβ42:40 ratio has utility in detecting brain amyloidosis. With the recent US Food and Drug Administration (FDA) approval of aducanumab, the first AD-modifying treatment to receive such approval, and others expected soon to follow, identification and proper diagnosis of patients eligible for treatment becomes critical for health care systems to deliver such treatments in a timely and effective manner. A 2021 study by Mattke and Hanson24 projected that under the current model of specialist referrals and diagnostic evaluation of patients with cognitive impairment and dementia, patients would have to wait a mean of 50 months to access newly available treatments. At the same time, the model estimated that when a blood-based biomarker test was used to triage patients before referral to specialists, that wait time could be shortened to 12 months.24
For the data presented in this study, amyloid PET was used as the reference standard for determination of brain amyloid status. While visual read is the basis of FDA approval for tracers and how eligibility in MissionAD was determined, multiple studies have shown that visual reads miss early stages of amyloid accumulation.21,25,26 The optimal Centiloid threshold to detect earliest amyloid accumulation has been reported as between 15 and 26 in various studies.21,27,28,29,30,31 Based on the literature, we prospectively chose a Centiloid value of 25 as the cutoff for brain amyloid PET positivity in our study.
The goal of the PARIS discovery cohort was to prospectively collect blood samples for the purpose of developing this blood test. The LRM and the optimal inputs into the LRM were initially developed on this cohort. As samples from MissionAD became available, the LRM was validated on those samples. Analysis showed that the odds ratios for the various inputs into the model were highly conserved between cohorts, and the 2 cohorts were combined to allow training of the LRM on a larger data set with better representation of the various apoE isoforms.
The output of the LRM (the APS) represented the likelihood that a patient would belong to either the amyloid positive or negative category. Patients with APS results in the range of 36 to 57 had an approximately 50% chance of amyloid positivity and were therefore assigned an intermediate interpretation. The small number of patients expected to fall into this intermediate range (approximately 14% based on results from our 686-patient study and tracking at approximately 15% based on clinical experience reported by Monane et al32) was not deemed to compromise the clinical usefulness of the APS result.
Limitations
This study has some limitations. The difference in Aβ42:40 ratio between patients with positive and negative PET findings is small, leading to a potential concern that assay drift may cause misclassification of patients based on the ratio. In our clinical use of this test, we continuously monitored the performance of quality control samples for the Aβ42:40 ratio and have seen less than 1% drift in longer than 18 months of experience and more than 6000 measurements.
Another limitation is the low representation from IDEAS and MissionAD of patients from racial or ethnic minority groups, including American Indian, Asian, African American, and Pacific Islander individuals. Underrepresentation of racial and ethnic minority groups has been a long-standing issue in clinical studies of AD, and we seek to address this through ongoing collaborations. The limited number of apoE E2 carriers in the current cohorts may have resulted in an underestimate of its weight in the final model. Large, ongoing cohort studies will elucidate the role of various clinicodemographic variables on blood biomarker estimation models for brain amyloidosis.
Conclusions
The findings of this cohort study demonstrated excellent clinical performance and clinical validity of this MS-based blood test for identifying brain amyloid pathology among individuals with MCI or mild dementia undergoing evaluation for AD. This blood test generated a clinical diagnostic score, the APS, that could aid physicians in the evaluation of their patients with memory changes. For example, a low APS indicates a low likelihood of brain amyloid plaques and is inconsistent with an AD diagnosis (ie, other causes of cognitive symptoms should be investigated that could lead to improved patient outcomes). A high APS indicates a high likelihood of brain amyloid plaques and is consistent with an AD diagnosis among patients with cognitive decline. Increased diagnostic accuracy has the potential to improve comprehensive care plans, expedite access to appropriate therapies, increase accessibility, and enhance patient-centered outcomes. As the science evolves, other blood biomarkers will be evaluated for their ability to further enhance the diagnostic performance of the APS to identify AD brain pathology among individuals with MCI and mild dementia.
eMethods.
eFigure 1. Effects of Inputs into Model
eFigure 2. NPV and PPV at Various APS Values as Calculated for a Population With 60% Prevalence of PET Amyloid Positivity
eFigure 3. Accuracy of APS in Subgroups of the Pooled Dataset
eFigure 4. Calibration of Model Developed on PARIS Discovery Cohort When Applied to MissionAD Cohort
eTable 1. Eligibility Criteria for PARIS Discovery and MissionAD
eTable 2. Diagnostic Performance of APS in the Pooled Dataset
eTable 3. Comparison of Odd Ratios for the Models Trained on PARIS Discovery, MissionAD, or the Combined Cohorts
References
- 1.2020 Alzheimer’s disease facts and figures. Alzheimers Dement. 2020;16(3):391-460. doi: 10.1002/alz.12068 [DOI] [Google Scholar]
- 2.Rajan KB, Weuve J, Barnes LL, McAninch EA, Wilson RS, Evans DA. Population estimate of people with clinical Alzheimer’s disease and mild cognitive impairment in the United States (2020-2060). Alzheimers Dement. 2021;17(12):1966-1975. doi: 10.1002/alz.12362 [DOI] [PMC free article] [PubMed] [Google Scholar]
- 3.Selkoe DJ. Alzheimer’s disease is a synaptic failure. Science. 2002;298(5594):789-791. doi: 10.1126/science.1074069 [DOI] [PubMed] [Google Scholar]
- 4.Morris JC. Clinical assessment of Alzheimer’s disease. Neurology. 1997;49(3)(suppl 3):S7-S10. doi: 10.1212/WNL.49.3_Suppl_3.S7 [DOI] [PubMed] [Google Scholar]
- 5.Hardy J, Selkoe DJ. The amyloid hypothesis of Alzheimer’s disease: progress and problems on the road to therapeutics. Science. 2002;297(5580):353-356. doi: 10.1126/science.1072994 [DOI] [PubMed] [Google Scholar]
- 6.Long JM, Holtzman DM. Alzheimer disease: an update on pathobiology and treatment strategies. Cell. 2019;179(2):312-339. doi: 10.1016/j.cell.2019.09.001 [DOI] [PMC free article] [PubMed] [Google Scholar]
- 7.Karran E, Mercken M, De Strooper B. The amyloid cascade hypothesis for Alzheimer’s disease: an appraisal for the development of therapeutics. Nat Rev Drug Discov. 2011;10(9):698-712. doi: 10.1038/nrd3505 [DOI] [PubMed] [Google Scholar]
- 8.Golde TE, Dickson D, Hutton M. Filling the gaps in the Aβ cascade hypothesis of Alzheimer’s disease. Curr Alzheimer Res. 2006;3(5):421-430. doi: 10.2174/156720506779025189 [DOI] [PubMed] [Google Scholar]
- 9.Tanzi RE, Bertram L. Twenty years of the Alzheimer’s disease amyloid hypothesis: a genetic perspective. Cell. 2005;120(4):545-555. doi: 10.1016/j.cell.2005.02.008 [DOI] [PubMed] [Google Scholar]
- 10.Musiek ES, Holtzman DM. Three dimensions of the amyloid hypothesis: time, space and ‘wingmen’. Nat Neurosci. 2015;18(6):800-806. doi: 10.1038/nn.4018 [DOI] [PMC free article] [PubMed] [Google Scholar]
- 11.Beach TG, Monsell SE, Phillips LE, Kukull W. Accuracy of the clinical diagnosis of Alzheimer disease at National Institute on Aging Alzheimer Disease Centers, 2005-2010. J Neuropathol Exp Neurol. 2012;71(4):266-273. doi: 10.1097/NEN.0b013e31824b211b [DOI] [PMC free article] [PubMed] [Google Scholar]
- 12.Khoury R, Ghossoub E. Diagnostic biomarkers of Alzheimer’s disease: a state-of-the-art review. Biomarkers Neuropsychiatry. 2019;1:100005. doi: 10.1016/j.bionps.2019.100005 [DOI] [Google Scholar]
- 13.Rabinovici GD, Gatsonis C, Apgar C, et al. Association of amyloid positron emission tomography with subsequent change in clinical management among Medicare beneficiaries with mild cognitive impairment or dementia. JAMA. 2019;321(13):1286-1294. doi: 10.1001/jama.2019.2000 [DOI] [PMC free article] [PubMed] [Google Scholar]
- 14.Schindler SE, Bollinger JG, Ovod V, et al. High-precision plasma β-amyloid 42/40 predicts current and future brain amyloidosis. Neurology. 2019;93(17):e1647-e1659. doi: 10.1212/WNL.0000000000008081 [DOI] [PMC free article] [PubMed] [Google Scholar]
- 15.Ovod V, Ramsey KN, Mawuenyega KG, et al. Amyloid β concentrations and stable isotope labeling kinetics of human plasma specific to central nervous system amyloidosis. Alzheimers Dement. 2017;13(8):841-849. doi: 10.1016/j.jalz.2017.06.2266 [DOI] [PMC free article] [PubMed] [Google Scholar]
- 16.Nakamura A, Kaneko N, Villemagne VL, et al. High performance plasma amyloid-β biomarkers for Alzheimer’s disease. Nature. 2018;554(7691):249-254. doi: 10.1038/nature25456 [DOI] [PubMed] [Google Scholar]
- 17.Janelidze S, Teunissen CE, Zetterberg H, et al. Head-to-head comparison of 8 plasma amyloid-β 42/40 assays in Alzheimer disease. JAMA Neurol. 2021;78(11):1375-1382. doi: 10.1001/jamaneurol.2021.3180 [DOI] [PMC free article] [PubMed] [Google Scholar]
- 18.West T, Kirmess KM, Meyer MR, et al. A blood-based diagnostic test incorporating plasma Aβ42/40 ratio, ApoE proteotype, and age accurately identifies brain amyloid status: findings from a multi cohort validity analysis. Mol Neurodegener. 2021;16(1):30. doi: 10.1186/s13024-021-00451-6 [DOI] [PMC free article] [PubMed] [Google Scholar]
- 19.Kirmess KM, Meyer MR, Holubasch MS, et al. The PrecivityAD test: accurate and reliable LC-MS/MS assays for quantifying plasma amyloid beta 40 and 42 and apolipoprotein E proteotype for the assessment of brain amyloidosis. Clin Chim Acta. 2021;519:267-275. doi: 10.1016/j.cca.2021.05.011 [DOI] [PMC free article] [PubMed] [Google Scholar]
- 20.Roberts C, Kaplow J, Giroux M, Krause S, Kanekiyo M. Amyloid and APOE status of screened subjects in the Elenbecestat MissionAD phase 3 program. J Prev Alzheimers Dis. 2021;8(2):218-223. doi: 10.14283/jpad.2021.4 [DOI] [PubMed] [Google Scholar]
- 21.La Joie R, Ayakta N, Seeley WW, et al. Multisite study of the relationships between antemortem [11C]PIB-PET Centiloid values and postmortem measures of Alzheimer’s disease neuropathology. Alzheimers Dement. 2019;15(2):205-216. doi: 10.1016/j.jalz.2018.09.001 [DOI] [PMC free article] [PubMed] [Google Scholar]
- 22.van der Kall LM, Truong T, Burnham SC, et al. Association of β-amyloid level, clinical progression, and longitudinal cognitive change in normal older individuals. Neurology. 2021;96(5):e662-e670. doi: 10.1212/WNL.0000000000011222 [DOI] [PMC free article] [PubMed] [Google Scholar]
- 23.Insel PS, Hansson O, Mattsson-Carlgren N. Association between apolipoprotein E ε2 vs ε4, age, and β-amyloid in adults without cognitive impairment. JAMA Neurol. 2021;78(2):229-235. doi: 10.1001/jamaneurol.2020.3780 [DOI] [PMC free article] [PubMed] [Google Scholar]
- 24.Mattke S, Hanson M. Expected wait times for access to a disease-modifying Alzheimer’s treatment in the United States. Alzheimers Dement. Published online September 27, 2021. doi: 10.1002/alz.12470 [DOI] [PubMed] [Google Scholar]
- 25.Whitwell JL, Xu J, Mandrekar JN, Gunter JL, Jack CR Jr, Josephs KA. Rates of brain atrophy and clinical decline over 6 and 12-month intervals in PSP: determining sample size for treatment trials. Parkinsonism Relat Disord. 2012;18(3):252-256. doi: 10.1016/j.parkreldis.2011.10.013 [DOI] [PMC free article] [PubMed] [Google Scholar]
- 26.Villeneuve S, Rabinovici GD, Cohn-Sheehy BI, et al. Existing Pittsburgh Compound-B positron emission tomography thresholds are too high: statistical and pathological evaluation. Brain. 2015;138(Pt 7):2020-2033. doi: 10.1093/brain/awv112 [DOI] [PMC free article] [PubMed] [Google Scholar]
- 27.Amadoru S, Doré V, McLean CA, et al. Comparison of amyloid PET measured in Centiloid units with neuropathological findings in Alzheimer’s disease. Alzheimers Res Ther. 2020;12(1):22. doi: 10.1186/s13195-020-00587-5 [DOI] [PMC free article] [PubMed] [Google Scholar]
- 28.Clark CM, Pontecorvo MJ, Beach TG, et al. ; AV-45-A16 Study Group . Cerebral PET with florbetapir compared with neuropathology at autopsy for detection of neuritic amyloid-β plaques: a prospective cohort study. Lancet Neurol. 2012;11(8):669-678. doi: 10.1016/S1474-4422(12)70142-4 [DOI] [PubMed] [Google Scholar]
- 29.Farrell ME, Jiang S, Schultz AP, et al. ; Alzheimer’s Disease Neuroimaging Initiative and the Harvard Aging Brain Study . Defining the lowest threshold for amyloid-PET to predict future cognitive decline and amyloid accumulation. Neurology. 2021;96(4):e619-e631. doi: 10.1212/WNL.0000000000011214 [DOI] [PMC free article] [PubMed] [Google Scholar]
- 30.Doré V, Bullich S, Rowe CC, et al. Comparison of 18F-florbetaben quantification results using the standard Centiloid, MR-based, and MR-less CapAIBL approaches: validation against histopathology. Alzheimers Dement. 2019;15(6):807-816. doi: 10.1016/j.jalz.2019.02.005 [DOI] [PubMed] [Google Scholar]
- 31.Navitsky M, Joshi AD, Kennedy I, et al. Standardization of amyloid quantitation with florbetapir standardized uptake value ratios to the Centiloid scale. Alzheimers Dement. 2018;14(12):1565-1571. doi: 10.1016/j.jalz.2018.06.1353 [DOI] [PubMed] [Google Scholar]
- 32.Monane M, Snider J, Drake J, et al. Early clinical utility data of a blood biomarker test in the evaluation of patients with cognitive impairment. Innov Aging. 2021;5(suppl 1):1009. doi: 10.1093/geroni/igab046.3585 [DOI] [Google Scholar]
Associated Data
This section collects any data citations, data availability statements, or supplementary materials included in this article.
Supplementary Materials
eMethods.
eFigure 1. Effects of Inputs into Model
eFigure 2. NPV and PPV at Various APS Values as Calculated for a Population With 60% Prevalence of PET Amyloid Positivity
eFigure 3. Accuracy of APS in Subgroups of the Pooled Dataset
eFigure 4. Calibration of Model Developed on PARIS Discovery Cohort When Applied to MissionAD Cohort
eTable 1. Eligibility Criteria for PARIS Discovery and MissionAD
eTable 2. Diagnostic Performance of APS in the Pooled Dataset
eTable 3. Comparison of Odd Ratios for the Models Trained on PARIS Discovery, MissionAD, or the Combined Cohorts