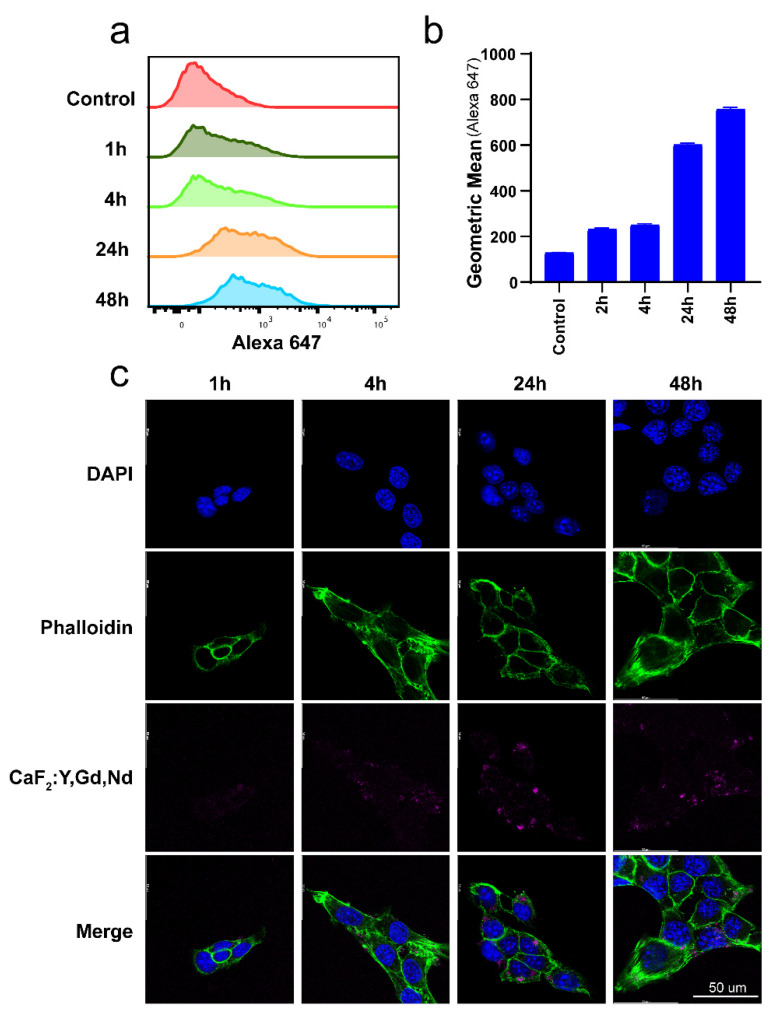
Figure 6.
Uptake of CaF2:Y,Gd,Nd NPs by 4T1 cells. (a) Representative flow cytometric plots and (b) flow cytometric analysis of CaF2:Y,Gd,Nd NPs uptake by 4T1 cells; (c) confocal microscope images of CaF2:Y,Gd,Nd NPs uptake after 1, 4, 24, and 48 h. Cell nuclei are stained blue (DAPI), actin cytoskeleton is green (Phalloidin), and CaF2:Y,Gd,Nd NPs are displayed in magenta. Scale bar = 50 µm.

