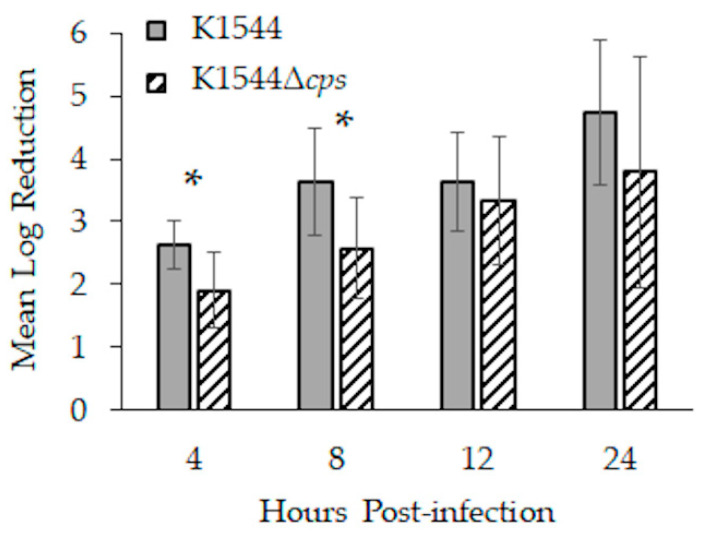
Figure 4.
Bacterial load reductions during the first 24 h of infection in mice. Corneas were infected with approximately 8 log10 CFU, and each data bar indicates by how many log10 CFU that starting inoculum decreased. Error bars represent standard deviation. Asterisks indicate a significant difference between parent and mutant.

