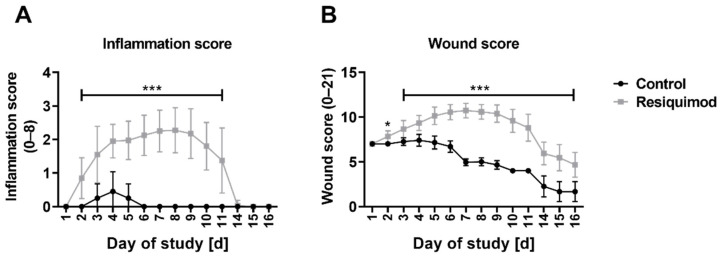
Figure 3.
Inflammation score and wound score over the course of the experiment. (A) The inflammation score showed a highly significant difference between control and resiquimod-induced wounds. (B) The overall wound score includes the area score as well as the inflammation score. Data are presented as mean (dot) ± standard deviation (whiskers) (n = 20 for control wounds; n = 40 for resiquimod-induced wounds). Data shown as mean ± SD. Statistical significance has been determined by 2-way ANOVA and corrected for multiple comparisons using the Sidak method. *** (p < 0.001).

