

Abstract
In this communication, we use density functional theory (DFT) to study the structural (geometry) and electronic properties (vertical detachment energy and electron affinity) of ZnO monomers and dimers that can be used to form ZnO clusters of different sizes, with a view to adapting one or more of them as catalysts or photocatalysts, standing alone or on suitable substrates like graphene, to split water. We also investigate different pairs of exchange functionals and basis sets to optimize their choice in our DFT calculations and to compare the singlet–triplet energy gaps of small ZnO clusters of different sizes to select an optimal cluster size for water splitting. We find that the B3LYP/DGDZVP2 exchange functional/basis set is a reliable combination for use with DFT to calculate the geometry and electronic properties of small ZnO nanoclusters from among several other combinations of exchange functionals and basis sets. Comparisons of the singlet–triplet energy gaps show that the trimer (ZnO)3 has an energy gap of 58.66 k cal/mol. which is approximately equal to the energy of a visible photon at a wavelength of 500 nm, and a HOMO–LUMO gap of 4.4 eV, making it a suitable choice of photocatalyst for the oxidation of water from among six (ZnO)n nanoclusters of monomers, with n ranging from 1 to 6. We used this exchange functional/basis set to study the structural and energetic details of hydration and hydrolysis of water absorbed on the (ZnO)3 nanocatalyst and calculated the corresponding potential energy profiles to identify three sets of singlet–triplet pathways for water splitting. Detailed study of a pathway showed that oxygen is produced after hydrogen, and the rate-determining step is the formation of hydrogen.
Introduction
Metal oxides have been used in chemistry, metallurgy, and engineering over many decades. Depending on the metal, the oxides can be utilized as catalysts,1,2 sensors,3,4 medical additives,5 and in solar cells.6,7 Scaling down from macro to nano, both the physical and chemical properties of each metal oxide are changed, and nanoscaled metal oxide clusters become a promising material to push the limits of their applications as catalysts.8−12 Accordingly, there has been a growing interest in the theoretical and experimental study of metal oxide nanoclusters.13−17 Zinc oxide (ZnO) is such a material with potential applications of interest in many industries including paint, cosmetics, and pharmaceuticals.18−27 Zinc oxide is a semiconductor with a wide band gap of 3.4 eV at 300 K and has unique magnetic, optical, and electronic properties.28−30 Moreover, those properties can change considerably when the particle dimension and size change to the nanoscale.
The structural and electronic properties of ZnO clusters have been studied experimentally and theoretically. Bovhyra et al. applied density functional theory (DFT) to investigate the structural and electronic properties of (ZnO)n (n = 34, 60) nanoclusters.31 Their investigations predicted that the most stable (ZnO)34 nanoclusters were fullerene-like hollow structures, and the most energetically favorable (ZnO)60 had a sodalite-type structure made with seven (ZnO)12 clusters and common quadrangle edges. The energy range of the highest occupied molecular orbital (HOMO) and the lowest unoccupied molecular orbital (LUMO) for those clusters is 1.93–2.40 eV. A study by Woodley et al. reported on the stable and low energy metastable structures of (ZnO)n clusters, when n = 1–32 using evolutionary algorithm techniques.32 They found 2D rings for n = 2–7 that were less than 0.8 nm in diameter and spheroidal bubbles up to n = 32 that were less than 1.2 nm in diameter.
Another theoretical study by Szakacs et al. showed the relative thermodynamic stability of two different ZnO nanocluster shapes, namely, needles and plates. The electronic structure calculations of ZnO needle and plate nanoclusters show the (ZnO)n, n = 6, 9, 12, 15, and 18 needles, have higher stability that increased with the number of stacked rings. They also studied Zn3O3 as a successful building block to form larger clusters rather than by the addition of individual or pairs of Zn and O atoms.33
An extensive theoretical study on the structural and electronic properties of (ZnO)n, n ≤ 168, was carried out by Chen et al.34 Their major findings include the presence of new magic numbers for (ZnO)n for structures at n = 78, 100, 132, and 168 with the particle stability increasing for structures with single to double and triple layered octahedral cage morphologies. Chen et al. summarized the stability of small ZnO clusters. The lowest energy isomers for (ZnO)n, n = 3–5, were predicted to be ring-like 2-dimensional (2D) structures that had higher stability compared to the open and 3D structures.
To fill the gap in information lacking in previous investigations of anionic ZnO clusters, Gunaratne et al. investigated the relative stabilities and electronic properties of small ZnO clusters using density functional theory (DFT) with both B3LYP and PBE exchange functionals and 6-311++G(3d), aug-cc-pvQZ and LanL2DZ basis sets.35 They compared their calculations with experimental results, reported the mass spectra of anionic ZnnOm (n = 1–6 and m = 1–7) clusters, and predicted the ground state geometries and stabilities of Zn3Om and Zn3Om– (m = 3–5). They also determined the adiabatic detachment energies (ADEs) and vertical detachment energies (VDEs) of the anions Zn3O3– and Zn3O4– using photoelectron spectroscopy, compared them with their theoretical results, and concluded that the (ZnO)3 cluster is more stable than its oxygen rich associates. Dheivamalar and Banu36 very recently reported on absorption mechanism and structural and electronic properties of pyrolle on (ZnO)3 and (ZnO)6 using DFT. They showed that pyrolle adsorption significantly changes the electronic properties of the clusters, and they concluded that Zn3O3 nanoclusters are more effective catalysts in solar cells than Zn6O6.
In this paper, we set the stage for our current and future investigations of selected ZnO nanoclusters as catalysts to split water. We first examined the structural and electronic properties of ZnO monomer and dimer, using 30 different pairs of exchange functionals and basis sets to choose an optimal pair in the theoretical analysis of the structural and electronic properties of ZnO nanoclusters using DFT. Where possible, we compared our results with CCSD(T) calculations using the same basis sets. We calculated the energies of singlet and triplet states of (ZnO)n nanoclusters for n = 1–6 and determined singlet triplet energy gaps with the same functionals and basis sets as a first step toward choosing an optimal cluster size of n = 3, as a potential catalyst to produce H2 and O2 gas by splitting water. ZnO is cheaper than TiO2, which is widely used as a photocatalyst to split water, but its relative efficiency is unknown. Theoretical calculations at the atomic and molecular level would help us understand the mechanism of water splitting and could lead to better choices and designs of catalysts for water splitting. For example, knowledge of the rate-determining step can be used to design catalysts with a lower activation energy for that step.
The production of H2 and O2 from the dissociation or splitting of water is an endothermic reaction that involves two water molecules.
| 1 |
The free energy of formation of H2O gas is −54.6 kcal/mol, and the heat of formation is −57.8 ± 0.02 kcal/mol at 298 K temperature, which is comparable to the energy of two photons at 500 nm.37 This is exploited in photocatalytic water splitting, which captures the energy of photons to split water.
| 2 |
When the photocatalyst is a semiconductor, with the minimal band gap to absorb photons, water splitting occurs indirectly through the photoexcitation of electrons (e–) from the valence band (VB) to the conduction band (CB) of the catalyst, leaving behind holes (h+) in the VB.
| 3 |
Charge separation is followed by recombination or transportation to the catalytic surface when water is oxidized by holes to form protons H+ and O2 molecules that are desorbed from the surface.
| 4 |
The protons H+ released are reduced by electrons to form H2 molecules that are also desorbed from the catalytic surface.
| 5 |
In this scenario, hydrogen molecules are formed after oxygen molecules, and the overall efficiency is determined by efficiencies of light harvesting, charge separations of holes and electrons, and the oxidation of water by holes to form oxygen and reduction of hydrogen ions by electrons to form hydrogen. They compete with the recombination of electrons and holes further reducing the efficiency of water splitting.38 Photochemical water splitting is consequently slower than electrochemical water splitting but has the advantage that it is less expensive and needs no energy other than sunlight.
Here, we used DFT to study the hydration and hydrolysis of two water molecules adsorbed successively on both the singlet and triplet states of (ZnO)3 nanoclusters that lead to the production of H2 and O2 during different stages of water splitting while remaining almost exclusively in these states. The triplet state in DFT is treated as an excited singlet state, and we excluded promotion of electrons from the ground state to excited states. We calculated the potential energy diagrams and elucidated the mechanism of water splitting, which, in this scenario, is not necessarily the same as in photocatalytic water splitting. To the best of our knowledge, detailed theoretical studies of water splitting using ZnO nanoclusters as catalysts have not been reported earlier. Kenmore and Biedermann reported DFT studies of water aggregation and splitting on the ZnO(1010) surface site.39 There are also accounts of experimental studies of the photocatalytic ability of ZnO nanoparticles.40 Previously, Fang and Dixon37 described extensive computational (DFT and CCSD(T)) studies of hydrogen and oxygen production from water splitting on small metal oxide clusters (MO2)n, where n = 1–3 and the metal M is Ti, Zr, or Hf. Nanocatalysts for water splitting have been reviewed recently by Grewe et al.41 and by Jaffari et al.42
Computational Method
We chose six different exchange functionals B3LYP, B3PW91, PBE, BVP86, BP86, and M06 exchange functionals and 30 different basis sets shown in Figure 1 in our DFT calculations of the structural and electronic properties of zinc oxide nanoclusters as potential catalysts.
Figure 1.

Basis sets considered in benchmark calculations using ZnO monomer and dimer.
We optimized the ZnO monomer and dimer structures and energies using DFT and the CCSD(T) theory with same basis sets. We also analyzed bond lengths, bond angles, and Mulliken charges on atoms that characterize the structural properties and the electron affinity (EA), vertical detachment energy (VDE), and energy representing the electronic properties of each optimized structure. Additionally we compared the HOMO–LUMO gap, the difference between singlet and triplet energies and calculated the infrared spectra of (ZnO)n clusters, with n = 1–6, to evaluate candidates with suitable photocatalytic properties. We compared our calculated values with experimental results35 to identify the best basis set candidates. We studied the densities of state (DOS), the HOMO and LUMO profiles of (ZnO)n, n = 1–6, and (ZnO)n when one water molecule absorbed on each cluster. The DOS plots were calculated using the GaussSum 3.0 Program.43 We also calculated the infrared (IR) spectra of each of the six (ZnO)n, n = 1–6 nanoclusters and the same (ZnO)n nanoclusters with one water molecule absorbed on each, compared them with previous work where possible, and verified the absence of negative frequencies, confirming their stability. All transition states of the reaction pathways were calculated using the Berny approach44 and further studied using the intrinsic reaction coordinates method45,46 using the selected basis set.
All geometry optimization as well as structural and electronic property calculations were carried out using the Gaussian 16 software package47 and GaussView 6 graphical interface.48
Results and Discussion
Comparison of Structural Properties
Geometry optimization is the process of finding the positions of nuclei for which the potential energy is minimized. We optimized the ZnO monomer and dimer and compared their structural properties using DFT and CCSD(T) methods with 30 different basis sets. Figure 2 illustrates the optimized monomer (a) and dimer (b) structures of ZnO using DFT with the B3LYP/DGDZVP2 combination of exchange functional and basis set. We selected the bond lengths (2Zn–1O for both monomer and dimer as shown in the Figure 2), dimer bond angles (2Zn–1O–3Zn and 1O–2Zn–4O), and Mulliken charges on each atom labeled in the Supporting Information (SI) Figures S1 and S2 as characteristic structural properties.
Figure 2.
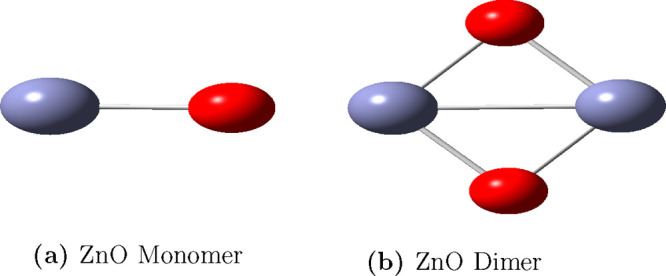
Optimized (a) monomer and (b) dimer structures at the B3LYP/DGDZVP2 level of theory. Zn and O atoms are represented by light blue and red colors, respectively.The — line represents a metal–metal bond between zinc atoms.
The monomer and dimer bond lengths, calculated for 30 different basis sets and 6 different exchange functionals in DFT and the corresponding results from CCSD(T) theory using the same basis sets, are shown in Figures 3 and 4 with the details numbers recorded in Tables S17 and S18, respectively. Other results including the optimized energies of the neutral and anion monomer and dimer are tabulated in the SI.
Figure 3.
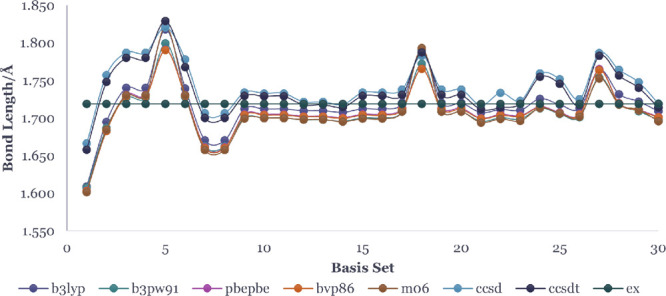
Bond length of zinc oxide monomer in Å optimized using different basis sets and functionals. The horizontal line with black dots is the experimental value 1.719 Å.35
Figure 4.
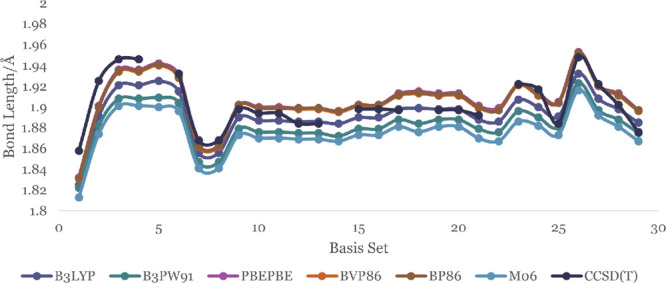
Zn–O bond length of zinc oxide dimer in Å optimized using different basis sets and functionals.
We compared the Zn–O bond lengths of the monomer and dimer with experimental values (the bond length of Zn–O is 1.719 and 1.787 Å for its anion).35 The bond lengths for the monomer, calculated using B3LYP functional in DFT, vary widely from 1.609–1.818 Å. However, the 6-311+G(d), 6-311++G(d), 6-311++G(d,p), and DGDZVP2 basis sets predict bond lengths in good agreement with the experimental value of 1.719 Å to within ±0.01 Å. Monomer bond lengths calculated with the B3LYP functional are comparably closer to experiment and to within the first decimal using the CCSD(T) method. The Zn–O bond lengths in the dimer are longer than the corresponding bond length in the monomer by about 0.13 Å in both the DFT and CCSD(T) theory. The metal–metal (Zn–Zn) bond distance in the dimer, optimized at the B3LYP/DGDZVP2 level, is 2.373 Å.
We next examined the bond angles, 2Zn–1O–3Zn and 1O–2Zn–4O, obtained from DFT using the B3LYP functional and the 30 different basis sets. They are displayed in Table S16 of the SI. The 2Zn–1O–3Zn angles range between 73.17° and 79.59°, while the 1O–2Zn–4O angles are larger and between 100.06° and 106.86°. Overall they are in excellent agreement with CCSD theory calculations to within 0.6° for the same basis sets as displayed in Figure 1.
A theoretical study by Ugalde et.al on the global minimum for small ZnO clusters concludes that the 1O–2Zn–4O bond angle is 103.7°, and the Zn–O bond length is 1.892 Å for the ZnO dimer using DFT with the B3LYP functional and a relativistic compact effective core potential and the shared-exponent basis set of Stevens, Krauss, Basch, and Jasien (SKBJ).49 Their theoretical calculations are in fair agreement with our DFT results (102.70°and 1.900 Å) using the same exchange functional and the DGDZVP2 basis set. Our CCSD(T) calculation with the same basis set predicts 103.3°for the dimer bond angle and 1.917 Å for the bond length. These differences are small and may reflect corresponding deficiencies in our choice of unmixed basis sets and exchange functional. In the remainder of this paper, we used B3LYP/DGDZVP2 exchange functional and basis set.
Comparison of Electronic Properties
Focusing on the electronic properties of the ZnO nanoclusters, we compared the experimental50,51 electron affinities (EAs) and vertical detachment energies (VDEs) of both ZnO monomer and dimer with our DFT and CCSD(T) calculations for the same basis sets. The EAs and VDEs were calculated from the optimized energies using eqs 6 and 7.52
| 6 |
| 7 |
The EA of a molecule is the difference in energy between the neutral molecule and the negative ion of the same molecule in their ground states. Positive EA values indicate thermodynamically stable negative ions. Our results are shown in Figure 5 with the details in Table S19 of the SI. All EA values for the monomer in the Figure 5 are positive except for the CCSD(T) calculations with the 6-311G(d,p) and aug-cc-PVDZ basis sets. The positive EA values for the ZnO monomer are in the range 0.567–2.538 eV. An experimental photoelectron spectra study of ZnO and ZnO– by Fancher et al. and Kim et al. finds that the EA of the ZnO monomer is 2.088 ± 0.010 eV.50,51 Our results in Table S19, show that the CCSD(T) theory with the 6-31+G, 6-31++G, 6-31+G(3df,2p), and aug-cc-PVTZ basis sets predict EA that agree to within 0.06 eV of the experimental value. Our DFT calculations using the B3LYP functional and DGDZVP2 or CEP-121G basis sets are also within the same error with respect to the experiment. The B3PW91 functional with the LANL2DZ basis set, the PBE functional with the cc-PVQZ and aug-cc-PVDZ basis sets, and the M06 functional with the cc-PVQC basis sets are also in accord with the experimental results to within the same error. The EA values of the ZnO dimer shown in Figure 6 and Table S20 are positive (with two exceptions) and are in the range 0.27–2.43 eV.
Figure 5.
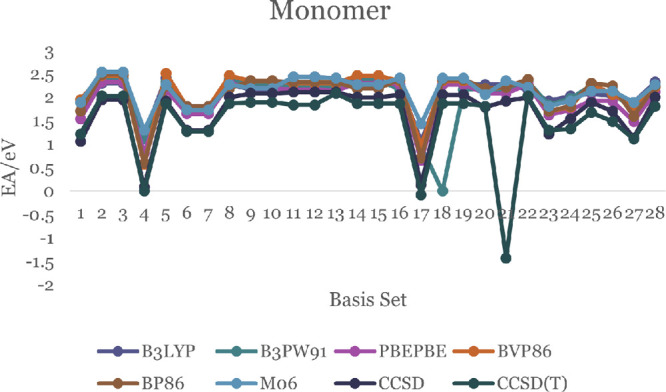
EA of the ZnO monomer.
Figure 6.
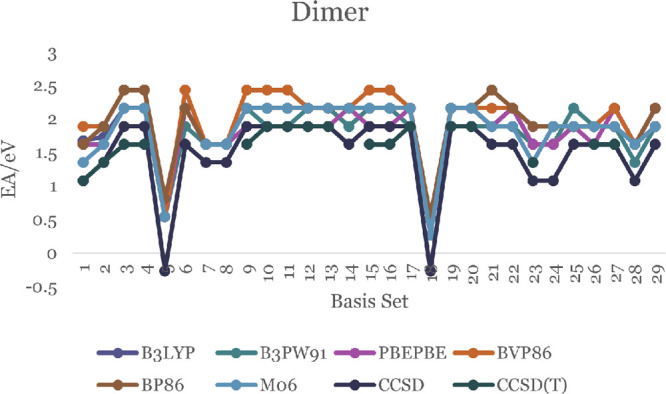
EA of the ZnO dimer.
The minimum energy needed to eject an electron from the negative ion of a molecule in its ground state, without changing the internuclear distances, is defined as the vertical displacement energy (VDE). The literature value of VDE for the ZnO monomer is 2.03 eV.50,51Figures 7 and 8 display the calculated DFT values of VDE for both ZnO monomer and dimer, respectively. For the monomer, they are between 0.27 and 7.29 eV. Most of them are close to 2.00 eV, including the B3LYP/DGDZVP2 level of theory (which is 2.16 eV). The details are in Tables S21 and S22. The DFT values of VDE for dimer are in the range 0.27–2.43 eV. Only the CCDS(T)/6-311G(d,p) theory shows a negative VDE (−0.27 eV, displayed in Table S22).
Figure 7.
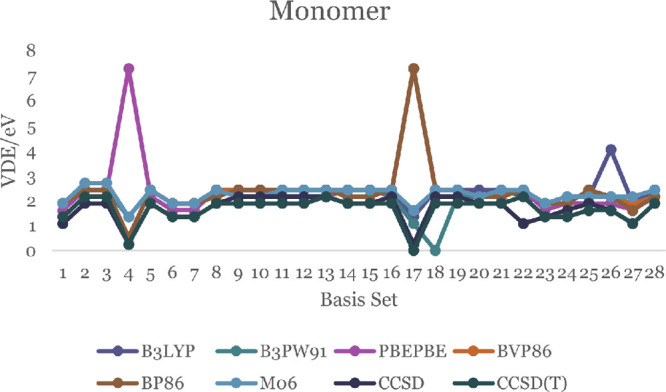
VDE of the ZnO monomer.
Figure 8.
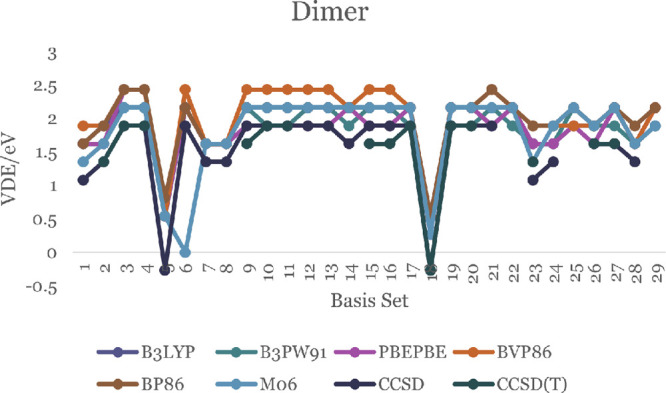
VDE of the ZnO dimer
We next investigated the choice of a suitable ZnO cluster size as a catalyst for water splitting. We chose six different sizes of ZnO nanoclusters, (ZnO)n, n = 1–6, whose equilibrium structures obtained using DFT and the exchange functional/basis set (B3LYP/DGDZVP2) are displayed in Figure 9. The Zn–Zn bonds in the ring structures n > 2 are omitted for clarity.
Figure 9.
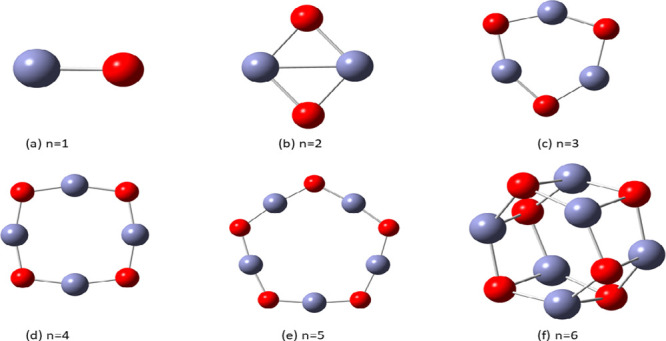
Optimized (ZnO)n, n = 1–6, nanostructures at the B3LYP/DGDZVP2 level of DFT. Zn and O atoms are represented by light blue and red colors, respectively. Bonds between zinc atoms for n > 2 are omitted for clarity.
We identified a suitable catalyst to assist in H2 and O2 production by splitting water. The catalyst should be able to act alone in the absence of light and as a photocatalyst in the presence of light.
The role of a photocatalyst is to absorb the energy of visible light and elevate the ground state electrons of a molecule to an excited state that enables the reaction to occur faster through a lowering of the activation barrier. Studying the excited state of the desired reaction is thus important. But, excited open shell singlet states are difficult or nearly impossible to investigate using current DFT methods. Since the energy difference between the excited singlet state and the triplet state is comparatively small, we considered the triplet state as an excited singlet state with spin one.
The optimized energies of the singlet and the first excited triplet state of (ZnO)n, n = 1–6, were calculated using the selected methods. The details are shown in the SI (Tables S11 and S12). The energy differences of the singlet and the first excited triplet state in kcal/mol are displayed in Table 1.
Table 1. Singlet–Triplet Energy Differences in kcal/mol for Different Cluster Sizes Calculated Using DFT with B3LYP Exchange Functional and Several Basis Sets.
| basis set | cluster
size (n) |
||||||
|---|---|---|---|---|---|---|---|
| 1 | 2 | 3 | 4 | 5 | 6 | ||
| 1 | 3-21G | +9.78 | 7.17 | 55.34 | 71.95 | 76.64 | 58.15 |
| 2 | 6-31+G | –3.73 | 13.14 | 52.82 | 63.63 | 68.71 | 54.67 |
| 3 | 6-31++G | –3.73 | 13.14 | 52.82 | 63.63 | 68.71 | 54.80 |
| 4 | 6-311G | –14.36 | 6.01 | 53.50 | 54.75 | 62.44 | 53.13 |
| 5 | 6-311++G | –3.87 | 13.65 | 53.02 | 63.90 | 69.05 | 54.98 |
| 6 | 6-31G(d) | +2.12 | 17.70 | 59.70 | 69.41 | 77.65 | 61.57 |
| 7 | 6-31+G(d) | +36.29 | 17.02 | 34.36 | 69.09 | 74.56 | 59.23 |
| 8 | 6-31+G(2d) | +36.35 | 18.34 | 58.44 | 69.59 | 74.70 | 58.96 |
| 9 | 6-31+G(2d,p) | +36.35 | 18.34 | 58.44 | 69.59 | 74.70 | 58.96 |
| 10 | 6-31+G(2df,p) | +36.09 | 18.08 | 58.27 | 69.46 | 74.59 | 58.88 |
| 11 | 6-31+G(2df,2p) | +36.09 | 18.08 | 58.27 | 69.46 | 74.59 | 58.88 |
| 12 | 6-31+G(3df,2p) | +36.11 | 18.68 | 58.95 | 69.83 | 75.18 | 59.61 |
| 13 | 6-31++G(d) | +36.29 | 17.02 | 57.55 | 69.09 | 74.56 | 59.23 |
| 14 | 6-31++G(d,p) | +36.29 | 17.02 | 57.55 | 69.09 | 74.56 | 59.23 |
| 15 | Aug-ccPVDZ | +35.21 | 18.55 | 58.52 | 69.73 | 74.84 | 58.90 |
| 16 | Aug-ccPVTZ | +34.90 | 18.26 | 58.26 | 69.67 | 74.87 | 58.98 |
| 17 | DGDZVP | +34.49 | 14.74 | 57.33 | 69.45 | 74.77 | 58.77 |
| 18 | DGDZVP2 | +34.85 | 16.05 | 58.66 | 73.22 | 76.39 | 59.93 |
| 19 | Def2TZVP | +34.30 | 16.48 | 57.65 | 69.17 | 74.48 | 58.32 |
| 20 | TZVP | +33.48 | 15.29 | 56.12 | 67.04 | 72.00 | 57.47 |
On examining the calculated energy differences between the singlet and triplet states of small (ZnO)n clusters, we observed that they are smaller than 57.8 kcal/mol when n = 1 and 2 and greater than 57.8 kcal/mol for n = 4 and 5. Clusters with n = 3 and 6 have energy gaps closer to the energy of two visible photons that can photocatalyze the splitting of two water molecules to produce H2 and O2. These results should be useful in designing further improvements to the performance of catalysts using appropriate substrates like graphene and graphene oxide. We chose the n = 3 as the preferred cluster size for a ZnO nanocatalyst with the desired properties that match the band gap, while taking into account the lower computational costs of using smaller clusters of ZnO monomers as catalysts.
The energy gap between HOMO and LUMO is an important parameter that identifies cluster stability and possible use as a photocatalyst. We calculated the energy gap (Eg) from eq 8 and DFT, where the EHOMO is the energy of the HOMO and ELUMO is the energy of LUMO. We compared the HOMO–LUMO gap of the six ZnO nanoclusters in Table 2 using the B3LYP functional and the four 6-311++G, DGDZVP, DGDZVP2, and aug-cc-PVDZ basis sets. Our results for the HOMO–LUMO gap of desired ZnO clusters using the B3LYP/DGDZVP2 combination of exchange functional and basis set in DFT are shown in Figure 10, and other relevant data are in the SI.
| 8 |
Table 2. HOMO–LUMO Gap in eV.
| basis
set |
||||
|---|---|---|---|---|
| cluster size | 6-311++G | DGDZVP | DGDZVP2 | aug-cc-PVDZ |
| 1 | 2.29 | 2.33 | 2.35 | 2.36 |
| 2 | 2.52 | 2.58 | 2.63 | 2.69 |
| 3 | 4.17 | 4.36 | 4.42 | 4.35 |
| 4 | 4.39 | 4.59 | 4.66 | 4.56 |
| 5 | 4.56 | 4.72 | 4.79 | 4.69 |
| 6 | 3.52 | 3.71 | 3.76 | 3.68 |
Figure 10.

HOMO–LUMO gap of (ZnO)n, n = 1–6 from DFT calculations at the B3LYP/DGDZVP2 level. Images use the coarse grid method and isoval = 0.02.
Cluster sizes 4 and 5 have relatively higher HOMO–LUMO gaps (4.66 and 4.79 eV, respectively using the B3LYP/DGDZVP2 method) indicating that they may be relatively less efficient than the other neutral clusters. (ZnO)3 and (ZnO)6 have lower HOMO–LUMO energy gaps (4.42 and 3.76 eV using the same method) compared to the fourth and fifth clusters, possibly indicating that the n = 3 and 6 (ZnO)n clusters may have a comparably higher reactivity. When considering the photocatalytic water splitting reaction to produce H2, the minimum photon energy required for the overall reaction is 1.23 eV, which indicates that all the small ZnO nanoclusters studied are possible candidates to catalyze the photosplitting of water from DFT using the B3LYP exchange functional and four different basis sets.
The differences between the DFT results for the same nanocluster and four different basis sets using DFT are small. However, the absolute values could be in error, since DFT is known to underestimate the band gap.
Figure 11 shows the DOS plot along with the HOMO, LUMO profile of (ZnO)3 cluster using the B3LYP/DGDZVP2 level of DFT. The corresponding plots for the other (ZnO)n=1,2,4–6 clusters are displayed in Figures S4–S8 in the SI. The DOS show the HOMO and LUMO energies as −7.41 and −2.98 eV, respectively, and energy gap calculated using eq 3 between HOMO and LUMO is 4.42 eV. This yields a Fermi level of −5.19 eV from the mean of the sum. Comparing the HOMO and LUMO profiles in the Figure 11, we see that the donor HOMO orbitals are distributed mostly on O atoms rather than on Zn atoms but the acceptor LUMO orbitals are dispersed over all the atoms of the cluster.
Figure 11.
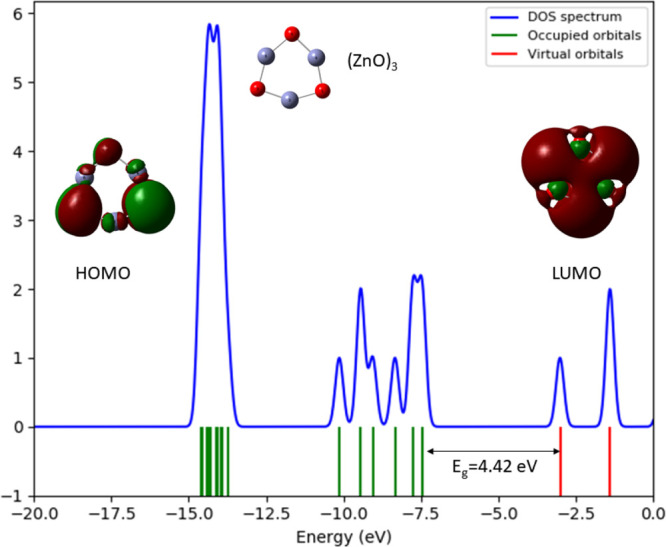
Density of states (DOS) plot and the HOMO, LUMO profile of (ZnO)3, using the B3LYP/DGDZVP2 level of DFT
H2O Adsorption on the (ZnO)3 Cluster
The charges on the atoms of nanocluster and water molecule steer the water molecule to the Zn adsorption site on the nanocluster to form a bond. To help clarify the steps, we used DFT at the B3LYP/DGDZVP2 level to calculate the Mulliken charges on each atom of an isolated water molecule and the atoms of the (ZnO)3 trimer before and after the adsorption of a water molecule. The charges are displayed in Table 3 and show why the postively charged zinc atom is the preferred adsorption site for the negatively charged oxygen atom of water. The atomic charge distribution also plays an important role in explaining not only bond formation but also bond breaking in the hydration and hydrolysis of a water molecule, leading eventually to water splitting. In the (ZnO)3 cluster, all the Zn atoms have a positive charges value of 0.757 and the O atoms have a negative charge of 0.757. The O atom in an isolated water molecule has −0.607 charge and each H atom in the water molecule has a positive 0.304 charge. When a water molecule is absorbed on the (ZnO)3 cluster, charge transfer occurs from the donor O atom (8O) of the water molecule to the acceptor Zn atom (4Zn) of the nanocluster, lowering their magnitudes as a new bond is formed. This is accompanied by a redistribution of charges on the other atoms. Other methods of calculating the atomic charge are unlikely to change the general picture.
Table 3. Mulliken Charges of Zn3O3, Water, and Zn3O3 Hydrated with One Water Molecule.
| atom | Zn3O3 | H2O | Zn3O3 + H2O |
|---|---|---|---|
| 1Zn | +0.757 | +0.779 | |
| 3Zn | +0.757 | +0.750 | |
| 4Zn | +0.757 | +0.738 | |
| 2O | –0.757 | –0.764 | |
| 5O | –0.757 | –0.886 | |
| 6O | –0.757 | –0.778 | |
| 8H | +0.304 | +0.324 | |
| 9H | +0.304 | +0.370 | |
| 8O | –0.607 | –0.533 |
Figure 12 shows the DOS plot and the HOMO, LUMO profile of (ZnO)3 with H2O, using the B3LYP/DGDZVP2 level of theory. The DOS shows the HOMO and LUMO energies as −6.97 and −2.32 eV, respectively, and energy gap calculated using eq 3 between HOMO and LUMO is 4.42 eV This yields the Fermi level as −4.64 eV. When we introduce a water molecule to the (ZnO)3 cluster, it tends to make bonds with Zn and O atoms in the cluster (as shown in Figure 4). The HOMO–LUMO gap increased when the water molecule absorbed on (ZnO)3 cluster from 4.42 to 4.65 eV. We also calculated the vibrational frequencies in order to check the stability of the optimized geometries. Infrared spectra for (ZnO)n, n = 1–3 and (ZnO)3, when one water molecule absorbed on it are shown in Figure 13. The IR spectra for (ZnO)4, (ZnO)5, (ZnO)6, and all the relevant frequencies for the monomer and the anion of the monomer are shown in Figures S7 and S8 in tables in the SI.
Figure 12.
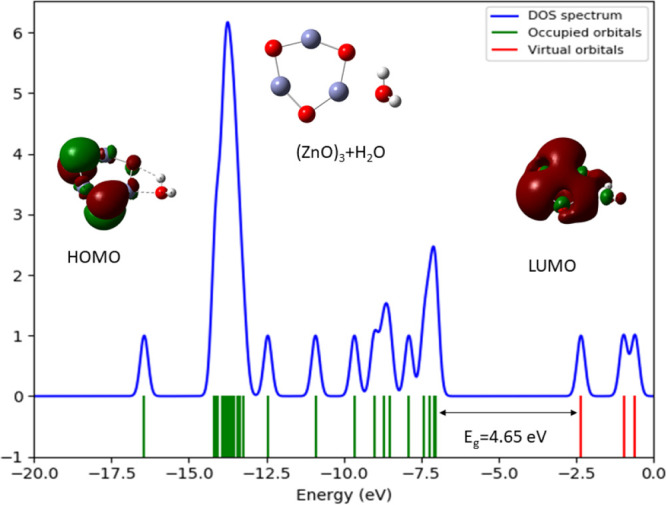
Density of states (DOS) plot and the HOMO, LUMO profile of (ZnO)3 using the B3LYP/DGDZVP2 level of theory.
Figure 13.

IR figures for (a) ZnO, (b) (ZnO)2, (c) (ZnO)3, (d) (ZnO)4, (e) (ZnO)5, (f) (ZnO)6, (g) H2O, and (h) H2O absorbed on Zn3O3 using B3LYP/DGDZVP2.
There were no imaginary vibration frequencies in our study of any of the clusters. The monomer ZnO has one wide peak at 708 cm–1. The dimer ZnO has three major peaks at 213, 441, and 566 cm–1 frequencies. (ZnO)3 has a major peak at 648 cm–1 and a minor peak at 221 cm–1, (ZnO)4 has a major peak at 735 cm–1 and two minor peaks at 176 and 225 cm–1, (ZnO)5 has one major peak at 801 cm–1 and three minor peaks at 174, 221, and 518 cm–1, and (ZnO)6 has two major peaks at 385 and 581 cm–1 and a minor peak at 491 cm–1 frequencies. When the water molecule absorbed on (ZnO)3, the IR peaks shifted toward higher frequency values.
The optimized energies of the singlet and the first excited triplet state of (ZnO)n, n = 1–6, are calculated using the selected methods. The details are shown in the SI. The energy differences of the singlet and the first excited triplet state are displayed in Table 1, and the detailed energies are in Tables S11 and S12.
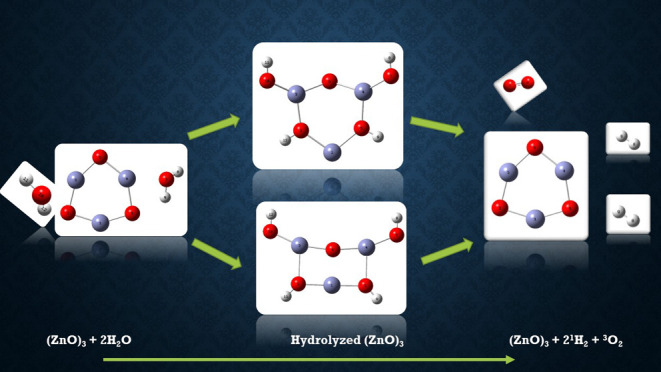
Hydration and Hydrolysis Reaction Pathways of (ZnO)3
First Hydrolysis
The hydrolysis of a water molecule on the (ZnO)3 catalyst
| 9 |
occurs in two stages. In the first stage, a water molecule is adsorbed with its oxygen bonded to any one of three zinc atoms of the (ZnO)3 nanocatalyst followed by the molecule tipping over to enable proton transfer of a H atom of the same water molecule to an oxygen atom adjacent to the zinc atom already bonded to the water molecule. Dissociation of the absorbed water molecule leaves a hydrogen atom and a OH group bonded to adjacent O and Zn (sites 4 and 5) on the ring of the (ZnO)3 cluster. The pathways for adsorption, hydration, and hydrolysis are similar in the singlet and triplet states of the catalyst, but the intermediate and final products though topologically similar have different structures as displayed in Figure 14.
Figure 14.

Reaction pathway for the adsorption and hydrolysis of water in the singlet and triplet states of (ZnO)3, using the B3LYP/DGDZVP2 level of theory.
The bond lengths of Zn–OH are 1.815 and 1.809 Å in the respective singlet and triplet states, and the corresponding O–H bond lengths are 0.996 and 0.965 Å, respectively. In both cases, the bond lengths are reduced by excitation from singlet to triplet.
Second Hydrolysis
There are two vacant Zn sites (a and b) at which a second water molecule can be absorbed on the already hydrated (ZnO)3 nanocluster. Site a has only one vacant ring oxygen next to it that can accept a H atom from the dissociation of the second water molecule, while site b has two. We characterized the two pathways for hydration and hydrolysis from site b as b1 and b2 and the hydration and hydrolysis from Zn site a as pathway a. Overall, there are six pathways (three sets of singlet and triplet pathways) for the hydrolysis of a second water molecule.
| 10 |
The six pathways are displayed in Figures 15–17.
Figure 15.

Reaction pathway a for the adsorption of second water molecule on (ZnO)3, using the B3LYP/DGDZVP2 level of theory.
Figure 17.

Reaction pathway b2 for the adsorption of second water molecule on (ZnO)3, using the B3LYP/DGDZVP2 level of theory.
Figure 16.

Reaction pathway b1 for the adsorption of second water molecule on (ZnO)3, using the B3LYP/DGDZVP2 level of theory.
The hydrolysis products along pathways a, b1, and b2 have two Zn–O–H and two O–H groups on the nanocluster ring.The products along pathways a and b2 are identical, with two pairs of alternating Zn–O–H and O–H groups. In contrast to this, pathway b1 has a ring O between a pair of Zn–O–H groups and a Zn atom between the pair of O–H groups. We next examined the potential energy surfaces for the adsorption and hydrolysis of water along the three pathways. They are shown in Figures 18–20, and the relative energies of adsorption, activation, and hydrolysis at 298 K are summarized in Table 4.
Figure 18.

Potential energy surface (PES) of the hydration and hydrolysis (ZnO)3, by two water molecules along path a using the B3LYP/DGDZVP2 level of theory. Relative energies are in kcal/mol.
Figure 20.

Potential energy surface (PES) of the hydration and hydrolysis (ZnO)3, by two water molecules along path b2 using the B3LYP/DGDZVP2 level of theory. Relative energies are in kcal/mol.
Table 4. Relative Energies for Adsorption, Activation, and Hydrolysis (kcal/mol) of Two Water Molecules along Three Sets of Pathways (Figures 18–20)a.
| Zn3O3 | Zn3O3.H2O | TS | Zn3O2(OH)2 | Zn3O2(OH)2·H2O | TS | Zn3O(OH)4 | |
|---|---|---|---|---|---|---|---|
| pathway a | a | 1b | 1c | 1d | 1e1 | 1f1 | 1g1 |
| E | 57.5(T) | 40.8 | 42.3 | 11.3 | –3.2 | 0.8 | –14.9 |
| 0.0(S) | –16.9 | –15.9 | –31.3 | –48.9 | –46.9 | –78.3 | |
| E(abs,act) | –16.7(T) | 1.5 | –14.5 | 4.0 | |||
| –16.9(S) | 1.0 | –17.6 | 2.1 | ||||
| pathway b1 | a | 1b | 1c | 1d | 1e2 | 1f2 | 1g2 |
| E | 57.5 | 40.8 | 42.3 | 11.3 | –7.3 | 0.8 | –14.7 |
| 0.0 | –16.9 | –15.9 | –31.3 | –46.6 | –46.8 | –79.9 | |
| E(abs,act) | –16.7 | 1.5 | –18.6 | 4.7 | |||
| –16.9 | 1.0 | –15.3 | 1.7 | ||||
| pathway b2 | a | 1b | 1c | 1d | 1e3 | 1f3 | 1g3 |
| E | 57.5 | 40.8 | 42.3 | 11.3 | –7 | 0.3 0.8 | –14.7 |
| 0.0 | –16.9 | –15.9 | –31.3 | –48.9 | –46.3 | –78.3 | |
| E(abs,act) | –16.7 | 1.5 | –14.5 | 4.0 | |||
| –16.9 | 1.0 | –17.6 | 2.1 |
The temperature is 298 K.
Figure 19.

Potential energy surface (PES) of the hydration and hydrolysis (ZnO)3, by two water molecules along path b1 using the B3LYP/DGDZVP2 level of theory. Relative energies are in kcal/mol.
The adsorption of water is exothermic by about 15–19 kcal/mol, and the activation energy for the hydrolysis of the first water molecule is about 1.0–2.0 and about 2.0–4.0 kcal/mol for the hydrolysis of the second water molecule. Hydrolysis of two water molecules occurs readily on the catalytic surface in the singlet and triplet states in the absence of light. It is not a rate-determining step in the splitting of water
Following our study of the hydrolysis of two water molecules on the (ZnO)3 nanocatalyst, we turn our attention to further details of the mechanism of water splitting to produce H2 and O2 formation and release. Since pathways a and b2 lead to the same hydrolyzed products, we need to consider only the twos sets a and b1 pathways beyond this point to understand the mechanism of formation of H2 and O2 during water splitting.
Light is not explicitly considered in our calculations of the pathways to split water using a (ZnO)3 nanocatalyst, but in the presence of light of appropriate wavelength, one or more photons corresponding to wavelengths of 500 nm can, in principle, promote transitions from the single to triplet states of the nanocatalyst at the beginning or at any other stage of the reaction depending on the energy gap between the states.
We calculated the potential energy surfaces for the formation and release of H2 molecules and O2 molecule along pathway b1 after the hydrolysis of two water molecules on the surface of ZnO nanoclusters. The activated and intermediate states as well as the reaction pathways were determined using intrinsic reaction coordinate (IRC) methods.45,46Figure 21 shows the potential energy surface for formation and release of the first H2 molecule along this pathway during water splitting, and the corresponding relative energies are recorded in Table 5.
Figure 21.

Potential energy surface (PES) for the formation and desorption of a H2 molecule from two water molecules hydrolyzed on a (ZnO)3 nanocatalyst along pathway b1. Relative energies in kcal/mol calculated using DFT and the B3LYP/DGDZVP2 level.
Table 5. Relative Energies in kcal/mol of the Formation and Release of the First Hydrogen Molecule during Water Splitting Shown in Figure 21a.
| Zn3O(OH)4 | TS | HZn3O2(OH)3 | TS | Zn3O3(OH)2·H2 | Zn3O3(OH)2 | TS | |
|---|---|---|---|---|---|---|---|
| g2 | h2 | i2 | j2 | k2 | l2 | m2 | |
| E | –14.7(T) | 68.1 | 38.7 | 93.8 | 63.5 | 62.9 | 64.6 |
| –79.9(S) | 40.9 | –3.9 | 45.6 | 31.9 | 33.2 | 34.7 | |
| Eact | 82.8(T) | 55.1 | –0.6 | 1.7 | |||
| 120.8(S) | 49.9 | 1.3 | 1.5 |
The temperature is 298 K.
The formation of the first hydrogen molecule from the hydrolyzed product of pathway b1 requires prior rearrangement of the hydrolyzed ring to bring a ring oxygen close to the oxygen of Zn–O–H group, followed by Zn–H and O–O bonds formed within the cluster after surmounting two barriers with high activation energies of 120.8 and 49.9 kcl/mol, which brings the hydrogen atoms on the −O–H group close to another H atom bonded to a ring oxygen. This is a favorable arrangement that enables bond formation between hydrogen atoms to produce a hydrogen molecule. Formation of the first hydrogen molecule is clearly a rate-determining step for water splitting.
Figure 22 displays the potential energy surface for the release of a second hydrogen molecule ion followed by the formation and desorption of an oxygen molecule in the triplet state to complete the splitting of two water molecules and the regeneration of the (ZnO)3 nanocatalyst in its original state. The barrier for the formation of the second hydrogen molecule is lower than for the first hydrogen molecule, but it is still high in contrast to the relatively low barrier for oxygen formation, which follows the release of hydrogen. The energetic details are recorded in Table 6. The last steps involve two curve crossings, which may require mixed states for a more accurate representation. In the final steps, the oxygen molecule released is in its most stable triplet state and the hydrogen molecules are in their singlet states. The overall catalyzed reaction to split water using a (ZnO)3 nanocatalyst is
| 11 |
Figure 22.

Potential energy surface (PES)for the formation and desorption of the second H2 molecule followed by an oxygen molecule in the presence of (ZnO)3 nanocatalyst along pathway 1b using DFT and the B3LYP/DGDZVP2 level of theory. Relative energies are in kcal/mol.
Table 6. Relative Energies in kcal/mol for Activation, Formation, and Liberation of the Second Hydrogen Molecule Followed by the First Oxygen Molecule during Water Splitting (Figure 22).
| Zn3O3(OH)2 | TS | HZn3O4(OH) | TS | Zn3O5·H2 | Zn3O5 | TS | Zn3O3·O2 | Zn3O3 | |
|---|---|---|---|---|---|---|---|---|---|
| n2 | o2 | p2 | q2 | r2 | s2 | t2 | u 2 | v2 | |
| E | 64.1(T) | 107.8 | 79.9 | 142.5 | 130.7 | 134.8 | 134.6 | 103.2 | 164.3 |
| 34.3(S) | 141.7 | 89.9 | 136.1 | 116.1 | 116.8 | 136.7 | 136.1 | 106.8 | |
| Eact,reorg | 43.7(T) | 62.6 | 4.1 | –0.2 |
Table 6 and Figure 22 show that the energy change for the splitting of water represented in eq 11 is 106.8 kcal/mol. The literature value of the enthalpy change is 115.6 kcal/mol at 298 K.
Conclusion
We investigated the structural and electronic properties of ZnO monomer and dimer and the vibrational frequencies of both to choose suitable basis sets and exchange functionals to study the catalytic effects of ZnO nanoclusters on water splitting. By comparing our calculated values with experiments, we found that the B3LYP/DGDZVP2 combination of exchange functional and basis set would be a reliable and optimal combination to use in calculating the properties of ZnO nanoclusters using DFT with a relatively low computational time compared to other methods (e.g., CCSD(T)). We also studied the singlet–triplet energy difference and HOMO–LUMO gap of (ZnO)n, with n = 1–6, to select the best cluster sizes of (ZnO)n as photocatalysts. From the singlet–triplet energy comparisons, both the n = 3 and n = 6 nanocluster systems are possible photocatalysts for H2 and O2 production in a water splitting reaction. We selected (ZnO)3 rather than (ZnO)6 as a suitable nanocatalyst to study water splitting, considering the complexity of the reaction and reduction in computational time. Successive hydrolysis of two water molecules on the catalytic surface occur readily with low activation barriers. Water splitting occurs after hydrolysis with the release of hydrogen gas before oxygen. The rate-determining step is controlled by high barriers for hydrogen formation.
Acknowledgments
The authors would like to thank Stephen Cousins, Bruce Segee, and the University of Maine High Performance Computing Group for their technical assistance and allotment of computer time. The authors also thank Eric Lovejoy for his assistance to our group.
Supporting Information Available
The Supporting Information is available free of charge at https://pubs.acs.org/doi/10.1021/acsomega.1c05666.
Figures of structural and electronic properties of optimized ZnO monomer and dimer, calculated infrared spectra, density of states plots, HOMO–LUMO profiles, and other possible potential energy surfaces of the hydration and hydrolysis (ZnO)3 by two water molecules and tables of optimized neutral ZnO monomer and dimer energies, ZnO monomer frequency, ZnO anion monomer and dimer bond lengths, singlet and triplet energies HUMO and LUMO energies, dimer bond angles, Zn–O bond lengths, and ZnO monomer and dimer electron affinity values (PDF)
The authors declare no competing financial interest.
Supplementary Material
References
- Mom R. V.; Cheng J.; Koper M. T. M.; Sprik M. Modeling the Oxygen Evolution Reaction on Metal Oxides: The Infuence of Unrestricted DFT Calculations. J. Phys. Chem. C 2014, 118, 4095–4102. 10.1021/jp409373c. [DOI] [Google Scholar]
- Rousseau R.; Glezakou V.-A.; Selloni A. Theoretical insights into the surface physics and chemistry of redox-active oxides. Nature Reviews Materials 2020, 5, 460–475. 10.1038/s41578-020-0198-9. [DOI] [Google Scholar]
- Li M.; Zhu H.; Wei G.; He A.; Liu Y. DFT calculation and analysis of the gas sensing mechanism of methoxy propanol on Ag decorated SnO2 (110) surface. RSC Adv. 2019, 9, 35862–35871. 10.1039/C9RA02958C. [DOI] [PMC free article] [PubMed] [Google Scholar]
- Kovalenko M.; Bovgyra O.; Dzikovskyi V.; Bovhyra R. A DFT study for adsorption of CO and H2 on Pt-doped ZnO nanocluster. SN Appl. Sci. 2020, 2, 790. 10.1007/s42452-020-2591-9. [DOI] [Google Scholar]
- Nikolova M. P.; Chavali M. S. Metal Oxide Nanoparticles as Biomedical Materials. Biomimetics 2020, 5, 27. 10.3390/biomimetics5020027. [DOI] [PMC free article] [PubMed] [Google Scholar]
- Shin S. S.; Lee S. J.; Seok S. I. Exploring wide bandgap metal oxides for perovskite solar cells. APL Materials 2019, 7, 022401. 10.1063/1.5055607. [DOI] [Google Scholar]
- Toroker M. C.; Carter E. A. Transition metal oxide alloys as potential solar energy conversion materials. Journal of Materials Chemistry A 2013, 1, 2474–2484. 10.1039/c2ta00816e. [DOI] [Google Scholar]
- Claridge S. A.; Castleman A. W.; Khanna S. N.; Murray C. B.; Sen A.; Weiss P. S. Cluster-Assembled Materials. ACS Nano 2009, 3, 244–255. 10.1021/nn800820e. [DOI] [PubMed] [Google Scholar]
- Jena P.; Castleman A. W. Clusters: A bridge across the disciplines of physics and chemistry. Proc. Natl. Acad. Sci. U. S. A. 2006, 103, 10560–10569. 10.1073/pnas.0601782103. [DOI] [PMC free article] [PubMed] [Google Scholar]
- Byun H.-G.; Kim I.; Kwon H.-S.; Bae G.-T. Comparisons of the Functional and Basis Set Combinations for Silicon Oxide Clusters: A Density Functional Theory Study: Comparisons of the Functional and Basis Set Combinations. Bulletin of the Korean Chemical Society 2017, 38, 1310–1315. 10.1002/bkcs.11288. [DOI] [Google Scholar]
- Li S.; Dixon D. A. Benchmark Calculations on the Electron Detachment Energies of MO3– and M2O6– (M = Cr, Mo, W). J. Phys. Chem. A 2007, 111, 11908–11921. 10.1021/jp074768i. [DOI] [PubMed] [Google Scholar]
- Bae G.-T.; Dellinger B.; Hall R. W. Density Functional Calculation of the Structure and Electronic Properties of CunOn (n = 18) Clusters. J. Phys. Chem. A 2011, 115, 2087–2095. 10.1021/jp104177q. [DOI] [PMC free article] [PubMed] [Google Scholar]
- Guo L.; Ji Y. L.; Xu H.; Simon P.; Wu Z. Regularly Shaped, Single-Crystalline ZnO Nanorods with Wurtzite Structure. J. Am. Chem. Soc. 2002, 124, 14864–14865. 10.1021/ja027947g. [DOI] [PubMed] [Google Scholar]
- Jiaqiang X.; Yuping C.; Yadong L.; Jianian S. Gas sensing properties of ZnO nanorods prepared by hydrothermal method. J. Mater. Sci. 2005, 40, 2919–2921. 10.1007/s10853-005-2435-4. [DOI] [Google Scholar]
- Gong Y.; Zhou M.; Andrews L. Spectroscopic and Theoretical Studies of Transition Metal Oxides and Dioxygen Complexes. Chem. Rev. 2009, 109, 6765–6808. 10.1021/cr900185x. [DOI] [PubMed] [Google Scholar]
- Zhai H.-J.; Wang L.-M.; Li S.-D.; Wang L.-S. Vibrationally Resolved Photoelectron Spectroscopy of BO- and BO2-: A Joint Experimental and Theoretical Study. J. Phys. Chem. A 2007, 111, 1030–1035. 10.1021/jp0666939. [DOI] [PubMed] [Google Scholar]
- Fernando A.; Weerawardene K. L. D. M.; Karimova N. V.; Aikens C. M. Quantum Mechanical Studies of Large Metal, Metal Oxide, and Metal Chalcogenide Nanoparticles and Clusters. Chem. Rev. 2015, 115, 6112–6216. 10.1021/cr500506r. [DOI] [PubMed] [Google Scholar]
- Patra A. K.; Dutta A.; Bhaumik A. Self-assembled ultra small ZnO nanocrystals for dye-sensitized solar cell application. J. Solid State Chem. 2014, 215, 135–142. 10.1016/j.jssc.2014.03.036. [DOI] [Google Scholar]
- Clementi C.; Rosi F.; Romani A.; Vivani R.; Brunetti B. G.; Miliani C. Photoluminescence properties of zinc oxide in paints: a study of the effect of self-absorption and passivation. Appl. Spectrosc. 2012, 66, 1233–1241. 10.1366/12-06643. [DOI] [PubMed] [Google Scholar]
- Jin S. H.; Kang S.-K.; Cho I.-T.; Han S. Y.; Chung H. U.; Lee D. J.; Shin J.; Baek G. W.; Kim T.-i.; Lee J.-H.; Rogers J. A. Water-Soluble Thin Film Transistors and Circuits Based on Amorphous Indium–Gallium–Zinc Oxide. ACS Appl. Mater. Interfaces 2015, 7, 8268–8274. 10.1021/acsami.5b00086. [DOI] [PubMed] [Google Scholar]
- Wang Z. L. Zinc oxide nanostructures: growth, properties and applications. J. Phys.: Condens. Matter 2004, 16, R829–R858. 10.1088/0953-8984/16/25/R01. [DOI] [Google Scholar]
- Sirelkhatim A.; Mahmud S.; Seeni A.; Kaus N. H. M.; Ann L. C.; Bakhori S. K. M.; Hasan H.; Mohamad D. Review on Zinc Oxide Nanoparticles: Antibacterial Activity and Toxicity Mechanism. Nano-Micro Letters 2015, 7, 219–242. 10.1007/s40820-015-0040-x. [DOI] [PMC free article] [PubMed] [Google Scholar]
- Woodley S. B.; Sokol A. A.; Catlow C. R. A.; Al-Sunaidi A. A.; Woodley S. M. Structural and Optical Properties of Mg and Cd Doped ZnO Nanoclusters. J. Phys. Chem. C 2013, 117, 27127–27145. 10.1021/jp4084635. [DOI] [Google Scholar]
- Spencer M. J. S. Gas sensing applications of 1D-nanostructured zinc oxide: Insights from density functional theory calculations. Prog. Mater. Sci. 2012, 57, 437–486. 10.1016/j.pmatsci.2011.06.001. [DOI] [Google Scholar]
- Xu J.; Zhang Y.; Chen Y.; Xiang Q.; Pan Q.; Shi L. Uniform ZnO nanorods can be used to improve the response of ZnO gas sensor. Materials Science and Engineering: B 2008, 150, 55–60. 10.1016/j.mseb.2008.01.010. [DOI] [Google Scholar]
- Kelly S. R.; Shi X.; Back S.; Vallez L.; Park S. Y.; Siahrostami S.; Zheng X.; Nørskov J. K. ZnO As an Active and Selective Catalyst for Electrochemical Water Oxidation to Hydrogen Peroxide. ACS Catal. 2019, 9, 4593–4599. 10.1021/acscatal.8b04873. [DOI] [Google Scholar]
- Johar M. A.; Afzal R. A.; Alazba A. A.; Manzoor U. Photocatalysis and Bandgap Engineering Using ZnO Nanocomposites. Advances in Materials Science and Engineering 2015, 2015, e934587 10.1155/2015/934587. [DOI] [Google Scholar]
- Brewster M. M.; Zhou X.; Lu M.-Y.; Gradečak S. The interplay of structural and optical properties in individual ZnO nanostructures. Nanoscale 2012, 4, 1455–1462. 10.1039/c2nr11706a. [DOI] [PubMed] [Google Scholar]
- Malloci G.; Chiodo L.; Rubio A.; Mattoni A. Structural and Optoelectronic Properties of Unsaturated ZnO and ZnS Nanoclusters. J. Phys. Chem. C 2012, 116, 8741–8746. 10.1021/jp209756z. [DOI] [Google Scholar]
- Srikant V.; Clarke D. R. On the optical band gap of zinc oxide. J. Appl. Phys. 1998, 83, 5447–5451. 10.1063/1.367375. [DOI] [Google Scholar]
- Bovhyra R.; Popovych D.; Bovgyra O.; Serednytski A. Ab Initio Study of Structural and Electronic Properties of (ZnO) n “Magical” Nanoclusters n = (34, 60). Nanoscale Res. Lett. 2017, 12, 76. 10.1186/s11671-017-1848-8. [DOI] [PMC free article] [PubMed] [Google Scholar]
- Al-Sunaidi A. A.; Sokol A. A.; Catlow C. R. A.; Woodley S. M. Structures of Zinc Oxide Nanoclusters: As Found by Revolutionary Algorithm Techniques. J. Phys. Chem. C 2008, 112, 18860–18875. 10.1021/jp805983g. [DOI] [Google Scholar]
- Szakacs C. E.; Merschrod S. E. F.; Poduska K. M. Structural Features That Stabilize ZnO Clusters: An Electronic Structure Approach. Computation 2013, 1, 16–26. 10.3390/computation1010016. [DOI] [Google Scholar]
- Chen M.; Straatsma T. P.; Fang Z.; Dixon D. A. Structural and Electronic Property Study of (ZnO)n, n 168: Transition from Zinc Oxide Molecular Clusters to Ultrasmall Nanoparticles. J. Phys. Chem. C 2016, 120, 20400–20418. 10.1021/acs.jpcc.6b06730. [DOI] [Google Scholar]
- Gunaratne K. D. D.; Berkdemir C.; Harmon C. L.; Castleman A. W. Investigating the Relative Stabilities and Electronic Properties of Small Zinc Oxide Clusters. J. Phys. Chem. A 2012, 116, 12429–12437. 10.1021/jp3029374. [DOI] [PubMed] [Google Scholar]
- Dheivamalar S.; Banu K. B. The adsorption mechanism, structural and electronic properties of pyrrole adsorbed ZnO nano clusters in the field photovoltaic cells by density functional theory. Indian J. Pure Appl. Phys. 2019, 57, 713–724. [Google Scholar]
- Fang Z.; Dixon D. A. Computational Study of H2 and O2 Production from Water Splitting by Small (MO2)n Clusters (M = Ti, Zr, Hf). J. Phys. Chem. A 2013, 117, 3539–3555. 10.1021/jp401443x. [DOI] [PubMed] [Google Scholar]
- Li R.; Li C.. Photocatalytic Water Splitting on Semiconductor-Based Photocatalysts. In Advances in Catalysis; Song C., Ed.; Academic Press, 2017; Vol. 60; pp 1–57. [Google Scholar]
- Kenmoe S.; Biedermann P. U. Water aggregation and dissociation on the ZnO(100) surface. Phys. Chem. Chem. Phys. 2017, 19, 1466–1486. 10.1039/C6CP07516A. [DOI] [PubMed] [Google Scholar]
- Tissera N. D.; Wijesena R. N.; Sandaruwan C. S.; de Silva R. M.; de Alwis A.; de Silva K. M. N. Photocatalytic activity of ZnO nanoparticle encapsulated poly(acrylonitrile) nanofibers. Mater. Chem. Phys. 2018, 204, 195–206. 10.1016/j.matchemphys.2017.10.035. [DOI] [Google Scholar]
- Grewe T.; Meggouh M.; Tüysüz H. Nanocatalysts for Solar Water Splitting and a Perspective on Hydrogen Economy. Chemistry, an Asian Journal 2016, 11, 22–42. 10.1002/asia.201500723. [DOI] [PubMed] [Google Scholar]
- Jafari T.; Moharreri E.; Amin A. S.; Miao R.; Song W.; Suib S. L. Photocatalytic Water Splitting—The Untamed Dream: A Review of Recent Advances. Molecules 2016, 21, 900. 10.3390/molecules21070900. [DOI] [PMC free article] [PubMed] [Google Scholar]
- O’boyle N. M.; Tenderholt A. L.; Langner K. M. cclib: A library for package-independent computational chemistry algorithms. J. Comput. Chem. 2008, 29, 839–845. 10.1002/jcc.20823. [DOI] [PubMed] [Google Scholar]
- Schlegel H. B. Optimization of equilibrium geometries and transition structures. J. Comput. Chem. 1982, 3, 214–218. 10.1002/jcc.540030212. [DOI] [Google Scholar]
- Fukui K. The path of chemical reactions - the IRC approach. Acc. Chem. Res. 1981, 14, 363–368. 10.1021/ar00072a001. [DOI] [Google Scholar]
- Maeda S.; Harabuchi Y.; Ono Y.; Taketsugu T.; Morokuma K. Intrinsic reaction coordinate: Calculation, bifurcation, and automated search. Int. J. Quantum Chem. 2015, 115, 258–269. 10.1002/qua.24757. [DOI] [Google Scholar]
- Frisch M. J.et al. Gaussian 16, Revision C.01; Gaussian Inc.: Wallingford, CT, 2016.
- Dennington R.; Keith T. A.; Millam J. M.. GaussView, Version 6; Semichem Inc.: Shawnee Mission, KS, 2019.
- Matxain J.; Irigoras Balda A.; Fowler J.; Ugalde J. Electronic excitation energies of ZniSi clusters. J. Am. Chem. Soc. 2003, 125 (31), 9494–9499. 10.1021/ja0264504. [DOI] [PubMed] [Google Scholar]
- Fancher C. A.; de Clercq H. L.; Thomas O. C.; Robinson D. W.; Bowen K. H. Zinc oxide and its anion: A negative ion photoelectron spectroscopic study. J. Chem. Phys. 1998, 109, 8426–8429. 10.1063/1.477505. [DOI] [Google Scholar]
- Kim J. H.; Li X.; Wang L.-S.; de Clercq H. L.; Fancher C. A.; Thomas O. C.; Bowen K. H. Vibrationally Resolved Photoelectron Spectroscopy of MgO- and ZnO- and the Low-Lying Electronic States of MgO, MgO-, and ZnO. J. Phys. Chem. A 2001, 105, 5709–5718. 10.1021/jp010331d. [DOI] [Google Scholar]
- Christophorou L. G.; Kim Y.-K.; Fano U. Atomic and molecular radiation physics. Am. J. Phys. 1972, 40 (8), 1185. 10.1119/1.1986794. [DOI] [Google Scholar]
Associated Data
This section collects any data citations, data availability statements, or supplementary materials included in this article.