Abstract
The roots of the cactus Peniocereus greggii, which grows in Northern Mexico and in the south of Arizona, are highly valued by the Pima to treat diabetes and other illnesses, such as breast pain and common cold. As part of our chemical and pharmacological investigation on medicinal plants used for treating diabetes, herein we report the hypoglycemic and antihyperglycemic action of a decoction prepared from the roots of the plant. The active compounds were a series of cholestane steroids, namely, peniocerol (2), desoxyviperidone (3), viperidone (4), and viperidinone (5). Also, a new chemical entity was obtained from an alkalinized chloroform extract (CE1), which was characterized as 3,6-dihydroxycholesta-5,8(9),14-trien-7-one (6) by spectroscopic means. Desoxyviperidone (3) showed an antihyperglycemic action during an oral glucose tolerance test. Compound 3 was also able to decrease blood glucose levels during an intraperitoneal insulin tolerance test in hyperglycemic mice only in combination with insulin, thus behaving as an insulin sensitizer agent. Nevertheless, mitochondrial bioenergetic experiments revealed that compounds 3 and 6 increased basal respiration and proton leak, without affecting the respiration associated with ATP production in C2C12 myotubes. Finally, an ultraefficiency liquid chromatographic method for quantifying desoxyviperidone (3) and viperidone (4) in the crude drug was developed and validated. Altogether, our results demonstrate that Peniocereus greggii decoction possesses a hypoglycemic and antihyperglycemic action in vivo, that sterols 2 and 6 promotes insulin secretion in vitro, and that desoxyviperidone (3) physiologically behaves as an insulin sensitizer agent by a mechanism that may involve mitochondrial proton leak.
Introduction
Diabetes mellitus is a chronic metabolic disease characterized by insufficient insulin production and secretion and in the case of type 2 diabetes (T2DM) also by the inability of tissues to respond to insulin adequately.1 According to the International Diabetes Federation (IDF), approximately 527 million people live with diabetes worldwide, and 90 to 95% of those cases belong to T2DM.2 If the chronic hyperglycemia, typical of this disorder, is not adequately controlled, it increases the risk of microvascular damage (retinopathy, nephropathy, and neuropathy) and macrovascular complications (ischemic heart disease, stroke, and peripheral vascular disease).2 Treatment of T2DM primarily involves lifestyle changes and antidiabetic medications, such as metformin, rosiglitazone, glibenclamide, and dapagliflozin.3
Mexico ranks seventh in prevalence in the world with 14.1 million diabetic people.2 In recent decades, the number of individuals affected by T2DM has increased notably, this disease being one of the country’s leading causes of morbidity and mortality.4 It is estimated that Mexico has 6.7 million people with undiagnosed diabetes.2 The use of herbal drugs (alone or in combination with allopathic medications) to treat the symptoms of T2DM is common in Mexico. Unfortunately, only a few of these species have been analyzed to confirm their efficacy as antidiabetic agents.5,6
One highly valued species on Mexico’s northern border with the United States is Peniocereus greggii (Engelm.) Britton & Rose [Cactaceae]. It grows in the states of Sonora, Chihuahua, Durango, Zacatecas, Coahuila, Nuevo León, and Tamaulipas as well as southern of Arizona, New Mexico, and Texas. The plant is known as “queen of the night,” “night-blooming cereus,” “reina de la noche,” “saramatraca,” “huevo de venado,” “asta de venado,” or “ho’ok vaa’o,” “ho’o’k iwa,” and “izé biné.”7 The sprawling, usually inconspicuous, stems emerge from a large tuberous root and produces sporadically beautiful white flowers that bloom only one night with a heavy fragrance that attracts their shared pollinators from long distances. The Pima and Papago people from other indigenous and Mexican communities in southwestern United States and northern Mexico use a decoction of the roots to treat diabetes, digestive, genitourinary, and skin system disorders and to alleviate pains and the common cold, as well as a cardiac stimulant.8−15 Regrettably, this cactus is on the list of endangered species due to its use in ornamental markets at the local, national, and international levels, while its trade as a medicinal plant is only significant at the local level. Fortunately, there are institutional programs for conservation actions, including conventional propagation and transplanting programs throughout its geographic range from Durango to Arizona and in vitro propagation techniques for ex situ conservation.16−19
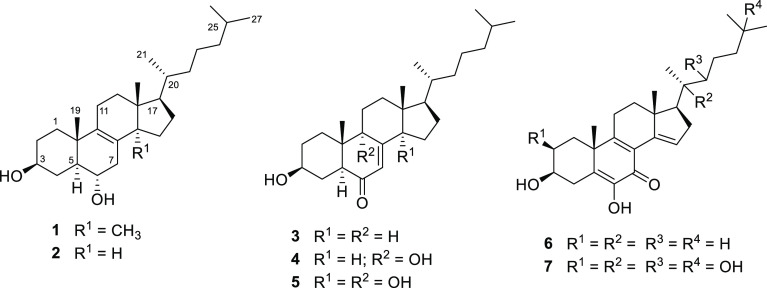
Previous chemical work on P. greggii resulted in the isolation and characterization of the steroids macdougallin (1), peniocerol (2), desoxyviperidone (3), viperidone (4), and viperidinone (5).20
As part of our chemical and pharmacological investigation on medicinal plants used for treating diabetes, herein we report (i) the antidiabetic potential of P. greggii decoction and some of its constituents using in vivo and in vitro pharmacological assays and (ii) the development and validation of an analytical procedure applicable as a pharmacopeic composition test for the quality control procedures of this valuable plant.
Results and Discussion
Acute Toxicity Assay
Acute toxicity analysis in animals is the first stage in assessing the innocuousness of herbal preparations. In this study, the Lorke method was selected to estimate the acute toxicity of the decoction from the roots of P. greggii (PGD) using ICR strain mice.21 This procedure is appropriate for testing herbal drugs and their preparations as it requires minimal use of animals. In addition, the results of this assay serve as a guide in dose selection for other pharmacological and toxicological studies involving animals. After oral administration of PGD (first phase 10–1000 mg/kg; second phase 2600–5000 mg/kg) and observing the animals for 2 weeks, no mortality was recorded; thus, the dose of PGD that kills 50% of the tested animal population (LD50) was estimated to be higher than 5 g/kg. Also, no change in behavior or signs of acute toxicity were observed, and after necropsy and macroscopical examination of vital organs, there were no differences between control and tested animals.
Hypoglycemic and Antihyperglycemic Potential of P. greggii Decoction (PGD) in Mice
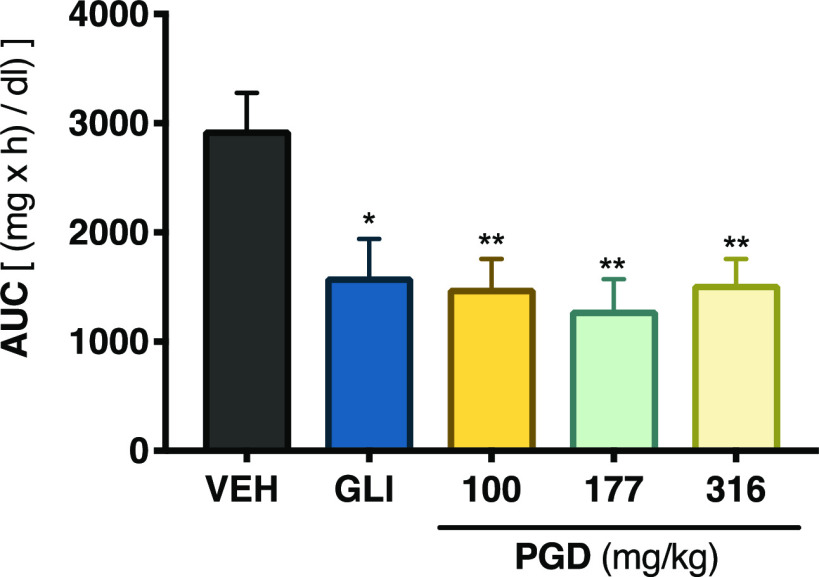
The pathogenesis of T2DM leads to a chronic state of hyperglycemia, which might be due to a decrement in insulin secretion by the pancreas, increased hepatic glucose production, and reduced muscle glucose uptake.22 Accordingly, to establish the antidiabetic potential of PGD, several in vivo tests were performed. The first experiment was an acute hypoglycemic test, which evaluated the ability of PGD to reduce blood glucose under controlled fasting conditions; we used glibenclamide (10 mg/kg) as the positive control and isotonic saline solution (NaCl 0.9%) as the vehicle. The results showed that none of the assessed traditional preparation doses decreased the glycemia in normoglycemic animals (Figure S1). However, when evaluated in the hyperglycemic mice, all doses (Figure 1) reduced blood glucose levels significantly (p < 0.05).
Figure 1.
Hypoglycemic action of PGD from P. greggii in NA-STZ-hyperglycemic mice. AUC: area under the curve; VEH: vehicle; GLI: glibenclamide (10 mg/kg). Data are expressed as mean ± SEM (n = 6). *p < 0.05 and **p < 0.01 significantly different. ANOVA followed by the Dunnett post hoc test for comparison with respect to vehicle control.
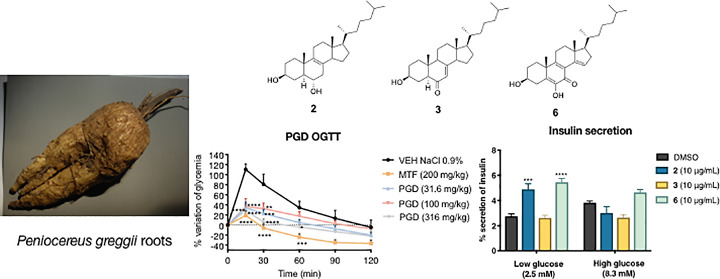
Next, the antihyperglycemic potential of PGD was tested using both oral glucose (OGTT) and sucrose (OSTT) tolerance tests; metformin (200 mg/kg) and acarbose (5 mg/kg) were the reference drugs, respectively. The results obtained in the OGTT for PGD in normoglycemic and hyperglycemic mice are depicted in Figure 2. In normoglycemic mice, only the dose of 316 mg/kg caused a significant decrease in the postprandial peak compared to the group treated with the vehicle (Panel A). In hyperglycemic mice, all the evaluated doses significantly reduced the postprandial peak (Panel B).
Figure 2.
Effect of PGD on blood glucose levels in (A) normoglycemic and (B) NA-STZ-hyperglycemic mice during an OGTT. VEH: vehicle; MTF: metformin (200 mg/kg). Data are represented as mean ± SEM (n = 6). *p < 0.05, **p < 0.01, ***p < 0.001, and ****p < 0.0001 significantly different. ANOVA followed by the Dunnett post hoc test for comparison with respect to vehicle control.
On the other hand, PGD had no significant antihyperglycemic effect in normoglycemic mice during an OSTT (Figure S1), ruling out the inhibition of intestinal α-glucosidase enzymes in the mode of action of the traditional preparation.
Altogether, these results suggested that, since PGD was a mixture of components, various mechanisms could be triggered to regulate insulin secretion/signaling, skeletal glucose uptake, glucose hepatic production, or mitochondrial function.1,22
Isolation of the Active Compounds
TLC comparative analysis of an organic soluble fraction of EtOAc obtained by partitioning PGD (PGDE) revealed that most of its constituents were also present in the two CHCl3 extracts (CE1 and CE2). The first CHCl3 extract (CE1) was prepared after basifying the vegetal material with KOH to detect the potential presence of alkaloids, so common in the Cactaceae family. CE1 was devoid of alkaloids but contained all steroid compounds detected in the PGDE soluble fraction, in addition to compound 6 (Figure S2). Therefore, CE1 was further fractionated by column chromatography to isolate some of the potential active components; this process yielded 3,6-dihydroxycholesta-5,8(9),14-trien-7-one (6), peniocerol (2), and viperidinone (5). On the other hand, extensive fractionation of CE2 afforded compounds 2–5 (Figure 3) along with β-sitosterol and β-sitosterol glucoside. This fact raised the question of whether the new chemical entity is an artifact of a nonisolated steroid.
Figure 3.
Chemical structures of compounds 2–6 isolated from the roots of P. greggii in this study and calonysterone (7).
Compound 2 was characterized by X-ray analysis (Figure 4), not previously reported. The absolute configuration was established according to the Flack parameter.23 The NMR data of peniocerol (2) are included in Table S1 and Figures S10–S15. The 1H and 13C chemical shift values agree with the information reported for other cholestane analogues possessing 5α,6α-cholest-8-ene-3β-ol.24
Figure 4.
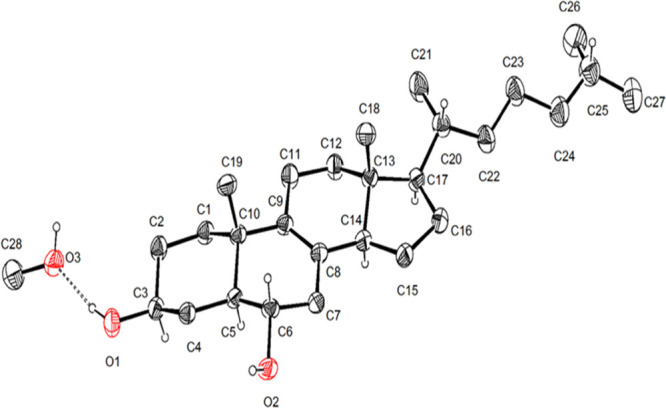
X-ray structure of peniocerol (2).
Compound 6 is a new chemical entity obtained as a white, optically active powder. Its molecular formula was determined to be C27H40O3 based on the NMR and HRESIMS data corresponding to eight indices of hydrogen deficiency and revealing a highly conjugated sterol. The IR spectrum (Figure S3) displayed characteristic signals for hydroxyl (3440 and 3391 cm–1) and conjugated ketone (2948, 2929, 1632, and 1612 cm–1).
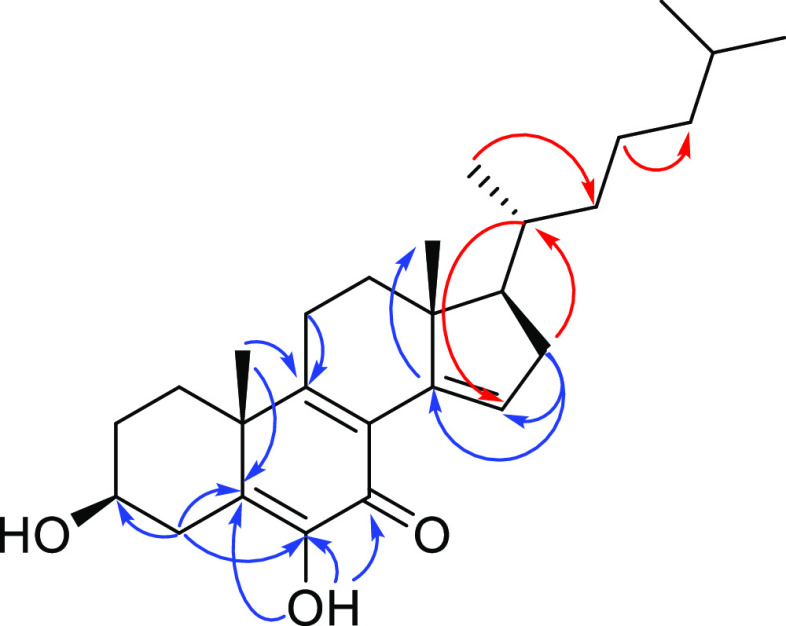
The NMR data (Table 1) also showed characteristic signals for a cholestane type of steroid, like 2–5 and calonysterone (7),25−29 a highly unsaturated natural product from the seeds of Ipomea sp. As calonysterone (7), the structure has an α-diketone grouping at C-5, C-6, and C-7, conjugated with two additional double bonds (Δ8–9 and Δ14–15). The main differences between 6 and 7 were the absence of the signals for the carbinols grouping at C-2, C-20, C-22, and C-25 in the spectra of 6. The only alcohol functionality in compound 6 was at C-3. This assignment as well as those of the remaining substituents along the cholestane core was confirmed by the analysis of the NOESY and HMBC experiments (Figure 5).
Table 1. Spectroscopic Data (700 MHz for 1H and 175 MHz for 13C) of Compound 6 in CDCl3.
|
6 | ||
|---|---|---|
| no. | δC | δH (J in Hz) |
| 1 | 35.9 | 1.25 m |
| 2 | 30.7 | 1.73 m; 1.98 m |
| 3 | 71.3 | 3.66 m |
| 4 | 33.1 | 2.16 m; 3.36 dd (13.0, 2.2) |
| 5 | 130.0 | |
| 6 | 142.9 | |
| 7 | 180.2 | |
| 8 | 124.5 | |
| 9 | 163.9 | |
| 10 | 41.2 | |
| 11 | 24.6 | 2.56 m |
| 12 | 35.9 | 1.50 m |
| 13 | 46.0 | |
| 14 | 141.7 | |
| 15 | 127.8 | 6.89 s |
| 16 | 37.1 | 2.21 m; 2.50 m |
| 17 | 56.1 | 1.54 m |
| 18 | 15.7 | 0.87 s |
| 19 | 23.7 | 1.33 s |
| 20 | 34.1 | 1.64 m |
| 21 | 19.1 | 0.97 d (6.5) |
| 22 | 36.2 | 1.08 m; 2.15 m |
| 23 | 23.9 | 1.20 m; 1.38 m |
| 24 | 39.6 | 1.15 m |
| 25 | 28.2 | 1.54 m |
| 26 | 22.7 | 0.87 d (6.5) |
| 27 | 23.0 | 0.87 d (6.5) |
| OH | 6.81 (s) | |
Figure 5.
Key HMBC (blue) and NOESY (red) correlations for compound 6.
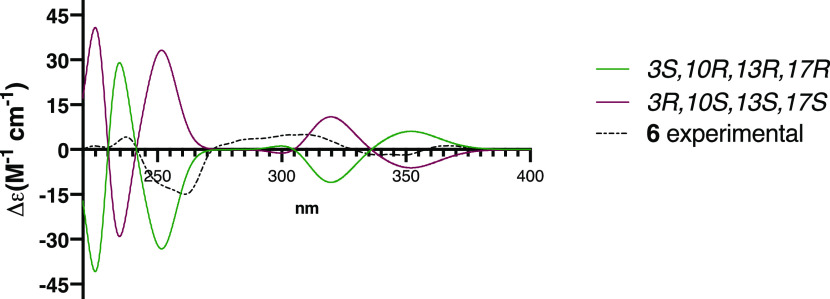
The absolute configuration at the stereogenic centers was determined to be 3S,10R,13R,17R by comparing the experimental electronic circular dichroism (ECD) of 6, with those calculated for the enantiomers 3S,10R,13R,17R and 3R,10S,13S,17S using the DFT B3LYP level of theory (Figure 6).
Figure 6.
Comparison of the experimental ECD spectrum of compound 6 (black dotted line) with calculated spectra for the enantiomers 3S,10R,13R,17R (green) and 3R,10S,13S,17S (purple).
In Vivo Antidiabetic Potential of Compound 3
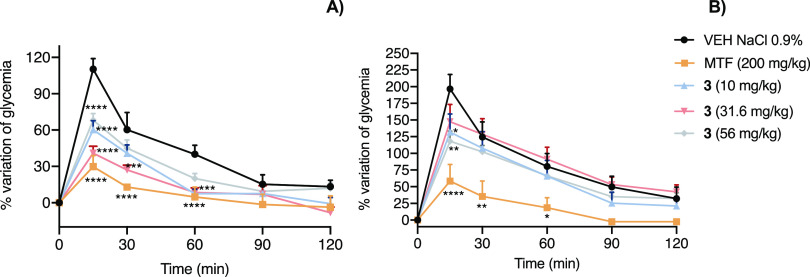
Desoxyviperidone (3), the most abundant compound of PGDE, was selected to pursue in vivo studies. When compound 3 was subjected to an OGTT (Figure 7), it significantly decreased the postprandial peak in normoglycemic (p < 0.0001) and hyperglycemic (p < 0.01) mice.
Figure 7.
Effect of compound 3 on blood glucose levels in (A) normoglycemic and (B) STZ-hyperglycemic mice during an OGTT. VEH: vehicle; MTF: metformin (200 mg/kg). Data are represented as mean ± SEM (n = 6). *p < 0.05, **p < 0.01, ***p < 0.001, and ****p < 0.0001 significantly different. ANOVA followed by the Dunnett post hoc test for comparison with respect to vehicle control.
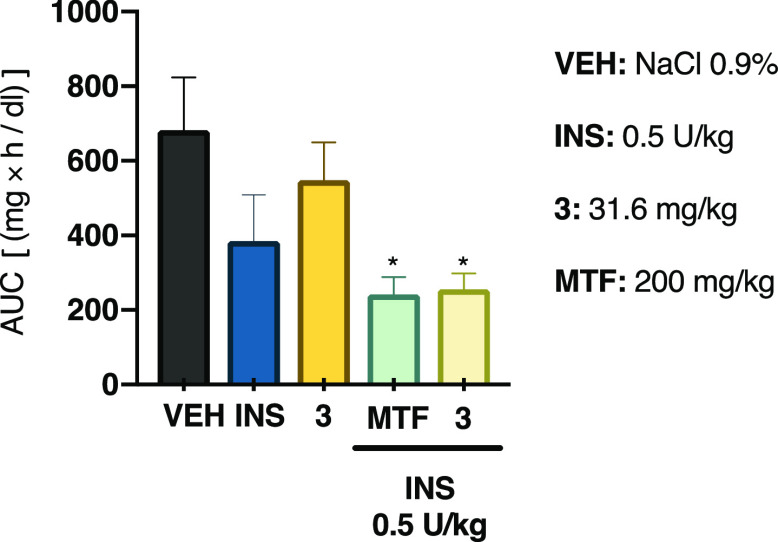
Analysis of the OGTT time-course curves built for desoxyviperidone (3) indicated that its mode of action could involve (i) an insulin sensitizer action, which leads to an increment in the glucose uptake in peripheral tissues or (ii) a mechanism related to glucose-stimulated insulin secretion.1,33 In order to gain further information on the insulin sensitizer mechanism of sterol 3, an intraperitoneal insulin tolerance test (ITT) in hyperglycemic mice was conducted. Compound 3 by itself did not have a hypoglycemic effect; however, in combination with a low dose of insulin, it produced a statistically significant decrease of blood glucose in the same way that the combination of insulin and metformin, a well-known insulin sensitizer, did (Figure 8).34 Thus, it is likely that compound 3 increased insulin actions. It has been previously demonstrated that other sterols, such as ergosterol, dehydrocholesterol, and 7-dehydrocholesterol, can support insulin receptor autophosphorylation, thus stimulating its downstream signaling, which includes GLUT4 translocation and the consequent glycemia reduction.35
Figure 8.
Effect of compound 3 on the intraperitoneal insulin tolerance test (ITT) in NA-STZ-hyperglycemic mice. AUC: area under the curve; VEH: vehicle; INS: insulin (0.5 U/kg); MTF: metformin (200 mg/kg). Each bar represents the mean ± SEM (n = 6). *p < 0.05 significantly different. ANOVA followed by the Dunnett post hoc test for comparison with respect to vehicle control.
Effect of Compounds 2, 3, and 6 on Insulin Secretion
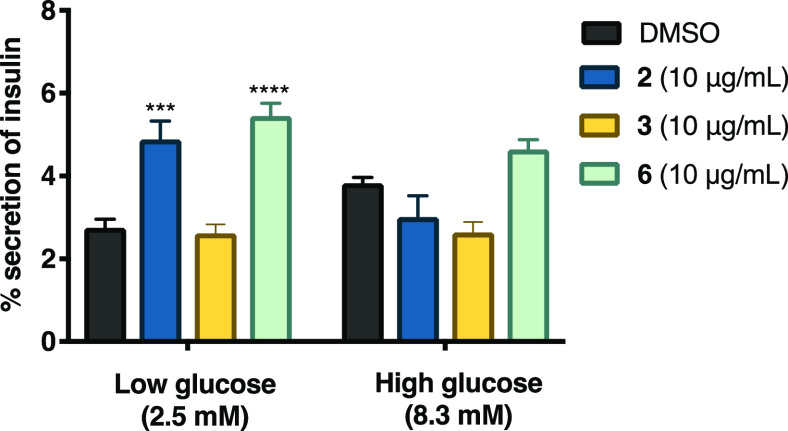
To evaluate the effect of compounds 2, 3, and 6 on insulin secretion, we performed an in vitro experiment using rat insulinoma INS-1E cells. Compounds 2 and 6 promoted insulin secretion in pancreatic cells (Figure 9). Specifically, at low glucose concentrations, compounds 2 and 6 produced a significant increase in insulin secretion compared to the control (p < 0.0001 and p < 0.01, respectively). In contrast, only compound 6 tended to increase insulin secretion in cells exposed to high glucose concentrations. These results confirmed that compound 2 promotes insulin secretion, which might partly explain the decoction’s hypoglycemic effect. However, 3 did not promote insulin secretion, which suggests that its hypoglycemic effect may be attributed to an insulin sensitizer effect as suggested by the ITT. To our knowledge, this is the first report on the insulin secretion potential of sterols and further research should be conducted to gain a better understanding of the hypoglycemic potential of these compounds.
Figure 9.
Effect of compounds 2, 3, and 6 on insulin secretion in rat insulinoma. AUC: area under the curve; control: DMSO. Each bar represents the mean ± SEM (n = 3). ***p < 0.01 and ****p < 0.0001 significantly different. ANOVA followed by the Tukey post hoc test for comparison with respect to vehicle control.
Compounds 2 and 6 have in common the presence of Δ8–9 and hydroxyl groups at C-6 and C-3. There are not enough data to make a clear conclusion regarding the structure–activity relationship.
Effect of Compounds 2, 3, and 6 on the Mitochondrial Function
The significance of estimating the mitochondrial function is associated with energy production and has an important role in carbohydrate and lipid metabolism homeostasis. Mitochondrial bioenergetics analyses often recognize the role of mitochondrial dysfunction in the etiology of skeletal muscle insulin resistance and glucose intolerance that results from obesity and T2DM.36 Thus, the effect of 2, 3, and 6 on mitochondrial bioenergetics was analyzed in C2C12 mouse myotubes using the Seahorse Extracellular Flux apparatus. This device measures the oxygen consumption rate (OCR, proportional to mitochondrial respiration) and extracellular acidification rate (ECAR, proportional to proton flux attributed to glycolysis) after adding some inhibitors of the respiratory chain in the following order: oligomycin (2 mM, an ATPase inhibitor), FCCP (0.5 mM, a decoupling agent), and a mixture of rotenone and antimycin A (0.5 mM, complex I and III inhibitors, respectively). From the OCR graphs (panels A and B, Figure 10), several parameters (basal, ATP production, H+-leak, maximal respiration, spare respiratory capacity, and nonmitochondrial respiration) are calculated, which in turn measure the ability of the tested compounds to modify a dysfunction of mitochondrial function. The ECAR graphs (panels C and D, Figure 10) indicate anaerobic energy production, a pathway that prevails in T2DM.37
Figure 10.
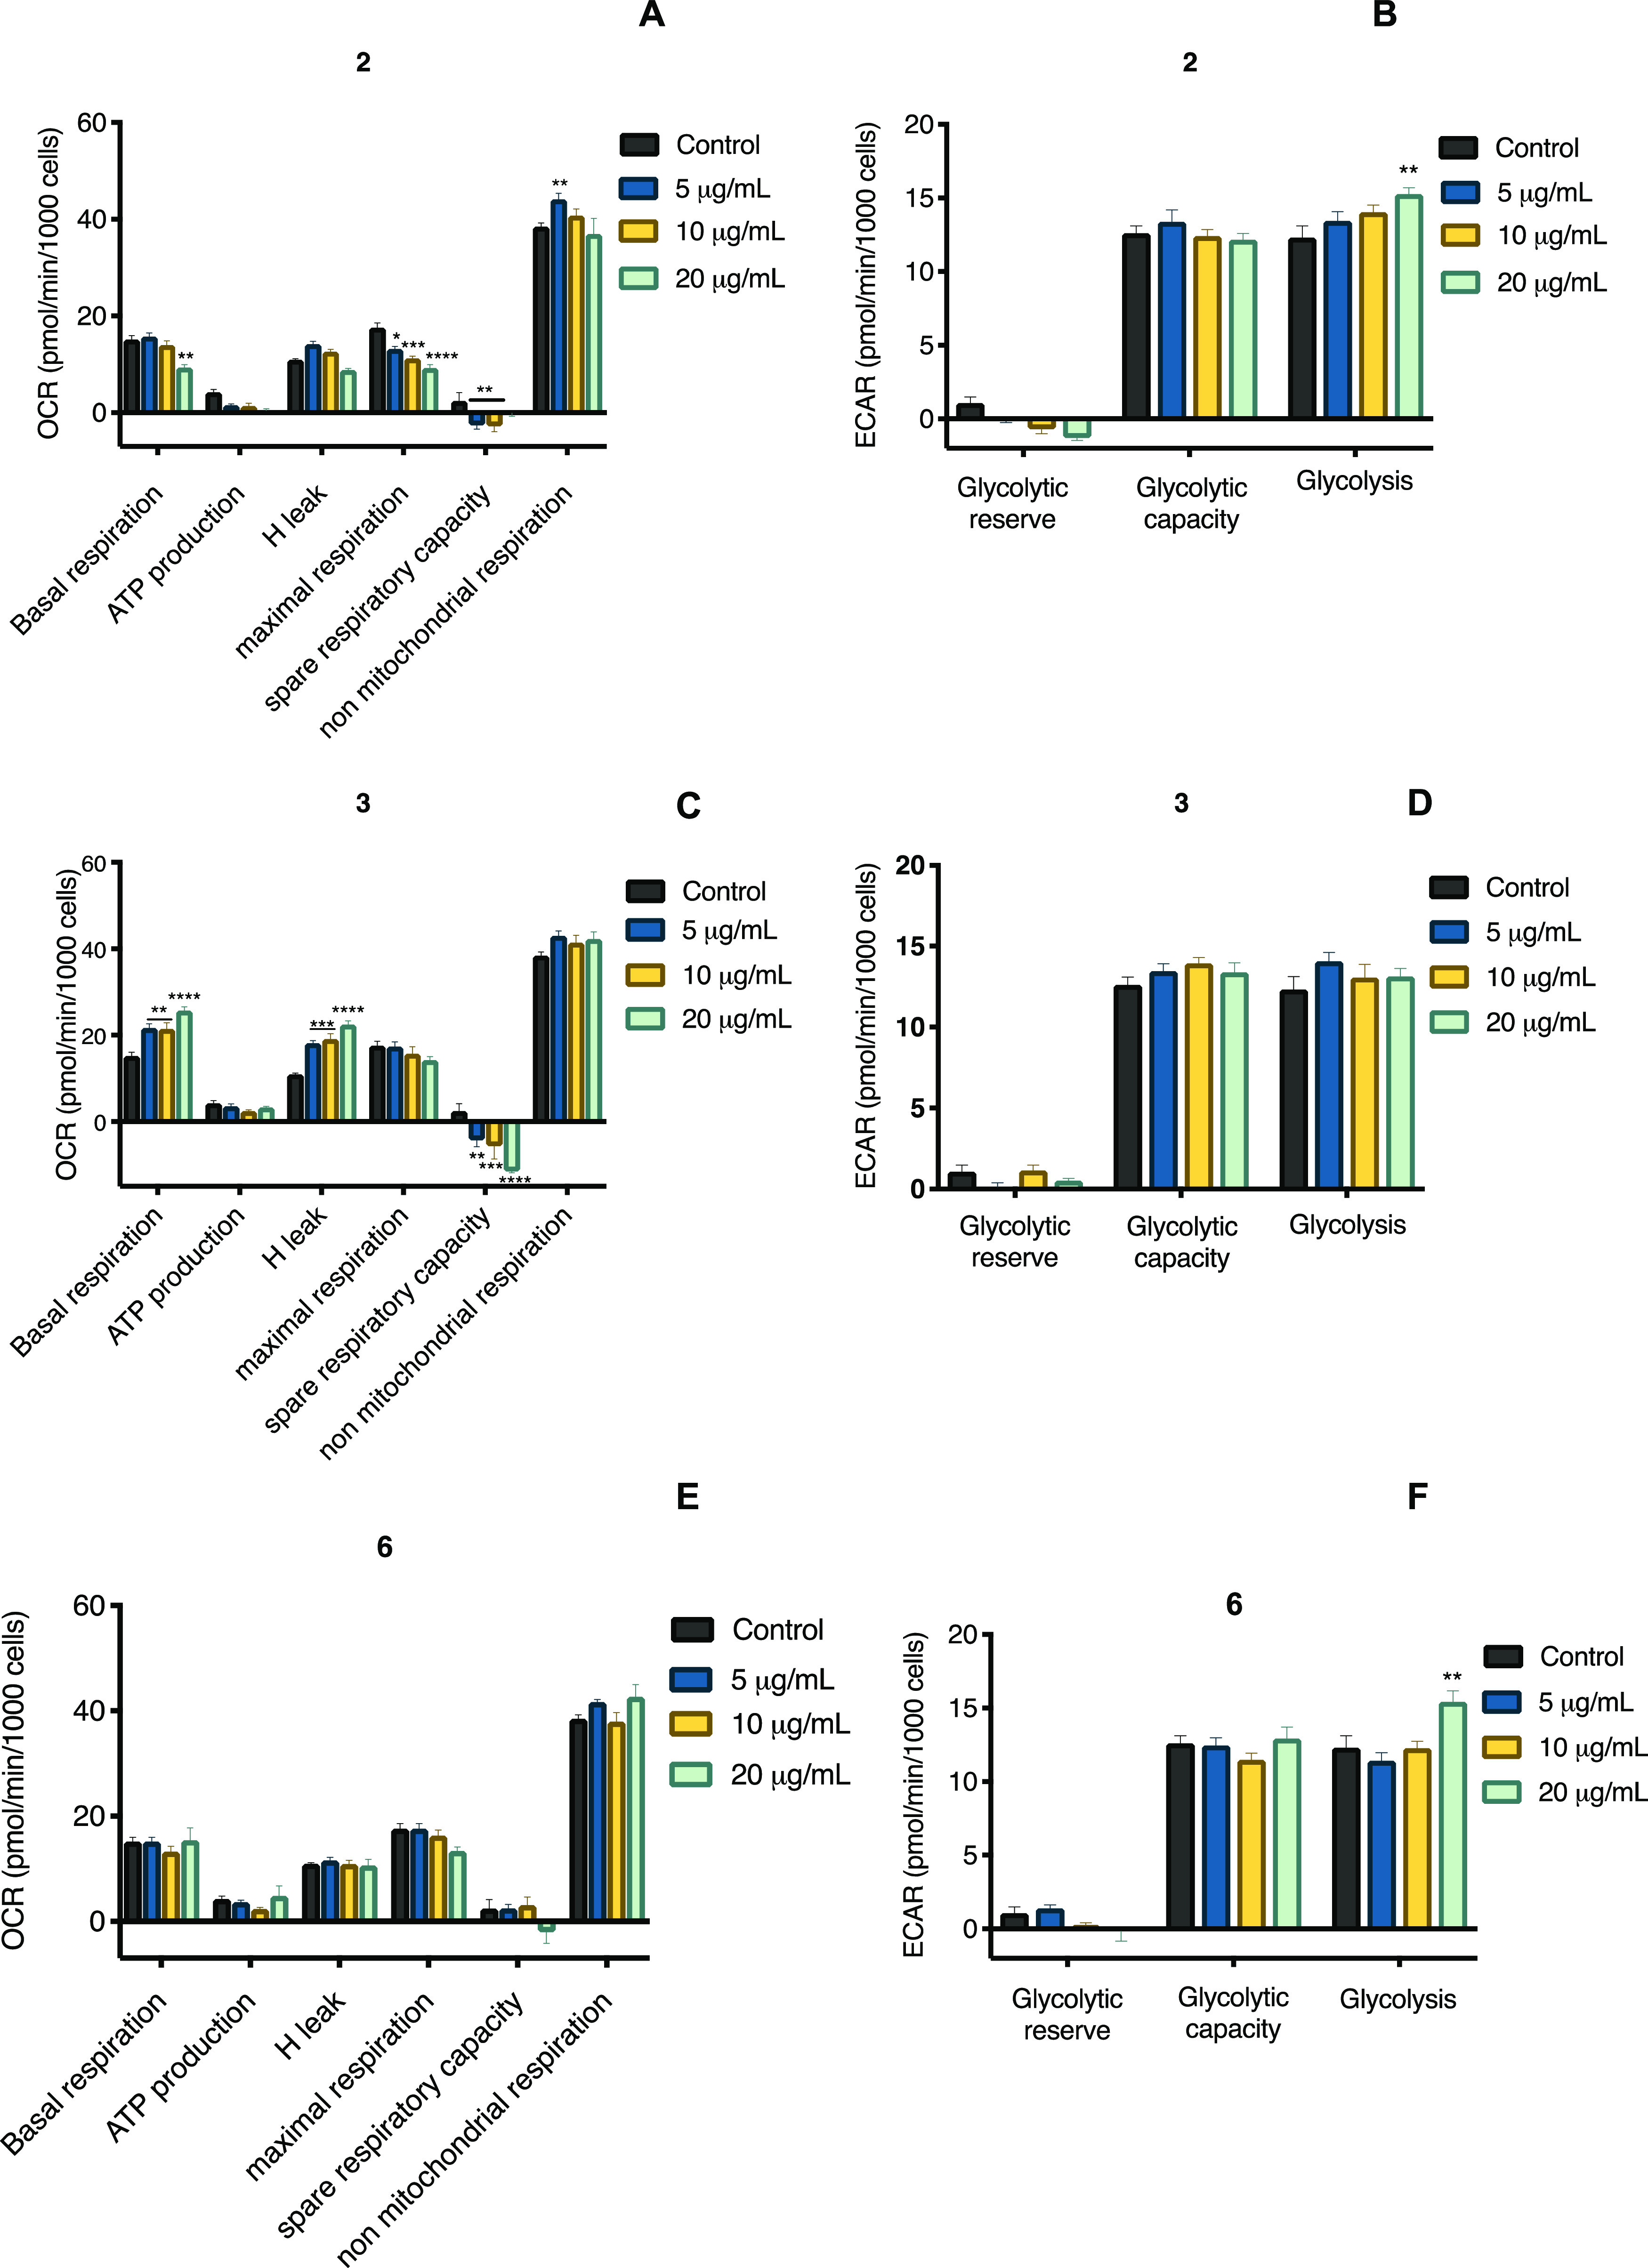
(A, C, and E) Oxygen consumption rate and (B, D, and F) extracellular acidification rate in C2C12 mouse myoblast cells of compounds 2, 3, and 6. Each bar represents the mean ± SEM (n = 3). ***p < 0.01 and ****p < 0.0001 significantly different. ANOVA followed by the Tukey post hoc test for comparison with respect to control.
The results obtained from mitochondrial respiration and glycolysis are shown in Figures 10 and S26. Compound 3 increased the basal respiration and proton leak in a concentration-dependent fashion. On the other hand, none of the compounds affected ATP production, and only compound 2 decreased the maximum respiration in proportion to sterol concentration. Compounds 2 and 3 reduced the spare respiratory capacity, but 6 incremented it at low concentrations. Finally, compound 6 increased the nonmitochondrial respiration, compound 3 did not affect it, and 2 slightly diminished it.
Proton leak can be classified in a constitutive, which is the basal proton conductance of mitochondria, and regulated way, that is, induced through uncoupling proteins.38 Proton leak through uncoupling proteins modulates thermogenesis and maintains carbon flux despite the low ATP demand. Increasing these two mechanisms would improve insulin sensitivity.39 Thus, our results display the therapeutic potential of compound 3 through modulation of proton leak.
According to the ECAR graphs, compounds 2 and 6 at the highest concentration tested increased the glycolysis (Figure 10). Based on these results, it can be concluded that 3 and 6 are compounds that act favorably to increase glucose utilization, which could have a positive impact on muscle cells of subjects with T2DM.
UPLC-APCI-MS Method for the Identification of 3 and 4 in PGDE
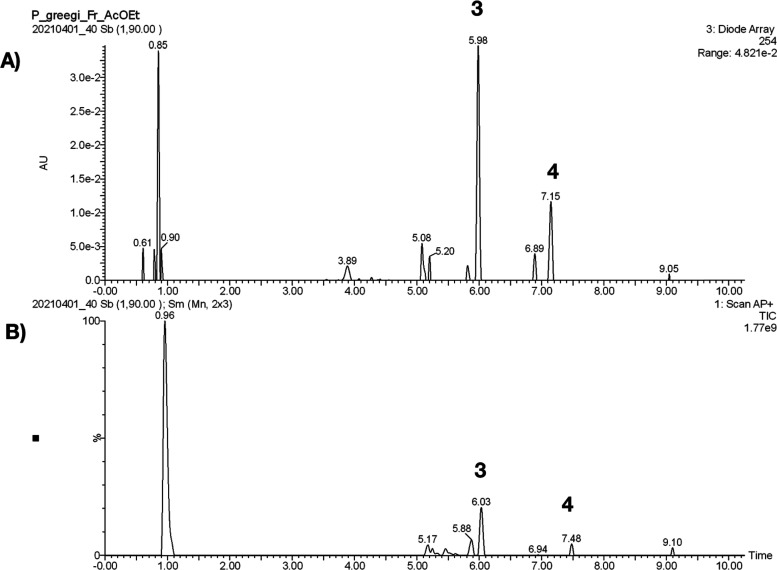
A suitable method was developed and validated to quantify simultaneously two components in PGDE. The major components were sterols 3 and 4, which were selectively extracted and identified using an UPLC-APCI-MS method (Figure 11). The validation of the method for quantitative analysis was carried out according to the ICH guidelines (2015) by determining different quality parameters, such as linearity, limits of detection (LOD), limits of quantification (LOQ), accuracy, and precision (Table S2).40 Finally, the developed UPLC-APCI-MS method was applied for quantitative analysis in four different samples (Batches I–IV). The amounts of 3 were in the range of 12 to 68 mg/g, while in 4, they were in the range of 116 to 248 mg/g, showing a higher variability between the four samples (Table S3).
Figure 11.
(A) LC chromatogram of PGDE. The elution program was as follows: 0 min, 50% A; 1.0 min 50% A; 3.0 min 85% A; 5.0 min 90% A; 7.0 min 100% A; 9.0 min 100% A; 9.10 min 50% A; 11.0 min 50% A (mobile phase consisting of 50% methanol (A) and water adjusted to pH 2.8 with formic acid (FA; B). Flow rate: 0.3 mL/min; injection volume: 3 μL. Peaks: desoxyviperidone (3); viperidone (4). (B) Typical total ion chromatogram in positive-ion APCI-MS mode for compounds 3 and 4.
Conclusions
In summary, PGD possesses a hypoglycemic and antihyperglycemic action in vivo, supporting the medicinal use of P. greggii for treating diabetes in Mexican folk medicine. The active principles were cholestane steroids. The major compound of CE2, desoxyviperidone (3), physiologically behaves as an insulin sensitizer agent by a mechanism that may involve mitochondrial proton leak. Sterol 2 and a new chemical entity (6) promoted insulin secretion in vitro. Compound 3 improved the mitochondrial function, impaired in the diabetic condition. Thus, the efficacy of PGD is related to the mixtures of compounds in the preparation, which might be acting by synergistic multitarget effects or other mechanisms yet to be elucidated. Finally, to estimate the amount of the major class of active constituents, a precise, reliable, and accurate UPLC method was developed for quantifying desoxyviperidone (3) and viperidone (4) in PGDE. The method was validated and selective, linear, precise, and accurate in the range of concentrations evaluated. This procedure will be suitable for formulating standardized preparations of this species.
Experimental Section
General Experimental Procedures
NMR spectra, including bidimensional, were recorded in CDCl3 solution on a Bruker Avance III HD or Bruker BioSpin (Billerica, MA) spectrometer at either 700 or 400 MHz (1H) and 175 or 100 MHz (13C), using tetramethylsilane (TMS) as the internal standard. Mass spectra of the isolates were obtained with an Acquity UHPLC-H Class system (Waters, Milford, MA). Optical rotation was obtained with an Anton Para MCP 150 polarimeter. Column chromatography (CC) was carried out on silica gel 60 (Merck, Darmstadt, Germany).
Reagents
Analytical grade solvents (CHCl3, EtOAc, and n-hexane) and high-performance liquid chromatography (HPLC) grade solvents (MeOH and H2O) were purchased from J.T. Baker (Avantor, Radnor, PA). Analytical reagents [glibenclamide (GLI), metformin (MTF), glucose, nicotinamide (NA), streptozotocin (STZ), and Tween 80] were purchased from Sigma-Aldrich (St. Louis, MO).
Plant Materials and Preparation of the Extracts
Peniocereus greggii roots were obtained from northern Chihuahua, Mexico, on August 2018 (Batch I), April 2019 (Batch II), June 2019 (Batch III), and March 2020 (Batch IV). Authentication of the plant was carried out by Dr. Robert Bye and Edelmira Linares [voucher specimens: 39908 were deposited at National Herbarium (MEXU)], who also provided the picture. The image is available, free of charge. For biological testing, an aqueous extract was prepared using the decoction technique, by boiling 5 g of ground and dried roots in distilled water (250 mL) for 5 min. The extract (PGD) was filtered and concentrated in vacuo to yield a brownish residue (4.73 g), and this process was repeated as needed.
Compound Isolation
Comparative chromatographic analysis of an EtOAc soluble fraction (PGDE) obtained by partitioning of PGD revealed that most of its constituents were also present in two CHCl3 extracts (CE1 and CE2) prepared under different conditions (Figure S2). The first CHCl3 extract (CE1) was prepared after basifying the vegetal material with KOH (200 g of plant material was wetted with 200 mL of KOH 10% and allowed to dry at room temperature) with the purpose of detecting the presence of alkaloids. However, the presence of alkaloids in CE1 was not detected. CE2 was prepared with powdered plant material (2 kg of roots). The extraction process was carried out using the technique of maceration with chloroform (1 and 4 L, respectively) for 21 days. The extracts were filtered, and the solvent was evaporated in a rotary evaporator under reduced pressure at 40 °C to yield a brown residue (6.0 and 182 g, respectively). CE1 and CE2 were independently fractionated by open CC on silica gel (240 g and 3.0 kg, respectively) eluted with a gradient of hexane–EtOAc (90:10 to 0:100, v/v) and EtOAc–MeOH (100:0 to 80:20, v/v). Peniocerol (2, 153 mg), viperidinone (5, 89 mg), and 3,6-dihydroxycholesta-5,8(9),14-trien-7-one (6, 100 mg) were obtained from CE1, while CE2 yielded six primary fractions (FI–FVI). From fraction FIV (389 mg) precipitated, a white solid was purified by CC on silica gel eluted with an isocratic system (hexane–EtOAc, 30:70) to yield desoxyviperidone (3, 234 mg). Fraction FV (325 mg) was fractionated by CC on silica gel eluted with a gradient of CH2Cl2–MeOH to obtain seven secondary fractions (FV-1–FV-7). Fraction FV-2 (114 mg) was purified using CC on silica gel [hexane–EtOAc, 30:70] to yield 52 mg of viperidone (4). The structures of the isolates were characterized by spectroscopic and spectrometric analyses and by comparison with literature data (Figures S3–S25).24−32 Compounds 2–5 were identified in ethyl acetate soluble fraction derived from the decoction of the roots of P. greggii.
Compound 6
Yellowish solid; mp: 172–173 °C; [α]20D + 7.909 (c 1.1, CHCl3); UV (CHCl3) λmax: 223 nm; FT-IR νmax; 3440.15, 3391.65, 2929.95, 2948.50, 2867.97, 1632.81, and 1612.83 cm–1; 1H and 13C see Table 1; HRESIMS m/z 413.2881 [M + H]+ (calcd for 413.2849, C27H40O3).
X-Ray Crystal Structure Analysis of Compound 2
Single crystals suitable for X-ray analysis were obtained by recrystallization from CH2Cl2–MeOH (1:1). A crystal having approximate dimensions of 0.368 × 0.240 × 0.088 mm3 was mounted on a glass fiber. All measurements were made using a Bruker Smart Apex CCD diffractometer equipped with graphite-monochromate Mo Kα radiation (λ = 0.710 73 Å) at 150 K. The structure was solved by the SHELXS-2013 method and refined using full-matrix least-squares on F2. Crystallographic data for 2 have been deposited with the Cambridge Crystallographic Data Centre (CCDC) with the accession no. 2129283. These data are available, free of charge, from the CCDC via http://www.ccdc.cam.ac.uk/data_request/cif.
Crystal Data for 2
C28H50O3, MW 434.68, orthorhombic, space group P212121 with unit cell parameters a = 8.13190(10) Å, b = 9.08460(10) Å, c = 36.6785(5) Å, α = 90°, β = 90°, γ = 90°, Z = 4, T = 298(2) K, volume 2709.63(6) Å3, F(000) 968, density (calcd) 1.066 Mg/m3. Intensity data were collected in the range of 2.409° to 68.226° using a ω scan; 17.434 reflections were collected, and 4900 [R(int) = 0.0635] were considered, observed, and used in the calculations. The final R1 values were 0.0802 [I > 2σ(I)]. The final wR2(F2) values were 0.1118 [I > 2σ(I)], with a data–restraint–parameter ratio of 4900/3/295. The final R1 values were 0.1118 (all data). The final wR2(F2) values were 0.1497 (all data). The absolute structure parameter was −016 (1.5).
ECD Calculations
Minimum energy structures from 6 were built using Spartan’ 08 software (Wavefunction Inc., Irvine, CA). Conformational analysis was carried out with the Monte Carlo search protocol under MMFF molecular mechanics approximation. Conformers with relative energy under 5 kcal/mol were submitted to Gaussian 09 program (Gaussian Inc., Wallingford, CT) calculation for geometry optimization using the DFT B3LYP/DGTZVP level of theory and the default model for CHCl3 as the solvent. The same DFT method in CHCl3 was employed for ECD calculations using the DFT-minimized conformers. The calculated excitation energy (nm) and rotatory strength (R) in dipole velocity (Rvel) and dipole length (Rlen) forms were simulated into an ECD curve. The calculated and weighted ECD curves were all generated using SpecDis 1.71.41
In Vivo Assay with PGD or Compounds
Preclinical evaluations were performed in accordance with the Mexican Official Norm for Laboratory Animal Care and Use (NOM-062-ZOO-1999) and with internationally accepted principles for laboratory animal use and care and were approved by the Institutional Committee for Care and Use of Laboratory Animals (CICUAL-FQ), Facultad de Química, UNAM (FQ/CICUAL/403/20). Eight-week-old male ICR or CD1 mice (25–36 g) were used. The animals were acclimatized under controlled temperature (22 ± 2 °C) on a light/dark (12 h/12 h) cycle, with standard rodent diet (LabDiet 5001, MO) and purified water ad libitum before experiments for 3 days. For ICR mice, chemical hyperglycemia was induced as previously described by i.p. injection of a single dose of nicotinamide (NA; 50 mg/kg) dissolved in isotonic saline solution and streptozotocin (STZ; 130 mg/kg) solubilized in citrate buffer (pH 4.5).42,43 For CD1 mice, the state of hyperglycemia was induced by three subsequent doses of STZ (40 mg/kg, i.p.); 21 days after the first dose, the experiments were carried out.32 Blood glucose levels were measured using a commercial glucometer (One Touch Ultra 2, Johnson & Johnson, NJ). Blood samples were collected by means of a small incision at the end of the tail, and mice that had glycemic values greater than 200 mg/dL were used. The percentage variation of glycemia for each animal was calculated with respect to its basal level as follows: % variation of glycemia = [(Gt – Gi)/Gi] × 100, where Gi is basal glycemia and Gt are the different glycemia values after treatment administration. Euthanasia of mice was set at the end of the experiments by hypoxia in a CO2 chamber.42
Acute Oral Toxicity in Mice
PGD was assessed for potential acute toxicity according to the Lorke procedure.21 Briefly, the samples were administered by an intragastric route in two independent phases: in both, twelve mice were divided into four groups (n = 3). Doses administered in the first phase were 10, 100, and 1000 mg/kg. In the second phase, the doses were 1600, 2900, and 5000 mg/kg. Control animals received 0.05% Tween 80 in saline solution. In both phases, the animals were observed to identify acute toxic effects, changes in the behavior pattern, or mortality. Mice weight was registered daily for 14 days. At the end of the experiments, all animals were sacrificed by cervical dislocation to obtain the heart, lungs, liver, and kidneys to detect macroscopic organ damage.
Acute Hypoglycemic Assay in Normoglycemic and Hyperglycemic Mice
Normal and hyperglycemic mice were randomly divided in five groups (n = 6) and deprived of food before testing with access to purified water ad libitum. PGD was tested using doses of 31.6, 100, and 316 mg/kg; glibenclamide (GLI; 10 mg/kg) was used as a positive control and saline solution as a vehicle (NaCl 0.9%). Blood samples were collected at 0, 0.5, 1.5, 3, 5, and 7 h after treatment administration. Percentage variation of glycemia was calculated as stated before. Area under the curve (mg × h dL–1) was obtained with the trapezoidal method.42
Oral Glucose and Sucrose Tolerance Tests (OGTT and OSTT) in Normoglycemic and Hyperglycemic Mice
OGTT and OSTT were conducted in both normoglycemic and hyperglycemic mice. Animals were deprived of food 4 h before the experiment with free access to drinking water. PGD was tested at the doses of 31.6, 100, and 316 mg/kg and compound 3 at three doses (10, 31.6, and 56 mg/kg). The vehicle group received saline solution. The positive controls were metformin (MTF; 200 mg/kg) in the case of OGTT or acarbose (ACA; 5 mg/kg) in the case of OSTT. Basal glycemia was recorded as previously stated, before intragastric administration of treatments. Thirty minutes later, all animals received an oral glucose (1 g/kg) or sucrose (2 g/kg) load. Blood samples were collected at 30, 60, 90, and 120 min after the administration of the carbohydrate. Percentage variation of glycemia was calculated as previously described.42
Insulin Tolerance Test
Hyperglycemic CD1 mice were deprived of food for 4 h before the experiment. After this, basal glycemia was measured, and the mice received either the vehicle or a single dose of compound 3 (31.6 mg/kg) or MTF (200 mg/kg). Thirty minutes after treatment, the mice received an intraperitoneal dose of 0.5 U/kg of insulin. Glycemia was measured at 15, 30, 60, 90, and 120 min following insulin administration. Percentage variation of glycemia and AUC was calculated as previously described.44
Statistics
The results are expressed as mean ± standard error mean (SEM) of glycemia variation or AUC. Statistical significance (p < 0.05) was assessed with the GraphPad Prims software (version 8.0; GraphPad Inc., LA Jolla, CA) using one-way or two-way ANOVA tests followed by an appropriate post hoc test.
In Vitro Assay with Compounds
Muscle cell lines were purchased from the American Type Culture Collection (ATTC; Manassas, VA) and were grown in an incubator under a 5% CO2-humidified atmosphere at 37 °C. C2C12 mouse myotubes were differentiated and treated overnight with the indicated concentrations of the compounds. INS-1E cells (rat insulinoma) were kindly donated by Profs. C. B. Wollhein and Pierre Maechler of the University of Geneva (Switzerland). INS-1E cells were cultured in the RPMI 1640 medium supplemented with 10% fetal calf serum, 1 mM sodium pyruvate, 50 μM 2-mercaptoethanol, 2 mM glutamine, 10 mM HEPES, 100 U/mL penicillin, and 100 μg/mL streptomycin under standard incubator conditions.44−46
INS-1E Cell Culture and Insulin Secretion Assays
For insulin secretion assays, INS-1E cells were seeded on 24-well plates and after 48 h treated with 5, 10, or 20 μg/mL of compounds 2, 3, and 6 for 2 h as previously reported. The insulin secretion was expressed as the percentage of insulin secreted into the media with respect to the sum of the secreted and total insulin content.44−46
Mitochondrial Respiration
A Seahorse Extracellular Flux (XF) 96 Analyzer (Seahorse Bioscience, Inc., North Billerica, MA) was used to measure the oxygen consumption rate (OCR) and extracellular acidification rate (ECAR) in C2C12 mouse myotubes. The OCR and ECAR were measured after the cells were incubated for 18 h with compounds 2, 3, and 6 (5, 10, and 20 μg/mL), and the cells were washed with an XF base medium supplemented with 10 mM glucose, 2 mM glutamine, and 1 mM pyruvate (pH = 7.4) and were then incubated in this medium for 1 h at 37 °C in a non-CO2 incubator. The plates were put in a Seahorse XF96 at 37 °C for 10 min calibration and 3 measurement cycles to record basal cellular respiration. Oligomycin (2 μM), FCCP (0.5 μM), and a mixture of rotenone plus antimycin A (0.5 μM) were added sequentially, and three measurements were performed after the addition of each concentration of the compounds.44−46
UPLC-APCI-MS Method
Acetonitrile and water of LC–MS grade and formic acid (FA) of HPLC-grade were purchased from J.T. Baker (Avantor, Radnor, PA). Desoxyviperidone (3) and viperidone (4) (purities ≥98%) used as standards were isolated from the CE2 extract of P. greggii.
The stock standard solutions for LC analysis of 3 and 4 were prepared at a final concentration of 1 mg/mL. Working solutions for the standards were prepared by diluting the stock solution in dioxane–methanol (1:1). Sample solutions of each extract (75 μg/mL) were prepared following the same procedure as the stock standard solutions. Before analysis, the solutions were filtrated using 0.20 μm GHP membranes.
An Acquity UHPLC-H Class system from Waters corporation (Milford, MA) was used as a liquid chromatographic system. The instrument consists of a quaternary pump, an autosampler, an UV–visible diode array, and a single quadrupole (SQD2) detector. The column temperature was controlled with a column oven at 40 °C. The samples were separated using an Acquity UPLC BEH Shield RP18 column (1.7 μm, 2.1 × 100 mm) with a guard column (Waters). A binary mobile phase consisting of 50% methanol (A) and water adjusted to pH 2.8 with formic acid (FA; B) was found to be the most appropriate. A flow rate of 0.3 mL/min with an injection volume of 3 μL was used. Elution was carried out according to the following gradient program: 0 min, 50% A; 1.0 min 50% A; 3.0 min 85% A; 5.0 min 90% A; 7.0 min 100% A; 9.0 min 100% A; 9.10 min 50% A; and 11.0 min 50% A. Detection was carried out at 254 nm. An APCI source was used under the following conditions: probe temperature: 550 °C, gas flow: 250 (L/h), capillary voltage: 50 V, and corona current: 0.3 μA. Under the conditions described above, the retention times (RT) of desoxyviperidone (3) and viperidone (4) were found to be 5.98 and 7.15 min, respectively. MassLynk software version 4.1 was used to control the UPLC-APCI-MS system and for data acquisition and processing. The concentrations were calculated using peak area ratios, and the linearity of the calibration curve was determined using least squares regression analysis. All statistical calculations relative to quantitative analysis were performed using Origin 8.0 software (Origin Labs, MA).
The proposed UPLC-APCI-MS method for quantitative analysis was validated based on linearity, LOD, LOQ, intraday and interday precisions, and accuracy.
For linearity, LOD, and LOQ, standard calibration curves for quantifying 3 and 4 were obtained by plotting concentration (μg/mL) against response. Six different concentrations for each of the two standards in the range of 5–75 μg/mL were prepared in sextuplicate. All dilutions were made in dioxane–methanol (1:1). LOQ were determined through the analysis of solutions containing decreasing concentrations of each analyte, to achieve the lowest determinable level with acceptable precision and accuracy under the established conditions. The LOD was estimated based on the relation between the standard deviation (Sy/x) of the standard intercept (b0) and the slope (b1) of the analytical curve (eq 1).40
| 1 |
The repeatability and the intermediate precision of six identical samples were analyzed according to the method described above on two different days and by two different analysts in triplicate. The standard deviation and coefficient of variation were calculated for each day. Finally, method accuracy was tested by recovery, assaying three different concentrations of six samples (5, 25, and 75 μg/mL) in triplicate. All compounds were added simultaneously to ethyl acetate soluble fraction and analyzed according to the method previously described. The mean percentage recoveries for 3 and 4 were found to be between 98 and 102% by means of Fisher’s F-test.40
Acknowledgments
This work was supported by grants from CONACyT CB A1-S-11226 and DGAPA IN 217320 awarded to R.M. R.J. M.-G. acknowledges fellowship from CONACyT to pursue graduate studies (no. 735296). The authors also recognize the valuable support of A. Pérez-Vásquez, Marisela Gutierrez, Rosa Isela del Villar, Nayeli López Balbiaux, Ramiro del Carmen, and Georgina Duarte from Facultad de Química. We are indebted to Dirección General de Cómputo y de Tecnologías de Información y Comunicación (DGTIC), UNAM, for the resources to carry out computational calculations through the Miztli supercomputing system (LANCAD-UNAM-DGTIC-313). R.B. and E.L. thank our collaborators in the field who consented to share their experiences as well as Laura Cortés Zarraga, Andrea Martínez Balleste, and Georgina Ortega Leite who provided access to the BADEPLAM data base and the digital resources of the Library of the Instituto de Biología.
Supporting Information Available
The Supporting Information is available free of charge at https://pubs.acs.org/doi/10.1021/acsomega.2c00595.
Graphics of the hypoglycemic test and OSTT of PGD; LC chromatograms of the CHCl3 extracts (CE1; A) and (CE2; B); NMR spectra for compounds 2–6; graphics of OCR and ECAR for compounds 2, 3, and 6; and results of the UPLC-APCI-MS method validation (PDF)
Author Contributions
This work was taken from the PhD thesis of R.J.M.-G. submitted to Posgrado en Ciencias Químicas, UNAM. R.J.M.-G. carried out most of the experimental work, participated in valuable discussions, and contributed to the writing of the manuscript. R.M. and B.O. conceived the study, participated in its design and coordination, and helped in a great deal to draft the manuscript. R.B. and E.L. participated in the project’s initial planning, conducted field and ethnobotanical research, contributed to the botanical literature review and photographs, and wrote the ethnobotanical text. I.R.-C. designed and directed the validation procedures. L.N. carried out and interpreted the bioenergetic experiments and contributed to the writing of this part of the manuscript. C.T.-P. performed the insulin secretion experiments and participated in the corresponding discussion. All authors read and approved the final manuscript.
The authors declare no competing financial interest.
Supplementary Material
References
- Wilcox G. A Review: Insulin and insulin resistance. Clin. Biochem. Rev. 2005, 26, 19–37. [PMC free article] [PubMed] [Google Scholar]
- International Diabetes Federation. IDF Diabetes Atlas, 10th ed.; International Federation of Diabetes: Brussels, Belgium, 2021. [Google Scholar]
- Cheng A. Y. Y.; Fantus G. Oral antihyperglycemic therapy for type 2 diabetes mellitus. Can. Med. Assoc. J. 2005, 172, 213–226. 10.1503/cmaj.1031414. [DOI] [PMC free article] [PubMed] [Google Scholar]
- Estadísticas a propósito del día mundial de la diabetes, INEGI Instituto Nacional de Estadística y Geografía, Mexico, 2021.
- Escandón S. M.; Mata R.; Andrade-Cetto A. Molecules isolated from Mexican hypoglycemic plants. Molecules 2020, 25, 4145. 10.3390/molecules25184145. [DOI] [PMC free article] [PubMed] [Google Scholar]
- Mata R.; Figueroa M.; Navarrete A.; Rivero-Cruz I. Chemistry and biology of selected Mexican medicinal plants. Prog. Chem. Org. Nat. Prod. 2019, 108, 1–142. 10.1007/978-3-030-01099-7_1. [DOI] [PubMed] [Google Scholar]
- Sánchez-Salas J.; Flores-Rivas J.; Muro-Pérez G.; Martínez-Adriano C. El reinado desconocido de Peniocereus greggii. Bol. Soc. Latin. Carib. Cact. Suc. 2009, 6, 21–24. [Google Scholar]
- Castetter E. F.; Underhill R. M.. The ethnobiology of the Papago Indians. Ethnobiological studies in the American Southwest, 2nd ed.; University of New Mexico Press: Nuevo Mexico, 1935; pp 1–84. [Google Scholar]
- Curtin L. S. M.By the prophet of the earth, 1st ed.; San Vicente Foundation, Rydal Press: Santa Fe, 1949; p 158. [Google Scholar]
- Hicks S.Desert plants and people, 1st ed.; Naylor Company Press: San Antonio, TX, 1966, p 75. [Google Scholar]
- Hrdlicka A.Physiological and medical observations among the Indians of Southwestern United States and Northern Mexico; Smithsonian Institution, Bureau of American Ethnology Bulletin, Washington Government Press: Virginia, 1908; pp 1–460. [Google Scholar]
- Murphey E. V. A.Indian uses of native plants; Fort Bragg, Mendocino County Historical Society: California, 1959, p 72. [Google Scholar]
- Rea A. M.At the desert’s green edge – An ethnobotany of the Gila River Pima; University of Arizona Press: Arizona, 1997; p 430. [Google Scholar]
- Standley P. C.Trees and shrubs of Mexico. Contributions from the United States National Herbarium; Washington Government Press: Washington, 1920–1926; pp 1–1721. [Google Scholar]
- White S. S. The vegetation and flora of the region of the Río de Bavispe in northeastern Sonora, Mexico. Lloydia J. Biol. Sci. 1948, 23, 1–1721. [Google Scholar]
- Ingram M.; Nabhan G.; Buchmann S.. Our forgotten pollinators: protecting the birds and bees. Pesticide impacts on beneficial organisms; 1996, 6, 1–12. [Google Scholar]
- Cortés-Vega C. M.; Sánchez-Pérez J. C.; Alvarado-Rodríguez M. Establecimiento de un sistema de micropropagación de Peniocereus greggii (Engelml) Britton & Rose, especia cactácea en peligro de extinción. Revista Investigación Científica 2008, 4, 1–7. [Google Scholar]
- Muro P. G.; Sánchez S. J.; Estrada C. E.; García P. M. Peniocereus greggii variety greggii (Cactaceae) in Durango, Mexico. Southwest. Nat. 2012, 57, 337–338. 10.1894/0038-4909-57.3.335. [DOI] [Google Scholar]
- Raguso R. A.; Henzel C.; Buchmann S. L.; Nabhan G. P. Trumpet flowers of the Sonoran Desert: floral biology of Peniocereus cacti and sacred Datura. Int. J. Plant Sci. 2003, 164, 877–892. 10.1086/378539. [DOI] [Google Scholar]
- Knight J. C.; Pettit G. R. Arizona flora: The sterols of Peniocereus greggii. Phytochemistry 1969, 8, 447–482. 10.1016/S0031-9422(00)85451-5. [DOI] [Google Scholar]
- Lorke D. A new approach to practical acute toxicity testing. Arch. Toxicol. 1983, 54, 275–287. 10.1007/BF01234480. [DOI] [PubMed] [Google Scholar]
- Rix I.; Nexoe-Larse C.; Bergmann N.; Lund A.; Knop F.. Glucagon physiology. NCBI Bookshelf. A service of National Library of Medicine; National Institutes of Health, 2019, pp 1–15. [Google Scholar]
- Flack H. D. On enantiomorph -polarity estimation. Acta Crystallogr., Sect. A: Found. Crystallogr. 1983, A39, 867–881. 10.1107/S0108767383001762. [DOI] [Google Scholar]
- Knight J. C.; Wilkinson D. J.; Djerassi C. The structure of the cactus sterol macdougallin (14α-Methyl-Δ8-cholestene-3β,6α-diol). A novel link in sterol biogenesis. J. Am. Chem. Soc. 1966, 88, 790–798. 10.1021/ja00956a035. [DOI] [Google Scholar]
- Csábia J.; Hsiehb T. J.; Hasanpour F.; Martins A.; Kele Z.; Gátic T.; Simon A.; Tóth G.; Hunyadi A. Oxidized metabolites of 20-hydroxyecdysone and their activity on skeletal muscle cells: preparation of a pair of desmotropes with opposite bioactivities. J. Nat. Prod. 2015, 78, 2339–2345. 10.1021/acs.jnatprod.5b00249. [DOI] [PubMed] [Google Scholar]
- Issaadi H. M.; Tsai Y. C.; Chang F. R.; Hunyadi A. Centrifugal partition chromatography in the isolation of minor ecdysteroids from Cyanotis arachnoidea. J. Chromatogr. B: Anal. Technol. Biomed. Life Sci. 2017, 1054, 44–49. 10.1016/j.jchromb.2017.03.043. [DOI] [PubMed] [Google Scholar]
- Canonica L.; Danieli B.; Ferrari G.; Krepinsky J.; Rainoldi G. Structure of calonysterone, an unusually modified phytoecdysone. J. Chem. Soc., Chem. Commun. 1973, 19, 737–738. 10.1039/C39730000737. [DOI] [Google Scholar]
- Issaadi H. M.; Csábia J.; Hsiehb T. J.; Gátic T.; Tóth G.; Hunyadi A. Side-chains cleaved phytoecdysteroid metabolites as activators of protein kinase B. Bioorg. Chem. 2019, 82, 405–413. 10.1016/j.bioorg.2018.10.049. [DOI] [PubMed] [Google Scholar]
- Wilson W. K.; Stumpter R. M.; Warren J. J.; Rogers P. S.; Ruan B.; Schroepfer J. Jr. Analysis of unsaturated C27 sterols by nuclear magnetic resonance spectroscopy. J. Lipid Res. 1996, 37, 1529–1555. 10.1016/S0022-2275(20)39137-9. [DOI] [PubMed] [Google Scholar]
- Jayasuriya H.; Herath K. B.; Ondeyka J. G.; Guan Z.; Borris R. P.; Tiwari S.; de Jong W.; Chavez F.; Moss J.; Stevenson D. W.; Beck H. T.; Slattery M.; Schulman N. Z. M.; Ali A.; Sharma N.; MacNaul K.; Hayes N.; Menke J. G.; Singh S. B. Diterpenoid, steroid, and triterpenoid agonists of liver x receptors from diversified terrestrial plants and marine sources. J. Nat. Prod. 2005, 68, 1247–1252. 10.1021/np050182g. [DOI] [PubMed] [Google Scholar]
- Dinan L. Review phytoecdysteroids: biological aspects. Phytochemistry 2001, 57, 325–339. 10.1016/S0031-9422(01)00078-4. [DOI] [PubMed] [Google Scholar]
- Suttiarporn P.; Chumpolsri W.; Mahatheeranont S.; Luangkamin S.; Teepsawang S.; Leardkamolkarn V. Structures of phytosterols and triterpenoids with potential anti-cancer activity in bran of black non-glutinous rice. Nutrients 2015, 7, 1672–1687. 10.3390/nu7031672. [DOI] [PMC free article] [PubMed] [Google Scholar]
- Srivastava A. K.; Bajpai P.; Jain A.. Insulin action; post-receptor mechanisms. Encyclopedia of endocrine diseases, 2nd ed., vol 1; pp 100–104.
- Rena G.; Hardie D. G.; Pearson E. R. The mechanisms of action of metformin. Diabetologia 2017, 60, 1577–1585. 10.1007/s00125-017-4342-z. [DOI] [PMC free article] [PubMed] [Google Scholar]
- Delle R. J. B.; Kim J.; Suresh P.; London E.; Miller W. T. Sterol structure dependence of insulin receptor and insulin-like growth factor 1 receptor activation. Biochim. Biophys. Acta, Biomembr. 2019, 1861, 819–826. 10.1016/j.bbamem.2019.01.009. [DOI] [PMC free article] [PubMed] [Google Scholar]
- Jakovljevic N. K.; Pavlovic K.; Jotic A.; Lalic K.; Stoiljkovic M.; Lukic L.; Milicic T.; Macesic M.; Stanarcic-Gajovic J.; Lalic N. M. Targeting mitochondria in diabetes. Int. J. Mol. Sci. 2021, 22, 6642. 10.3390/ijms22126642. [DOI] [PMC free article] [PubMed] [Google Scholar]
- Schmidt C. A.; Fisher-Wellman K. H.; Darrell N. P. Review: From OCR and ECAR to energy: Perspectives on the design and interpretation of bioenergetics studies. J. Biol. Chem. 2021, 297, 1–22. 10.1016/j.jbc.2021.101140. [DOI] [PMC free article] [PubMed] [Google Scholar]
- Jastronch M.; Divakaruni A. S.; Mookerjee S.; Treberg J. R.; Brand M. D. Mitochondrial proton and electron leaks. Essays Biochem. 2010, 47, 53–67. 10.1042/bse0470053. [DOI] [PMC free article] [PubMed] [Google Scholar]
- Harper M. E.; Green K.; Brand M. D. The efficiency of cellular energy transduction and its implications for obesity. Annu. Rev. Nutr. 2008, 28, 13–33. 10.1146/annurev.nutr.28.061807.155357. [DOI] [PubMed] [Google Scholar]
- International Council for Harmonisation (ICH). Harmonised tripartite guideline. 2015. Validation of analytical procedures: text and methodology Q2(R1). Step 4 version, 1-13.
- Bruhn T.; Schaumlöffel A.; Hemberger Y.; Pescitelli G.. SpecDis, version 1.71; JIMDO: Berlin, Germany, 2017, http://specdissoftware.jimdo.com. [Google Scholar]
- Ovalle-Magallanes B.; Medina-Campos O.; Pedraza-Chaverri J.; Mata R. Hypoglycemic and antihyperglycemic effects of phytopreparations and limonoids from Swietenia humilis. Phytochemistry 2015, 110, 111–119. 10.1016/j.phytochem.2014.11.004. [DOI] [PubMed] [Google Scholar]
- Ventura-Sobrevilla J.; Boone-Villa V. D.; Aguilar C. N.; Román-Ramos R.; Vega-Ávila E.; Campos-Sepúlveda E.; Alarcón-Aguilar F. Effect of varying dose and administration of streptozotocin on blood sugar in male CD1 mice. Proc. West Pharmacol. Soc. 2011, 54, 5–9. [PubMed] [Google Scholar]
- Lozano-González M.; Ovalle-Magallanes B.; Rangel-Grimaldo M.; Torre-Zavala S.; Noriega L. G.; Tovar-Palacio C.; Tovar A. R.; Mata R. Antidiabetic in vitro and in vivo evaluation of cyclodipeptides isolated from Pseudomonas fluorescens IB-MR-66e. New J. Chem. 2019, 43, 7756–7762. 10.1039/C9NJ00645A. [DOI] [Google Scholar]
- Ovalle-Magallanes B.; Navarrete A.; Haddad P. S.; Tovar A.; Noriega L. G.; Tovar-Palacios C.; Mata R. Multi-target antidiabetic of mexicanolides from Swietenia humilis. Phytomedicine 2019, 58, 152891 10.1016/j.phymed.2019.152891. [DOI] [PubMed] [Google Scholar]
- Palacio-González B.; Zarain-Herzberg A.; Flores-Galicia I.; Noriega L. G.; Alemán-Escondrillas G.; Zariñan T.; Ulloa-Aguirre A.; Torres N.; Tovar A. R. Genistein stimulates fatty acid oxidation in a leptin receptor-independent manner through the JAK2-mediated phosphorylation and activation of AMPK in skeletal muscle. Biochim. Biophys. Acta 2014, 1841, 132–140. 10.1016/j.bbalip.2013.08.018. [DOI] [PubMed] [Google Scholar]
Associated Data
This section collects any data citations, data availability statements, or supplementary materials included in this article.


