

Key Points
Question
What is the range of conditions associated with hereditary cancer genes?
Findings
This phenome-wide association study used genetic and phenotypic data derived from health-related data from electronic health records in 3 cohorts comprising 214 020 participants to identify 19 new diseases and conditions associated with pathogenic variants in 13 hereditary cancer genes. These new phenotypes included both neoplastic and nonneoplastic diseases.
Meaning
These findings contribute to recognition and understanding of the full clinical spectrum of hereditary cancer syndromes, which can facilitate early detection of cancers and better management.
This phenome-wide association study uses phenotypic data derived from health records in 3 cohorts to investigate a broad range of phenotypes associated with hereditary cancer genes.
Abstract
Importance
Knowledge about the spectrum of diseases associated with hereditary cancer syndromes may improve disease diagnosis and management for patients and help to identify high-risk individuals.
Objective
To identify phenotypes associated with hereditary cancer genes through a phenome-wide association study.
Design, Setting, and Participants
This phenome-wide association study used health data from participants in 3 cohorts. The Electronic Medical Records and Genomics Sequencing (eMERGEseq) data set recruited predominantly healthy individuals from 10 US medical centers from July 16, 2016, through February 18, 2018, with a mean follow-up through electronic health records (EHRs) of 12.7 (7.4) years. The UK Biobank (UKB) cohort recruited participants from March 15, 2006, through August 1, 2010, with a mean (SD) follow-up of 12.4 (1.0) years. The Hereditary Cancer Registry (HCR) recruited patients undergoing clinical genetic testing at Vanderbilt University Medical Center from May 1, 2012, through December 31, 2019, with a mean (SD) follow-up through EHRs of 8.8 (6.5) years.
Exposures
Germline variants in 23 hereditary cancer genes. Pathogenic and likely pathogenic variants for each gene were aggregated for association analyses.
Main Outcomes and Measures
Phenotypes in the eMERGEseq and HCR cohorts were derived from the linked EHRs. Phenotypes in UKB were from multiple sources of health-related data.
Results
A total of 214 020 participants were identified, including 23 544 in eMERGEseq cohort (mean [SD] age, 47.8 [23.7] years; 12 611 women [53.6%]), 187 234 in the UKB cohort (mean [SD] age, 56.7 [8.1] years; 104 055 [55.6%] women), and 3242 in the HCR cohort (mean [SD] age, 52.5 [15.5] years; 2851 [87.9%] women). All 38 established gene-cancer associations were replicated, and 19 new associations were identified. These included the following 7 associations with neoplasms: CHEK2 with leukemia (odds ratio [OR], 3.81 [95% CI, 2.64-5.48]) and plasma cell neoplasms (OR, 3.12 [95% CI, 1.84-5.28]), ATM with gastric cancer (OR, 4.27 [95% CI, 2.35-7.44]) and pancreatic cancer (OR, 4.44 [95% CI, 2.66-7.40]), MUTYH (biallelic) with kidney cancer (OR, 32.28 [95% CI, 6.40-162.73]), MSH6 with bladder cancer (OR, 5.63 [95% CI, 2.75-11.49]), and APC with benign liver/intrahepatic bile duct tumors (OR, 52.01 [95% CI, 14.29-189.29]). The remaining 12 associations with nonneoplastic diseases included BRCA1/2 with ovarian cysts (OR, 3.15 [95% CI, 2.22-4.46] and 3.12 [95% CI, 2.36-4.12], respectively), MEN1 with acute pancreatitis (OR, 33.45 [95% CI, 9.25-121.02]), APC with gastritis and duodenitis (OR, 4.66 [95% CI, 2.61-8.33]), and PTEN with chronic gastritis (OR, 15.68 [95% CI, 6.01-40.92]).
Conclusions and Relevance
The findings of this genetic association study analyzing the EHRs of 3 large cohorts suggest that these new phenotypes associated with hereditary cancer genes may facilitate early detection and better management of cancers. This study highlights the potential benefits of using EHR data in genomic medicine.
Introduction
Understanding the phenotypic consequences of genomic variation is critical to genomic medicine. Uncovering gene-phenotype associations facilitates clinical diagnoses, leads to better treatment, improves prognosis, and provides insights into disease etiology and potential therapeutic targets.1,2 The application of next-generation sequencing has markedly accelerated the discovery of novel mendelian disease genes and has expanded our knowledge of their characteristic phenotypes. These are epitomized by hereditary cancer genes. Their associated phenotypes have been shown to extend beyond predisposition to cancer.3,4,5,6 However, substantial gaps in knowledge about the spectrum of phenotypes have been noted,7 suggesting the need for infrastructure and resources to systematically assess gene-phenotype associations.7,8
Current approaches to uncover phenotypes include family-based and population-based studies,9,10,11,12,13,14 most of which focused on 1 gene and/or 1 trait or similar traits. These studies have fundamentally improved our understanding of diseases and laid foundations for precision medicine.2 Systematic efforts to collect information on gene-phenotype associations include the Online Mendelian Inheritance in Man (OMIM), which curates knowledge through literature review with decades of efforts.15,16
In this study, we hypothesize that additional conditions are associated with hereditary cancer genes. Using an alternative approach, namely, the phenome-wide association study (PheWAS),17,18 we used the phenotypic data derived from health record data from 3 cohorts, totaling 214 020 participants, to investigate a broad range of phenotypes associated with hereditary cancer genes.
Methods
Two clinical site–based cohorts and 1 population-based prospective cohort were included in this PheWAS. All US-based studies were approved by local institutional review boards, and the UK-based study was approved by relevant research ethics committees and organizations. Details are provided in eMethods in the Supplement. All participants provided written informed consent according to approved protocols. This study followed the Strengthening the Reporting of Genetic Association Studies (STREGA) guideline.
Study Populations
The Electronic Medical Records and Genomics Sequencing (eMERGEseq) cohort consisted of 24 956 biobank and prospectively recruited predominantly healthy individuals from 10 clinical sites under the eMERGE network from July 16, 2016, through February 18, 2018.19 The primary goal of this project was to provide clinical genetic testing and return actionable genetic results to patients.20 A total of 52% of the participants were unselected and mainly recruited from primary care clinics or identified from biobanks without specific indications, with the others recruited from specific clinics depending on site-specific interests.19 A detailed description of each site, including enrollment criteria, specific research interest, and enrichment of phenotypes is provided in eMethods in the Supplement. For this study, we removed individuals without International Classification of Diseases, Ninth Revision, Clinical Modification (ICD-9-CM), or International Statistical Classification of Diseases and Related Health Problems, Tenth Revision, Clinical Modification (ICD-10-CM), codes in the electronic health records (EHRs). A total of 23 544 individuals were retained for analysis.
The Hereditary Cancer Registry (HCR) at Vanderbilt University Medical Center included all 3794 individuals who received clinical genetic testing for hereditary cancer21 from May 1, 2012, through December 31, 2019, and who agreed to and consented to be included in this registry. Results of genetic testing were documented in the EHRs. We obtained the EHR data of 3739 individuals through the Research Derivative, a database of clinical and related data derived from EHR systems.22 Through reviewing clinical records in the HCR, we removed patients who were also participants of the eMERGEseq project (n = 14) and family members of the index patients who were enrolled in the registry owing to cascade testing (n = 483). A total of 3242 patients were retained for analyses.
The UK Biobank (UKB) is a prospective population-based cohort of 500 217 participants recruited from March 15, 2006, through August 1, 2010, who are continuously followed up.23 We included 200 619 participants with whole-exome sequencing data available at the time of this study. After removing related participants (n = 5007) and those without ICD-9 and ICD-10 codes (n = 8378), 187 234 participants were included.
Sequencing and Variant Classification
Germline variant data in the eMERGEseq cohort were obtained from targeted sequencing. Details on the design of the sequencing panel have been described previously.19 Briefly, this panel consists of a total of 109 genes, including 58 genes from the American College of Medical Genetics and Genomics [ACMG]) actionable finding list and 51 genes nominated by participating sites.24 The full list of these genes is provided in eTable 1 in the Supplement. Among the 58 genes from the ACMG panel, we selected all genes (n = 25) determined to be associated with cancer phenotypes by the ACMG Secondary Findings Working Group.24,25 These genes were APC (OMIM 611731), BMPR1A (OMIM 601299), BRCA1 (OMIM 113705), BRCA2 (OMIM 600185), MEN1 (OMIM 613733), MLH1 (OMIM 120436), MSH2 (OMIM 609309), MSH6 (OMIM 600678), MUTYH (OMIM 604933), NF2 (OMIM 607379), PMS2 (OMIM 600259), PTEN (OMIM 601728), RB1 (OMIM 614041), RET (OMIM 164761), SDHAF2 (OMIM 613019), SDHB (OMIM 185470), SDHC (OMIM 602413), SDHD (OMIM 602690), SMAD4 (OMIM 600993), STK11 (OMIM 602690), TP53 (OMIM 191170), TSC1 (OMIM 605284), TSC2 (OMIM 191092), VHL (OMIM 608537), and WT1 (OMIM 607102). We also included genes related to cancer phenotypes determined by field experts in the eMERGE network from genes selected by participant sites. These genes were ATM (OMIM 607585), BLM (OMIM 604610), CHEK2 (OMIM 604373), PALB2 (OMIM 610355), POLD1 (OMIM 174761), and POLE (OMIM 174762). Clinical genetic testing for patients in the HCR was performed by commercial Clinical Laboratory Improvement Amendments (CLIA)– and College of American Pathologists (CAP)–accredited molecular diagnostic laboratories. Results from CLIA- and CAP-accredited laboratories were considered highly accurate.26 Germline variant data in UKB were obtained by whole-exome sequencing data through the UKB data center as described elsewhere.27
Variant classification in eMERGEseq was performed by 2 CLIA- and CAP-accredited laboratories according to ACMG and Association for Medical Pathology guidelines with modifications by experts as previously described.19 Variant classification in the HCR was performed by commercial CLIA- and CAP-accredited molecular genetic testing laboratories.26 Variant classification in the UKB was performed according to the ACMG and ClinGen guidelines.19 With the exception of APCI1307K, which was classified as a risk allele, all detected variants were classified into pathogenic, likely pathogenic, variant of uncertain significance, likely benign, and benign. We compared results of shared variants and made the classifications identical across all studies according to the aforementioned guidelines. Details are described in eMethods in the Supplement.
For each gene, we defined patients with pathogenic and likely pathogenic variants as carriers and patients with no rare variants or only benign or likely benign variants as noncarriers, and patients with variants of uncertain significance as carriers of these variants. Only genes with at least 10 carriers in all cohorts combined were included. For MUTYH, only biallelic variant carriers were considered. The frequency of carriers in each cohort was consistent with that in previous studies with similar settings.28,29,30,31,32,33,34,35,36
PheWAS Phenotypes
In the eMERGEseq and HCR cohorts, we extracted the ICD-9-CM and ICD-10-CM data from linked EHRs. The validity of this EHR-based PheWAS approach has been demonstrated in previous studies.35,37,38,39,40,41,42,43 In the UKB, we extracted ICD-9 and ICD-10 data from the harmonized health outcome data derived from cancer and death registries, inpatient medical records, and self-reported health outcomes.23 Details on the clinical data linkage and standardized questionnaires and interviews have been described previously.23 Specifically, self-reported cancer diagnoses were validated against data from cancer registries and mapped to ICD-10 codes. Noncancer self-reported health outcomes were also mapped to ICD-10 codes if applicable. Dates of first occurrence of diseases were also extracted. We mapped all ICD codes to phecodes to define the phenotypes for the PheWAS.17,18,44 Details are provided in eMethods in the Supplement. A total of 3483 unique phecodes were derived from the eMERGEseq data set; 2853, from the HCR data set; and 2693, from the UKB data set. These phecodes covered 15 categories of diseases and conditions, including congenital, cardiovascular, dermatologic, developmental, digestive, endocrine, hematopoietic, infectious, neoplastic, pregnant, psychiatric, pulmonary, genitourinary, musculoskeletal, and symptoms and/or signs.
Statistical Analysis
Statistical analysis was conducted from April 2020 to October 2021. We performed gene-level association tests by collapsing pathogenic and likely pathogenic variants in the same gene. We removed participants with variants of uncertain significance in the same gene from analyses. Each gene-phenotype association was tested independently using the Firth logistic regression.45,46 In the eMERGEseq cohort, we adjusted for age, EHR length in years, sites, the first 4 principal components, and sex if applicable. In the HCR cohort, we adjusted for age, EHR length in years, self-reported race, and sex if applicable. In the UKB cohort, we adjusted for age, length of follow-up in years, sites, the first 16 principal components suggested by Privé et al,47 and sex if applicable. The race variable (defined by principal components or self-reported) was included to account for population stratifications. Analyses were performed assuming an autosomal dominant inheritance for all genes except MUTYH, for which an autosomal recessive inheritance was assumed, according to their inheritance patterns as hereditary cancer genes documented in the OMIM database,15 the comprehensive, authoritative collection of gene-phenotype correlations. The association of monoallelic MUTYH variants with cancer remains inconclusive48; therefore, we did not perform analyses for these carriers. All populations were included. The number of phenotypes evaluated in each cohort is presented in eFigure 1 in the Supplement. We only considered associations found in at least 2 of the 3 studies with the same direction of effect. Meta-analyses were performed assuming a fixed-effect model. We defined 2.5 × 10⁻⁵ as the empirical phenome-wide significance threshold at a significance level of α = .05 through permutations (eFigure 2 and eMethods in the Supplement). All statistical analyses were performed using R, version 4.0.1 (R Project for Statistical Computing). Figure 2 was produced by the R package gganatogram,49 which uses the tissue coordinates from the Expression Atlas.50
We categorized all gene associations into 3 groups: known or primary associations as documented in the OMIM database, associations related to known phenotypes (eg, elevated cancer antigen 125 for BRCA1/2), and potentially new associations. We considered that a known phenotype-gene association was replicated in our analysis if the PheWAS had a P < .05 with the expected direction of the effect. Details are described in eMethods in the Supplement.
Sensitivity Analysis
We conducted several sensitivity analyses to test the robustness of the new associations. First, we tested associations limiting the individuals to those with European ancestry. For the eMERGEseq and UKB cohorts, we also derived ancestral specific principal components from genetic data as additional covariates. Second, to investigate whether associations with noncancer phenotypes were associated with prior cancer diagnoses, we restricted analyses to those without any cancer diagnoses (excluding basal cell carcinomas) before enrollment. We used the UKB data set because dates of cancer diagnoses were ascertained through cancer registries. Second, to investigate whether the observed associations between CHEK2 and hematological malignant neoplasms were associated with prior cancer diagnoses, we restricted analyses to those without cancer diagnoses before blood sampling in the UKB data set. In addition, we conducted another analysis by removing participants with any cancer diagnosis within 3 years after blood sampling. Third, to investigate whether the observed CHEK2 and leukemia association differed by subtypes, we evaluated associations of CHEK2 with subtypes of leukemia. Finally, we compared association results of BRCA1 with BRCA2 found in this PheWAS.
EHR Reviews
We conducted EHR reviews for participants with readily accessible EHRs at Vanderbilt University Medical Center to gather more information about diagnoses related to new associations. We verified diagnoses by reviewing pathology reports, radiology imaging results, and clinical narratives.
Results
We included 214 020 participants from the 3 cohorts. Baseline demographic characteristics and the follow-up time for each cohort are summarized in eTable 2 in the Supplement. Participants in the eMERGEseq cohort (n = 23 544) had a mean (SD) age of 47.8 (23.7) years with a mean (SD) follow-up of 12.7 (7.4) years; 5145 (21.9%) had non-European ancestry, 12 611 (53.6%) were women, and 10 933 (46.4%) were men. The HCR cohort (n = 3242) had a mean (SD) age of 52.5 (15.5) years with a mean (SD) follow-up of 8.8 (6.5) years; 413 (12.7%) had non-European ancestry, 2851 (87.9%) were women, and 391 (12.1%) were men. The UKB cohort (n = 187 234) had a mean (SD) age at recruitment of 56.7 (8.1) years with a mean (SD) follow-up time of 12.4 (1.0) years; 11 293 (6.0%) had non-European ancestry; 104 055 (55.6%) were women and 83 179 (44.4%) were men. The distribution of carriers for each gene is summarized in Table 1. A total of 858 carriers were identified in the eMERGEseq cohort; 434, in the HCR cohort; and 5223 in the UKB cohort. The distribution of carriers for each gene by ancestral group is summarized in eTable 3 in the Supplement.
Table 1. Number of Carriers and Noncarriers in the eMERGEseq, HCR, and UKB Cohorts.
| Gene | eMERGEseq cohort (n = 23 544) | HCR cohort (n = 3242) | UKB cohort (n = 187 234) | ||||||
|---|---|---|---|---|---|---|---|---|---|
| No. of carriers | No. of noncarriers | Carriers, % | No. of carriers | No. of noncarriers | Carriers, % | No. of carriers | No. of noncarriers | Carriers, % | |
| APC | 14 | 21 903 | 0.06 | 22 | 1931 | 1.09 | 28 | 175 664 | 0.01 |
| ATM | 82 | 21 863 | 0.34 | 29 | 2309 | 1.18 | 1189 | 153 496 | 0.64 |
| BRCA1 | 82 | 23 012 | 0.34 | 92 | 2705 | 3.25 | 211 | 182 128 | 0.11 |
| BRCA2 | 138 | 22 325 | 0.58 | 91 | 2658 | 3.22 | 609 | 178 147 | 0.33 |
| CHEK2 | 272 | 22 697 | 1.10 | 45 | 2393 | 1.81 | 1721 | 179 702 | 0.92 |
| MEN1 | 2 | 23 269 | 0.01 | 10 | 637 | 1.53 | 7 | 183 949 | 0.004 |
| MLH1 | 14 | 23 214 | 0.06 | 15 | 2371 | 0.62 | 78 | 180 268 | 0.04 |
| MSH2 | 16 | 22 361 | 0.06 | 24 | 2347 | 0.99 | 249 | 177 007 | 0.13 |
| MSH6 | 50 | 22 634 | 0.21 | 16 | 2346 | 0.67 | 202 | 177 955 | 0.11 |
| MUTYH (biallelic) | 4 | 22 436 | 0.02 | 3 | 2113 | 0.14 | 29 | 182 552 | 0.02 |
| PALB2 | 28 | 22 925 | 0.13 | 30 | 2391 | 1.22 | 367 | 181 218 | 0.20 |
| PMS2 | 54 | 22 300 | 0.23 | 17 | 2326 | 0.71 | 283 | 185 524 | 0.15 |
| PTEN | 13 | 23 184 | 0.06 | 3 | 2518 | 0.12 | 26 | 183 442 | 0.01 |
| RB1 | 2 | 23 105 | 0.01 | 6 | 280 | 2.08 | 8 | 174 527 | 0.004 |
| RET | 34 | 22 745 | 0.14 | 10 | 370 | 2.58 | 35 | 176 515 | 0.02 |
| SDHB | 6 | 23 397 | 0.02 | 4 | 659 | 0.60 | 22 | 183 041 | 0.01 |
| SDHC | 6 | 23 340 | 0.02 | 0 | 704 | 0 | 27 | 179 271 | 0.01 |
| SDHD | 4 | 23 435 | 0.02 | 5 | 653 | 0.76 | 21 | 185 466 | 0.01 |
| TP53 | 12 | 23 336 | 0.06 | 4 | 2557 | 0.15 | 28 | 183 238 | 0.01 |
| TSC1 | 5 | 22 792 | 0.02 | 0 | 690 | 0 | 33 | 174 326 | 0.02 |
| TSC2 | 12 | 21 598 | 0.05 | 0 | 680 | 0 | 23 | 183 078 | 0.01 |
| VHL | 5 | 23 329 | 0.02 | 8 | 872 | 0.90 | 16 | 184 649 | 0.01 |
| WT1 | 3 | 23 215 | 0.01 | 0 | 241 | 0 | 11 | 186 298 | 0.01 |
Abbreviations: eMERGEseq, Electronic Medical Records and Genomics Sequencing; HCR, hereditary cancer registry; UKB, UK Biobank.
We first assessed whether the PheWAS could replicate known gene-phenotype associations. Our PheWAS replicated 38 of 38 primary gene-cancer associations (100%) and 164 of 235 gene-phenotype associations (69.8%) documented in OMIM, which reports diseases and symptoms associated with the genes (Figure 1 and eTable 4 in the Supplement). The probability of replicating associations in at least 164 of 235 tests by chance, under the null hypothesis of no association, is P = 2.13 × 10−154.
Figure 1. Phenome-Wide Association Study to Confirm Known Gene-Phenotype Associations and Uncover New Associations for Hereditary Cancer Genes.
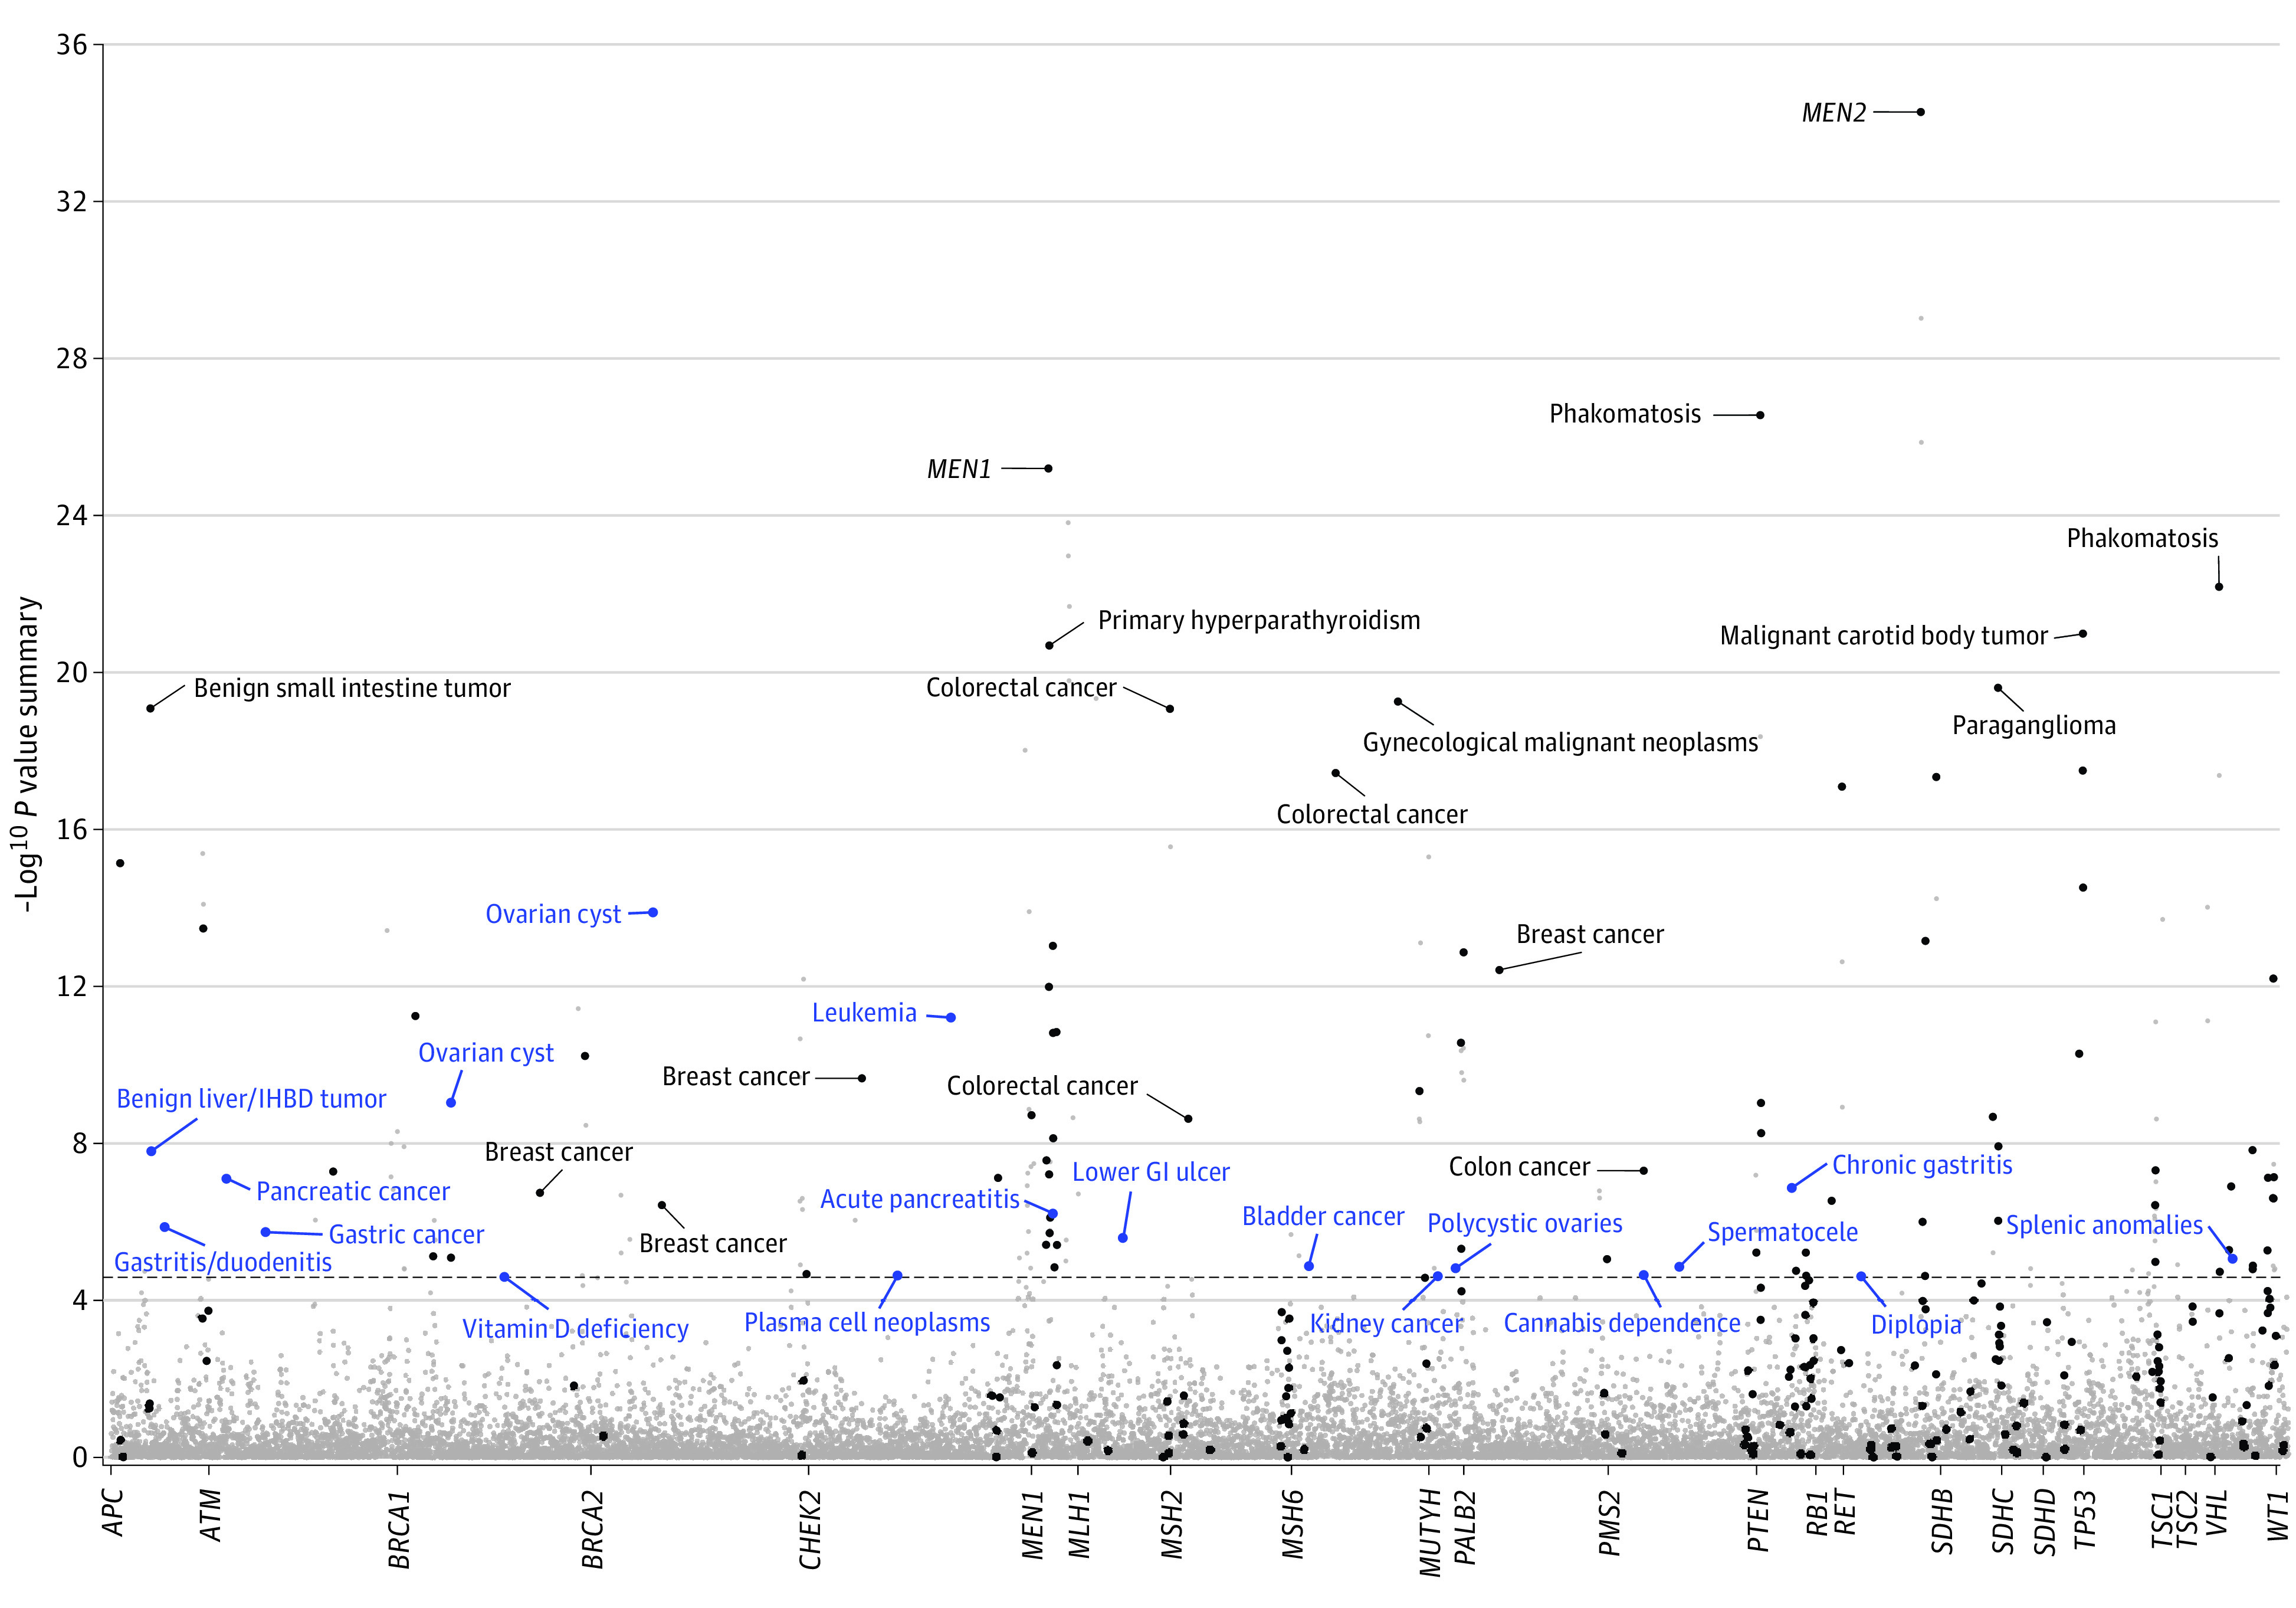
Meta-analysis results of phenome-wide association study in the Electronic Medical Records and Genomics Sequencing, Hereditary Cancer Registry, and UK Biobank data sets are shown. Strength of the association is plotted along the y-axis as −log10 P value summary, and phenotypes are represented on the x-axis, grouped by each gene. Black dots represent the known associated phenotypes. Labeled phenotypes with blue dots represent new gene-phenotype associations. The dashed line indicates P = 2.5 × 10⁻⁵, representing the empirical phenome-wide significance. GI indicates gastrointestinal tract; IHBD, intrahepatic bile duct; MEN1, multiple endocrine neoplasia syndrome type 1; and MEN2, multiple endocrine neoplasia syndrome type 2.
A total of 193 gene-phenotype associations exceeded the phenome-wide significance (P < 2.5 × 10⁻⁵). After removing known associations, 19 new associations that have not been documented in the OMIM database were found in 13 hereditary cancer genes (Table 2 and Figure 2). These consisted of 6 associations with malignant tumors, including CHEK2 with leukemia (odds ratio [OR], 3.81 [95% CI, 2.64-5.48]) and plasma cell neoplasms (OR, 3.12 [95% CI, 1.84-5.28]), ATM with gastric cancer (OR, 4.27 [95% CI, 2.35-7.44]) and pancreatic cancer (OR, 4.44 [95% CI, 2.66-7.40]), MUTYH (biallelic) with kidney cancer (OR, 32.28 [95% CI, 6.40-162.73]), MSH6 with bladder cancer (OR, 5.63 [95% CI, 2.75-11.49]), and an association of APC with benign liver/intrahepatic bile duct tumors (OR, 52.01 [95% CI, 14.29-189.29]). Ten genes were associated with nonneoplastic diseases (eg, BRCA1 [OR, 3.15 (95% CI, 2.22-4.46)] and BRCA2 [OR, 3.12 (95% CI, 2.36-4.12)] with ovarian cysts, MEN1 with acute pancreatitis [OR, 33.45 (95% CI, 9.25-121.02)], APC with gastritis and duodenitis [OR, 4.66 (95% CI, 2.61-8.33)], and PTEN with chronic gastritis [OR, 15.68 (95% CI, 6.01-40.92)]).
Table 2. New Associations Discovered via PheWASa.
| Gene | Phenotype | Cohort, OR (95% CI) | P value | |||||
|---|---|---|---|---|---|---|---|---|
| eMERGEseq | HCR | UKB | Meta-analysis | Summary | Het | |||
| Neoplastic diseases | ||||||||
| ATM | Pancreatic cancer | 2.54 (0.39-16.39) | 3.68 (0.77-17.52) | 4.79 (2.72-8.43) | 4.44 (2.66-7.40) | 7.88 × 10⁻⁸ | .79 | |
| ATM | Gastric cancer | 4.62 (0.61-34.79) | NA | 4.24 (2.27-7.90) | 4.27 (2.35-7.74) | 1.80 × 10⁻⁶ | .94 | |
| CHEK2 | Leukemia | 4.42 (2.18-8.94) | 5.04 (1.00-25.41) | 3.52 (2.26-5.47) | 3.81 (2.64-5.48) | 6.18 × 10⁻¹² | .81 | |
| CHEK2 | Plasma cell neoplasmsb | 2.66 (0.90-7.90) | NA | 3.28 (1.79-5.98) | 3.12 (1.84-5.28) | 2.30 × 10⁻⁵ | .74 | |
| MSH6 | Bladder cancer | 8.30 (2.33-29.54) | 18.98 (4.32-83.30) | 2.28 (0.79-6.61) | 5.63 (2.75-11.49) | 1.33 × 10⁻⁵ | .06 | |
| MUTYH | Kidney cancer | NA | 84.13 (8.47-836.11) | 12.57 (1.29-122.74) | 32.28 (6.40-162.73) | 2.50 × 10⁻⁵ | .25 | |
| APC | Benign liver/IHBD tumor | 61.01 (7.66-485.98) | 26.47 (3.48-201.34) | 146.80 (16.10-586.83) | 52.01 (14.29-189.29) | 1.57 × 10⁻⁸ | .62 | |
| Nonneoplastic diseases | ||||||||
| APC | Gastritis and duodenitis | 3.32 (0.98-11.25) | 9.43 (3.66-24.31) | 2.91 (1.16-7.29) | 4.66 (2.61-8.33) | 1.34 × 10⁻⁶ | .18 | |
| BRCA1 | Ovarian cyst | 5.91 (3.40-10.29) | 1.80 (1.05-3.07) | 2.94 (1.30-6.64) | 3.15 (2.22-4.46) | 9.09 × 10⁻¹⁰ | .01 | |
| BRCA1 | Vitamin D deficiency | 0.51 (0.28-0.93) | 0.17 (0.08-0.38) | 0.57 (0.34-0.97) | 0.43 (0.30-0.62) | 2.50 × 10⁻⁵ | .04 | |
| BRCA2 | Ovarian cyst | 4.07 (2.56-6.48) | 2.64 (1.56-4.46) | 2.72 (1.71-4.33) | 3.12 (2.36-4.12) | 1.29 × 10⁻¹⁴ | .37 | |
| MEN1 | Acute pancreatitis | 48.47 (3.07-765.51) | 27.26 (4.68-158.68) | 37.49 (2.86-490.91) | 33.45 (9.25-121.02) | 6.09 × 10⁻⁷ | .94 | |
| PTEN | Chronic gastritis | 3.84 (0.51-28.68) | 15.93 (1.30-194.97) | 26.06 (7.75-87.58) | 15.68 (6.01-40.92) | 1.35 × 10⁻⁷ | .28 | |
| MUTYH | Polycystic ovaries | 33.94 (2.30-501.28) | 53.76 (5.76-502.08) | NA | 44.57 (7.99-248.73) | 1.50 × 10⁻⁵ | .80 | |
| MLH1 | Lower GI ulcer | 26.8 (5.15-139.47) | 12.39 (1.98-77.46) | NA | 18.97 (5.57-64.67) | 2.50 × 10⁻⁵ | .54 | |
| PMS2 | Spermatocele | 20.48 (4.14-101.22) | 19.13 (1.51-242.84) | NA | 20.09 (5.19-77.7) | 1.38 × 10⁻⁵ | .96 | |
| PMS2 | Cannabis dependence | 15.68 (2.57-95.76) | 184.31 (12.71-2491.54) | NA | 29.34 (6.15-139.97) | 2.24 × 10⁻⁵ | .18 | |
| RET | Diplopia | 9.90 (3.04-32.23) | 7.99 (0.82-77.72) | NA | 9.46 (3.32-26.97) | 2.49 × 10⁻⁵ | .87 | |
| VHL | Splenic anomalies | 111.40 (6.60-1880.13) | 131.16 (4.97-3463.79) | NA | 119.45 (14.07-1014.39) | 1.17 × 10⁻⁵ | .94 | |
Abbreviations: eMERGEseq, Electronic Medical Records and Genomics Sequencing; GI, gastrointestinal tract; HCR, Hereditary Cancer Registry; IHBD, intrahepatic bile duct; NA, not applicable; OR, odds ratio; PheWAS, phenome-wide association study; UKB, UK Biobank.
We used Firth logistic regression in this PheWAS assuming a dominant model except for MUTYH, which assumed a recessive model. Owing to the scarceness of carriers of VHL and APC and a low prevalence of cannabis use in the HCR cohort, wide CIs were observed, and caution should be exercised when interpretating these results. NA indicates no phenotype was found among carriers for the gene in the cohort, and thus we were not able to evaluate the association. Results with a P < 2.5 × 10⁻⁵ with a consistent direction of effect in at least 2 cohorts are included.
Plasma cell neoplasms also include multiple myeloma.
Figure 2. New Gene-Phenotype Associations Uncovered by Phenome-Wide Association Study, Organized by Organs.

Organs labeled blue represent neoplastic sites; organs labeled yellow represent nonneoplastic sites. GI indicates gastrointestinal tract, IHBD, intrahepatic bile duct.
All results of the sensitivity analyses were consistent with the main findings. Results of new associations remained largely unchanged in the analyses conducted in European descendants only (eTable 5 in the Supplement). After removing participants with prior cancer diagnoses, associations between BRCA1/2 and ovarian cyst, PTEN and chronic gastritis, and MEN1 with acute pancreatitis remained statistically significant (eTable 6 in the Supplement). For associations of CHEK2 with hematological cancers, removing participants with prior cancer diagnoses or even those with cancer diagnoses within 3 years after blood draw did not substantially change the associations (eTable 7 in the Supplement). No substantial differences were detected in the associations of CHEK2 with subtypes of leukemia (eTable 8 in the Supplement). No substantial differences in phenotypic associations between BRCA1 and BRCA2 were found (eTable 9 in the Supplement).
By reviewing EHRs of participants in the HCR cohort, we verified the diagnosis of renal cell carcinoma in the biallelic MUTYH variant carrier, which was consistent with the diagnosis of this cancer in the biallelic MUTYH variant carrier in the UKB cohort. We found a diagnosis of thyroid cancer in the RET carrier with diplopia. We also found that 7 of 20 BRCA1 carriers with ovarian cysts were diagnosed with ovarian cancer, whereas only 2 such diagnoses were found in BRCA2 carriers with ovarian cysts (2 of 24). However, the difference between BRCA1 and BRCA2 was not statistically significant (P = .06). We also did not find evidence that patients who were BRCA1/2 carriers with ovarian cysts were actually cases of ovarian cancer that had been missed. We did not find pancreatic cancer diagnoses among MEN1 carriers with acute pancreatitis.
Discussion
In this study, we demonstrate the feasibility of rapid phenotype discovery by the PheWAS approach by replicating most known associations documented in the OMIM that represented knowledge accumulated in decades. We identified 19 new gene-phenotype associations, which spanned categories of diseases, including the neoplastic, genitourinary, digestive, congenital, metabolic, psychiatric, and neurological categories, supporting our hypothesis that hereditary cancer syndromes are associated with multiple diseases.
This study revealed a novel gene-cancer association between biallelic MUTYH variants and kidney cancer. Although monogenic germline MUTYH pathogenic variants have been identified in patients with renal cell carcinoma,51 previous studies11,48 that used data from high-risk families and probands reported no occurrence of this cancer among biallelic MUTYH variant carriers but did report benign kidney lesions. Although few studies have investigated the role of MUTYH in kidney cancers, some mutation signatures of genomic instability have been found to be more common in these tumors than other solid tumors.52 Further molecular studies are needed to illuminate the observed association.
This study provides additional evidence for associations of cancers that have not been documented in the OMIM database but were reported in previous literature, including ATM with gastric and pancreatic cancer,53,54 MSH6 with bladder cancer,55 and CHEK2 with leukemia.56,57,58 Notably, a recent study59 suggested that loss of CHEK2 function increased the risk of clonal hematopoiesis of indeterminate potential, which was a risk factor for hematological malignant neoplasms.60 Furthermore, it was found that prior cancer therapies could increase the risk of clonal hematopoiesis of indeterminate potential.61 We observed that associations with leukemia or multiple myeloma persisted after removing participants with cancer diagnosed before and within 3 years of blood sampling. Nonetheless, we could not fully exclude the possibility that somatic variants of CHEK2 detected owing to clonal expansions contribute to the observed association. Future studies that include additional types of tissues can help exclude the somatic variants and validate the observed associations.
This study also revealed new noncancer associations that would have been difficult to detect in studies focusing on cancers or using prior knowledge.62 These phenotypes included inflammation-related disorders, which were consistent with previous findings.63,64 For example, a recent study63 identified an essential role of MEN1 in exocrine pancreas homeostasis in response to inflammation that contributes to pancreatitis in mouse models. A previous study65 suggested that MUTYH contributed to inflammatory-related disorders. We found that homozygous or compound heterozygous MUTYH carriers had an association with polycystic ovaries, for which chronic inflammation has been proposed to be a key contributor.66 We also found a Beçhet syndrome diagnosis in a MUTYH biallelic variant carrier in this study. Taken together, these findings provide supporting evidence for a role of MUTYH in inflammatory-related disorders.
Results of EHR review suggested that some of the noncancer phenotypes could be symptoms of underlying diseases that had been known. For example, the association of RET with diplopia was likely to be mediated by neuroendocrine disorders, including tumors. However, diplopia has been largely underreported in patients with multiple endocrine neoplasia type 2 in previous studies and thus has not been documented in the OMIM database. We believe that recognizing such relevant symptoms can be important for the management of multiple endocrine neoplasia type 2. Identification of symptoms such as these may also serve an early sign of underlying diseases such as cancers and thus facilitate early detection, as shown in previous studies.67,68
Owing to the small number of carriers identified for genes including MUTYH, VHL, and APC, additional studies are needed to validate the new associations identified in this study. A previous study69 suggested that BRCA1/2 could have a different role in diseases. However, we did not observe different associations in our PheWAS. Follow-up studies are needed to test this hypothesis.
Limitations
Limitations of this study include a relatively small sample size of populations of non-European descendants. This could potentially limit the generalizability of our findings to these populations, although we included them in analyses. We anticipate that large EHR-based cohorts including more diverse populations, such as the All of Us research program,70 will identify additional phenotypes associated with these genes and increase the generalizability of the findings to these understudied populations.
Conclusions
In this PheWAS of 3 cohorts using data derived from the EHRs of 214 020 participants, we studied a wide range of phenotypes associated with hereditary cancer genes. We identified 19 new gene-phenotype associations, including both neoplastic and nonneoplastic diseases. These findings suggest that PheWAS in EHR data sets has the potential to expand our knowledge of the phenotypes and disease processes in patients with pathogenic and likely pathogenic variants in hereditary cancer genes. New clinical management protocols could be developed based on these findings, so future research replicating these new associations will be important. Large EHR-based cohorts of diverse populations will help reveal the true clinical spectrum of genetic diseases, aid in variant interpretation, and ultimately facilitate precision medicine for all patients.
eMethods. Study Populations and Analyses
eFigure 1. Number of Phenotypes Evaluated for Each Gene in the eMERGEseq, HCR, and UKB Data Sets
eFigure 2. Permutation Test to Estimate the Empirical Phenome-Wide Significant P Value Threshold to Control Type I Errors
eTable 1. Full List of Genes Sequenced in the eMERGE Network
eTable 2. Population Characteristics of the eMERGEseq, HCR, and UKB Cohorts
eTable 3. Number and Percentage of Carriers by Each Gene in Each Ancestral Group Across 3 Cohorts
eTable 4. Association Results of Known Gene-Phenotype Associations Documented in the OMIM Database
eTable 5. Sensitivity Analyses With Analyses Restricted to European Descendants for All Newly Identified Associations
eTable 6. Sensitivity Analyses That Removed Participants With Prior Cancer Diagnoses in New Associations With Noncancer Phenotypes in the UKB Cohort
eTable 7. Sensitivity Analyses for CHEK2 in the UKB Cohort
eTable 8. Associations of Pathogenic/Likely Pathogenic Variants in CHEK2 With Subtypes of Leukemia
eTable 9. Associations of BRCA1 and BRCA2 With Phenotypes With Phenome-Wide Significance in PheWAS
eReferences
References
- 1.Delude CM. Deep phenotyping: the details of disease. Nature. 2015;527(7576):S14-S15. doi: 10.1038/527S14a [DOI] [PubMed] [Google Scholar]
- 2.Claussnitzer M, Cho JH, Collins R, et al. A brief history of human disease genetics. Nature. 2020;577(7789):179-189. doi: 10.1038/s41586-019-1879-7 [DOI] [PMC free article] [PubMed] [Google Scholar]
- 3.Bellacosa A. Developmental disease and cancer: biological and clinical overlaps. Am J Med Genet A. 2013;161A(11):2788-2796. doi: 10.1002/ajmg.a.36267 [DOI] [PMC free article] [PubMed] [Google Scholar]
- 4.Morton SU, Shimamura A, Newburger PE, et al. Association of damaging variants in genes with increased cancer risk among patients with congenital heart disease. JAMA Cardiol. 2021;6(4):457-462. doi: 10.1001/jamacardio.2020.4947 [DOI] [PMC free article] [PubMed] [Google Scholar]
- 5.Yehia L, Keel E, Eng C. The clinical spectrum of PTEN mutations. Annu Rev Med. 2020;71:103-116. doi: 10.1146/annurev-med-052218-125823 [DOI] [PubMed] [Google Scholar]
- 6.Pinna V, Daniele P, Calcagni G, et al. Prevalence, type, and molecular spectrum of NF1 mutations in patients with neurofibromatosis type 1 and congenital heart disease. Genes (Basel). 2019;10(9):E675. doi: 10.3390/genes10090675 [DOI] [PMC free article] [PubMed] [Google Scholar]
- 7.Chong JX, Buckingham KJ, Jhangiani SN, et al. ; Centers for Mendelian Genomics . The genetic basis of mendelian phenotypes: discoveries, challenges, and opportunities. Am J Hum Genet. 2015;97(2):199-215. doi: 10.1016/j.ajhg.2015.06.009 [DOI] [PMC free article] [PubMed] [Google Scholar]
- 8.Deans AR, Lewis SE, Huala E, et al. Finding our way through phenotypes. PLoS Biol. 2015;13(1):e1002033. doi: 10.1371/journal.pbio.1002033 [DOI] [PMC free article] [PubMed] [Google Scholar]
- 9.Gayther SA, Warren W, Mazoyer S, et al. Germline mutations of the BRCA1 gene in breast and ovarian cancer families provide evidence for a genotype-phenotype correlation. Nat Genet. 1995;11(4):428-433. doi: 10.1038/ng1295-428 [DOI] [PubMed] [Google Scholar]
- 10.Weren RD, Ligtenberg MJ, Kets CM, et al. A germline homozygous mutation in the base-excision repair gene NTHL1 causes adenomatous polyposis and colorectal cancer. Nat Genet. 2015;47(6):668-671. doi: 10.1038/ng.3287 [DOI] [PubMed] [Google Scholar]
- 11.Vogt S, Jones N, Christian D, et al. Expanded extracolonic tumor spectrum in MUTYH-associated polyposis. Gastroenterology. 2009;137(6):1976-85.e1, 10. doi: 10.1053/j.gastro.2009.08.052 [DOI] [PubMed] [Google Scholar]
- 12.Grover S, Kastrinos F, Steyerberg EW, et al. Prevalence and phenotypes of APC and MUTYH mutations in patients with multiple colorectal adenomas. JAMA. 2012;308(5):485-492. doi: 10.1001/jama.2012.8780 [DOI] [PMC free article] [PubMed] [Google Scholar]
- 13.Kuchenbaecker KB, Hopper JL, Barnes DR, et al. ; BRCA1 and BRCA2 Cohort Consortium . Risks of breast, ovarian, and contralateral breast cancer for BRCA1 and BRCA2 mutation carriers. JAMA. 2017;317(23):2402-2416. doi: 10.1001/jama.2017.7112 [DOI] [PubMed] [Google Scholar]
- 14.Au KS, Williams AT, Roach ES, et al. Genotype/phenotype correlation in 325 individuals referred for a diagnosis of tuberous sclerosis complex in the United States. Genet Med. 2007;9(2):88-100. doi: 10.1097/GIM.0b013e31803068c7 [DOI] [PubMed] [Google Scholar]
- 15.Amberger JS, Bocchini CA, Scott AF, Hamosh A. OMIM.org: leveraging knowledge across phenotype-gene relationships. Nucleic Acids Res. 2019;47(D1):D1038-D1043. doi: 10.1093/nar/gky1151 [DOI] [PMC free article] [PubMed] [Google Scholar]
- 16.Rath A, Olry A, Dhombres F, Brandt MM, Urbero B, Ayme S. Representation of rare diseases in health information systems: the Orphanet approach to serve a wide range of end users. Hum Mutat. 2012;33(5):803-808. doi: 10.1002/humu.22078 [DOI] [PubMed] [Google Scholar]
- 17.Denny JC, Bastarache L, Ritchie MD, et al. Systematic comparison of phenome-wide association study of electronic medical record data and genome-wide association study data. Nat Biotechnol. 2013;31(12):1102-1110. doi: 10.1038/nbt.2749 [DOI] [PMC free article] [PubMed] [Google Scholar]
- 18.Zhou W, Nielsen JB, Fritsche LG, et al. Efficiently controlling for case-control imbalance and sample relatedness in large-scale genetic association studies. Nat Genet. 2018;50(9):1335-1341. doi: 10.1038/s41588-018-0184-y [DOI] [PMC free article] [PubMed] [Google Scholar]
- 19.eMERGE Consortium . Harmonizing clinical sequencing and interpretation for the eMERGE III Network. Am J Hum Genet. 2019;105(3):588-605. doi: 10.1016/j.ajhg.2019.07.018 [DOI] [PMC free article] [PubMed] [Google Scholar]
- 20.Wiesner GL, Kulchak Rahm A, Appelbaum P, et al. Returning results in the genomic era: initial experiences of the eMERGE Network. J Pers Med. 2020;10(2):E30. doi: 10.3390/jpm10020030 [DOI] [PMC free article] [PubMed] [Google Scholar]
- 21.Daly MB, Pal T, Berry MP, et al. Genetic/Familial High-Risk Assessment: Breast, Ovarian, and Pancreatic, Version 2.2021, NCCN Clinical Practice Guidelines in Oncology. J Natl Compr Canc Netw. 2021;19(1):77-102. doi: 10.6004/jnccn.2021.0001 [DOI] [PubMed] [Google Scholar]
- 22.Danciu I, Cowan JD, Basford M, et al. Secondary use of clinical data: the Vanderbilt approach. J Biomed Inform. 2014;52:28-35. doi: 10.1016/j.jbi.2014.02.003 [DOI] [PMC free article] [PubMed] [Google Scholar]
- 23.Bycroft C, Freeman C, Petkova D, et al. The UK Biobank resource with deep phenotyping and genomic data. Nature. 2018;562(7726):203-209. doi: 10.1038/s41586-018-0579-z [DOI] [PMC free article] [PubMed] [Google Scholar]
- 24.Kalia SS, Adelman K, Bale SJ, et al. Recommendations for reporting of secondary findings in clinical exome and genome sequencing, 2016 update (ACMG SF v2.0): a policy statement of the American College of Medical Genetics and Genomics. Genet Med. 2017;19(2):249-255. doi: 10.1038/gim.2016.190 [DOI] [PubMed] [Google Scholar]
- 25.Miller DT, Lee K, Chung WK, et al. ; ACMG Secondary Findings Working Group . ACMG SF v3.0 list for reporting of secondary findings in clinical exome and genome sequencing: a policy statement of the American College of Medical Genetics and Genomics (ACMG). Genet Med. 2021;23(8):1381-1390. doi: 10.1038/s41436-021-01172-3 [DOI] [PMC free article] [PubMed] [Google Scholar]
- 26.Lincoln SE, Kobayashi Y, Anderson MJ, et al. A systematic comparison of traditional and multigene panel testing for hereditary breast and ovarian cancer genes in more than 1000 patients. J Mol Diagn. 2015;17(5):533-544. doi: 10.1016/j.jmoldx.2015.04.009 [DOI] [PubMed] [Google Scholar]
- 27.Wang Q, Dhindsa RS, Carss K, et al. ; AstraZeneca Genomics Initiative . Rare variant contribution to human disease in 281,104 UK Biobank exomes. Nature. 2021;597(7877):527-532. doi: 10.1038/s41586-021-03855-y [DOI] [PMC free article] [PubMed] [Google Scholar]
- 28.Yang Y, Muzny DM, Xia F, et al. Molecular findings among patients referred for clinical whole-exome sequencing. JAMA. 2014;312(18):1870-1879. doi: 10.1001/jama.2014.14601 [DOI] [PMC free article] [PubMed] [Google Scholar]
- 29.Miller DT, Lee K, Chung WK, et al. ; ACMG Secondary Findings Working Group . Correction to: ACMG SF v3.0 list for reporting of secondary findings in clinical exome and genome sequencing: a policy statement of the American College of Medical Genetics and Genomics (ACMG). Genet Med. 2021;23(8):1582-1584. doi: 10.1038/s41436-021-01278-8 [DOI] [PMC free article] [PubMed] [Google Scholar]
- 30.Olfson E, Cottrell CE, Davidson NO, et al. Identification of medically actionable secondary findings in the 1000 genomes. PLoS One. 2015;10(9):e0135193. doi: 10.1371/journal.pone.0135193 [DOI] [PMC free article] [PubMed] [Google Scholar]
- 31.Amendola LM, Dorschner MO, Robertson PD, et al. Actionable exomic incidental findings in 6503 participants: challenges of variant classification. Genome Res. 2015;25(3):305-315. doi: 10.1101/gr.183483.114 [DOI] [PMC free article] [PubMed] [Google Scholar]
- 32.Schwartz MLB, McCormick CZ, Lazzeri AL, et al. A model for genome-first care: returning secondary genomic findings to participants and their healthcare providers in a large research cohort. Am J Hum Genet. 2018;103(3):328-337. doi: 10.1016/j.ajhg.2018.07.009 [DOI] [PMC free article] [PubMed] [Google Scholar]
- 33.Van Hout CV, Tachmazidou I, Backman JD, et al. ; Geisinger-Regeneron DiscovEHR Collaboration; Regeneron Genetics Center . Exome sequencing and characterization of 49,960 individuals in the UK Biobank. Nature. 2020;586(7831):749-756. doi: 10.1038/s41586-020-2853-0 [DOI] [PMC free article] [PubMed] [Google Scholar]
- 34.Grzymski JJ, Elhanan G, Morales Rosado JA, et al. Population genetic screening efficiently identifies carriers of autosomal dominant diseases. Nat Med. 2020;26(8):1235-1239. doi: 10.1038/s41591-020-0982-5 [DOI] [PubMed] [Google Scholar]
- 35.Park J, Lucas AM, Zhang X, et al. Exome-wide evaluation of rare coding variants using electronic health records identifies new gene-phenotype associations. Nat Med. 2021;27(1):66-72. doi: 10.1038/s41591-020-1133-8 [DOI] [PMC free article] [PubMed] [Google Scholar]
- 36.Susswein LR, Marshall ML, Nusbaum R, et al. Pathogenic and likely pathogenic variant prevalence among the first 10,000 patients referred for next-generation cancer panel testing. Genet Med. 2016;18(8):823-832. doi: 10.1038/gim.2015.166 [DOI] [PMC free article] [PubMed] [Google Scholar]
- 37.Bastarache L. Using phecodes for research with the electronic health record: from PheWAS to PheRS. Annu Rev Biomed Data Sci. 2021;4:1-19. doi: 10.1146/annurev-biodatasci-122320-112352 [DOI] [PMC free article] [PubMed] [Google Scholar]
- 38.Sinnott JA, Cai F, Yu S, et al. PheProb: probabilistic phenotyping using diagnosis codes to improve power for genetic association studies. J Am Med Inform Assoc. 2018;25(10):1359-1365. doi: 10.1093/jamia/ocy056 [DOI] [PMC free article] [PubMed] [Google Scholar]
- 39.Ye Z, Mayer J, Ivacic L, et al. Phenome-wide association studies (PheWASs) for functional variants. Eur J Hum Genet. 2015;23(4):523-529. doi: 10.1038/ejhg.2014.123 [DOI] [PMC free article] [PubMed] [Google Scholar]
- 40.Liao KP, Sparks JA, Hejblum BP, et al. Phenome-wide association study of autoantibodies to citrullinated and noncitrullinated epitopes in rheumatoid arthritis. Arthritis Rheumatol. 2017;69(4):742-749. doi: 10.1002/art.39974 [DOI] [PMC free article] [PubMed] [Google Scholar]
- 41.Wang L, Zhang X, Meng X, et al. Methodology in phenome-wide association studies: a systematic review. J Med Genet. 2021;58(11):720-728. doi: 10.1136/jmedgenet-2021-107696 [DOI] [PubMed] [Google Scholar]
- 42.Bai W, Suzuki H, Huang J, et al. A population-based phenome-wide association study of cardiac and aortic structure and function. Nat Med. 2020;26(10):1654-1662. doi: 10.1038/s41591-020-1009-y [DOI] [PMC free article] [PubMed] [Google Scholar]
- 43.Belbin GM, Cullina S, Wenric S, et al. ; CBIPM Genomics Team; Regeneron Genetics Center . Toward a fine-scale population health monitoring system. Cell. 2021;184(8):2068-2083.e11. doi: 10.1016/j.cell.2021.03.034 [DOI] [PubMed] [Google Scholar]
- 44.Wu P, Gifford A, Meng X, et al. Mapping ICD-10 and ICD-10-CM codes to phecodes: workflow development and initial evaluation. JMIR Med Inform. 2019;7(4):e14325. doi: 10.2196/14325 [DOI] [PMC free article] [PubMed] [Google Scholar]
- 45.Doerken S, Avalos M, Lagarde E, Schumacher M. Penalized logistic regression with low prevalence exposures beyond high dimensional settings. PLoS One. 2019;14(5):e0217057. doi: 10.1371/journal.pone.0217057 [DOI] [PMC free article] [PubMed] [Google Scholar]
- 46.Firth D. Bias reduction of maximum-likelihood-estimates. Biometrika. 1993;80(1):27-38. doi: 10.1093/biomet/80.1.27 [DOI] [Google Scholar]
- 47.Privé F, Luu K, Blum MGB, McGrath JJ, Vilhjálmsson BJ. Efficient toolkit implementing best practices for principal component analysis of population genetic data. Bioinformatics. 2020;36(16):4449-4457. doi: 10.1093/bioinformatics/btaa520 [DOI] [PMC free article] [PubMed] [Google Scholar]
- 48.Win AK, Reece JC, Dowty JG, et al. Risk of extracolonic cancers for people with biallelic and monoallelic mutations in MUTYH. Int J Cancer. 2016;139(7):1557-1563. doi: 10.1002/ijc.30197 [DOI] [PMC free article] [PubMed] [Google Scholar]
- 49.Maag JLV. gganatogram: an R package for modular visualisation of anatograms and tissues based on ggplot2 (version 1; referees: 1 approved). F1000Research. 2018. doi: 10.12688/f1000research.16409.1 [DOI] [PMC free article] [PubMed]
- 50.Expression Atlas: Gene Expression Across Species and Biological Conditions. Accessed March 30, 2022. https://www.ebi.ac.uk/gxa/home
- 51.Ged Y, Chaim JL, DiNatale RG, et al. DNA damage repair pathway alterations in metastatic clear cell renal cell carcinoma and implications on systemic therapy. J Immunother Cancer. 2020;8(1):e000230. doi: 10.1136/jitc-2019-000230 [DOI] [PMC free article] [PubMed] [Google Scholar]
- 52.Alexandrov LB, Nik-Zainal S, Wedge DC, et al. ; Australian Pancreatic Cancer Genome Initiative; ICGC Breast Cancer Consortium; ICGC MMML-Seq Consortium; ICGC PedBrain . Signatures of mutational processes in human cancer. Nature. 2013;500(7463):415-421. doi: 10.1038/nature12477 [DOI] [PMC free article] [PubMed] [Google Scholar]
- 53.Helgason H, Rafnar T, Olafsdottir HS, et al. Loss-of-function variants in ATM confer risk of gastric cancer. Nat Genet. 2015;47(8):906-910. doi: 10.1038/ng.3342 [DOI] [PubMed] [Google Scholar]
- 54.Hsu FC, Roberts NJ, Childs E, et al. Risk of pancreatic cancer among individuals with pathogenic variants in the ATM gene. JAMA Oncol. 2021;7(11):1664-1668. doi: 10.1001/jamaoncol.2021.3701 [DOI] [PMC free article] [PubMed] [Google Scholar]
- 55.Carlo MI, Ravichandran V, Srinavasan P, et al. Cancer susceptibility mutations in patients with urothelial malignancies. J Clin Oncol. 2020;38(5):406-414. doi: 10.1200/JCO.19.01395 [DOI] [PMC free article] [PubMed] [Google Scholar]
- 56.Bazinet A, Heath J, Chong AS, et al. Common clonal origin of chronic myelomonocytic leukemia and B-cell acute lymphoblastic leukemia in a patient with a germline CHEK2 variant. Cold Spring Harb Mol Case Stud. 2021;7(3):a006090. doi: 10.1101/mcs.a006090 [DOI] [PMC free article] [PubMed] [Google Scholar]
- 57.Rudd MF, Sellick GS, Webb EL, Catovsky D, Houlston RS. Variants in the ATM-BRCA2-CHEK2 axis predispose to chronic lymphocytic leukemia. Blood. 2006;108(2):638-644. doi: 10.1182/blood-2005-12-5022 [DOI] [PubMed] [Google Scholar]
- 58.Moore NS, Aldubayan SH, Taylor-Weiner A, et al. Inherited DNA repair and cell cycle gene defects in chronic lymphocytic leukemia. J Clin Oncol. 2019;37(15)(suppl):1508. doi: 10.1200/JCO.2019.37.15_suppl.1508 [DOI] [Google Scholar]
- 59.Bick AG, Weinstock JS, Nandakumar SK, et al. ; NHLBI Trans-Omics for Precision Medicine Consortium . Inherited causes of clonal haematopoiesis in 97,691 whole genomes. Nature. 2020;586(7831):763-768. doi: 10.1038/s41586-020-2819-2 [DOI] [PMC free article] [PubMed] [Google Scholar]
- 60.Jaiswal S, Fontanillas P, Flannick J, et al. Age-related clonal hematopoiesis associated with adverse outcomes. N Engl J Med. 2014;371(26):2488-2498. doi: 10.1056/NEJMoa1408617 [DOI] [PMC free article] [PubMed] [Google Scholar]
- 61.Kwan TT, Oza AM, Tinker AV, et al. Preexisting TP53-variant clonal hematopoiesis and risk of secondary myeloid neoplasms in patients with high-grade ovarian cancer treated with rucaparib. JAMA Oncol. 2021;7(12):1772-1781. doi: 10.1001/jamaoncol.2021.4664 [DOI] [PMC free article] [PubMed] [Google Scholar]
- 62.Mann CJ. Observational research methods: research design II: cohort, cross sectional, and case-control studies. Emerg Med J. 2003;20(1):54-60. doi: 10.1136/emj.20.1.54 [DOI] [PMC free article] [PubMed] [Google Scholar]
- 63.Wasylishen AR, Sun C, Chau GP, et al. Men1 maintains exocrine pancreas homeostasis in response to inflammation and oncogenic stress. Proc Natl Acad Sci U S A. 2020;117(12):6622-6629. doi: 10.1073/pnas.1920017117 [DOI] [PMC free article] [PubMed] [Google Scholar]
- 64.Crusz SM, Balkwill FR. Inflammation and cancer: advances and new agents. Nat Rev Clin Oncol. 2015;12(10):584-596. doi: 10.1038/nrclinonc.2015.105 [DOI] [PubMed] [Google Scholar]
- 65.Casorelli I, Pannellini T, De Luca G, et al. The Mutyh base excision repair gene influences the inflammatory response in a mouse model of ulcerative colitis. PLoS One. 2010;5(8):e12070. doi: 10.1371/journal.pone.0012070 [DOI] [PMC free article] [PubMed] [Google Scholar]
- 66.González F. Inflammation in polycystic ovary syndrome: underpinning of insulin resistance and ovarian dysfunction. Steroids. 2012;77(4):300-305. doi: 10.1016/j.steroids.2011.12.003 [DOI] [PMC free article] [PubMed] [Google Scholar]
- 67.Bastarache L, Hughey JJ, Goldstein JA, et al. Improving the phenotype risk score as a scalable approach to identifying patients with mendelian disease. J Am Med Inform Assoc. 2019;26(12):1437-1447. doi: 10.1093/jamia/ocz179 [DOI] [PMC free article] [PubMed] [Google Scholar]
- 68.Bastarache L, Hughey JJ, Hebbring S, et al. Phenotype risk scores identify patients with unrecognized Mendelian disease patterns. Science. 2018;359(6381):1233-1239. doi: 10.1126/science.aal4043 [DOI] [PMC free article] [PubMed] [Google Scholar]
- 69.Roy R, Chun J, Powell SN. BRCA1 and BRCA2: different roles in a common pathway of genome protection. Nat Rev Cancer. 2011;12(1):68-78. doi: 10.1038/nrc3181 [DOI] [PMC free article] [PubMed] [Google Scholar]
- 70.Denny JC, Rutter JL, Goldstein DB, et al. ; All of Us Research Program Investigators . The “All of Us” research program. N Engl J Med. 2019;381(7):668-676. doi: 10.1056/NEJMsr1809937 [DOI] [PMC free article] [PubMed] [Google Scholar]
Associated Data
This section collects any data citations, data availability statements, or supplementary materials included in this article.
Supplementary Materials
eMethods. Study Populations and Analyses
eFigure 1. Number of Phenotypes Evaluated for Each Gene in the eMERGEseq, HCR, and UKB Data Sets
eFigure 2. Permutation Test to Estimate the Empirical Phenome-Wide Significant P Value Threshold to Control Type I Errors
eTable 1. Full List of Genes Sequenced in the eMERGE Network
eTable 2. Population Characteristics of the eMERGEseq, HCR, and UKB Cohorts
eTable 3. Number and Percentage of Carriers by Each Gene in Each Ancestral Group Across 3 Cohorts
eTable 4. Association Results of Known Gene-Phenotype Associations Documented in the OMIM Database
eTable 5. Sensitivity Analyses With Analyses Restricted to European Descendants for All Newly Identified Associations
eTable 6. Sensitivity Analyses That Removed Participants With Prior Cancer Diagnoses in New Associations With Noncancer Phenotypes in the UKB Cohort
eTable 7. Sensitivity Analyses for CHEK2 in the UKB Cohort
eTable 8. Associations of Pathogenic/Likely Pathogenic Variants in CHEK2 With Subtypes of Leukemia
eTable 9. Associations of BRCA1 and BRCA2 With Phenotypes With Phenome-Wide Significance in PheWAS
eReferences