

Abstract
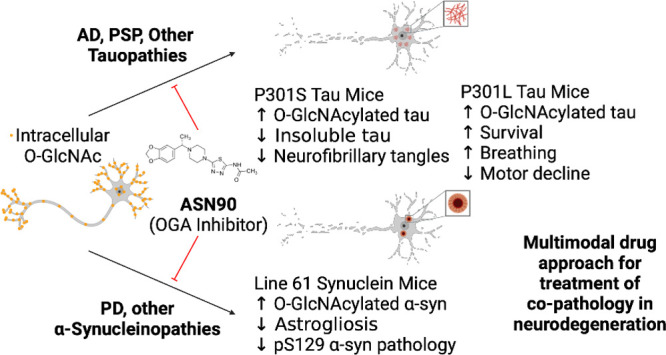
Neurodegenerative proteinopathies are characterized by the intracellular formation of insoluble and toxic protein aggregates in the brain that are closely linked to disease progression. In Alzheimer’s disease and in rare tauopathies, aggregation of the microtubule-associated tau protein leads to the formation of neurofibrillary tangles (NFT). In Parkinson’s disease (PD) and other α-synucleinopathies, intracellular Lewy bodies containing aggregates of α-synuclein constitute the pathological hallmark. Inhibition of the glycoside hydrolase O-GlcNAcase (OGA) prevents the removal of O-linked N-acetyl-d-glucosamine (O-GlcNAc) moieties from intracellular proteins and has emerged as an attractive therapeutic approach to prevent the formation of tau pathology. Like tau, α-synuclein is known to be modified with O-GlcNAc moieties and in vitro these have been shown to prevent its aggregation and toxicity. Here, we report the preclinical discovery and development of a novel small molecule OGA inhibitor, ASN90. Consistent with the substantial exposure of the drug and demonstrating target engagement in the brain, the clinical OGA inhibitor ASN90 promoted the O-GlcNAcylation of tau and α-synuclein in brains of transgenic mice after daily oral dosing. Across human tauopathy mouse models, oral administration of ASN90 prevented the development of tau pathology (NFT formation), functional deficits in motor behavior and breathing, and increased survival. In addition, ASN90 slowed the progression of motor impairment and reduced astrogliosis in a frequently utilized α-synuclein-dependent preclinical rodent model of PD. These findings provide a strong rationale for the development of OGA inhibitors as disease-modifying agents in both tauopathies and α-synucleinopathies. Since tau and α-synuclein pathologies frequently co-exist in neurodegenerative diseases, OGA inhibitors represent unique, multimodal drug candidates for further clinical development.
Keywords: Alzheimer’s disease, Parkinson’s disease, O-GlcNAcase inhibitor, microtubule-associated protein tau, α-synuclein, proteinopathies, drug development
Introduction
In contrast to the complex, branched carbohydrate modifications found on cell surface proteins, glycosylation of intracellular proteins mainly involves the addition of single N-acetyl-d-glucosamine (GlcNAc) sugar moieties to the side chains of serine and threonine amino acids.1 This post-translational modification, termed O-GlcNAcylation, is highly dynamic, and cellular steady-state levels are regulated by a unique pair of enzymes. O-linked N-acetylglucosaminyltransferase (OGT)2 conjugates GlcNAc residues to its substrates using the co-substrate uridine 5′-diphospho-N-acetyl-d-glucosamine (UDP-GlcNAc). UDP-GlcNAc is synthesized in the hexosamine biosynthetic pathway that depends on the availability of glucose and other nutrients, thereby linking O-GlcNAcylation to nutrient and stress responses. O-GlcNAcase (OGA)3 is the counteracting glycoside hydrolase that catalyzes the removal of O-linked GlcNAc moieties. Since brain protein O-GlcNAcylation appears to decrease in the aging brain,4 epilepsy,5 and Alzheimer’s disease (AD),6,7 potentially as a result of metabolic abnormalities and mitochondrial energy failure, inhibition of OGA has evolved as an attractive pharmacological means to treat conditions characterized by insufficient O-GlcNAcylation such as neurodegenerative proteinopathies. In this context, O-GlcNAcylation has been shown to reduce the aggregation propensity as well as the toxicity of amyloidogenic proteins including the microtubule-associated tau protein8 and α-synuclein.9,10 The beneficial effects of OGA inhibition have been documented for the tool inhibitor Thiamet G8,11,12 as well as for the recently disclosed clinical compound MK-871913 in a number of preclinical tau transgenic rodent models.
α-Synuclein is a presynaptic protein that has both genetic and pathophysiologic links to Parkinson’s disease (PD) and to other Parkinsonian diseases that are often collectively referred to as α-synucleinopathies. Point mutations in the coding sequence of the α-synuclein gene (SNCA)14 or SNCA gene triplications15 are causative of early-onset, autosomal-dominant PD. In addition, α-synuclein is the major constituent of the characteristic Lewy body pathology observed in PD16 and in less common α-synucleinopathies like Lewy body dementia and multiple-system atrophy (MSA). α-Synuclein has nine O-GlcNAcylation sites that have been identified in human and rodent brains.17 Seminal studies with synthetic α-synuclein have demonstrated that O-GlcNAcylation blocks its aggregation (both nucleation and fibril elongation) even at substoichiometric concentrations and cellular toxicity.9,10 More recently, Thiamet G has also been shown to reduce the cellular internalization of α-synuclein fibrils.18 Thiamet G has also been shown to alleviate the degeneration and pathology in dopaminergic neurons caused by α-synuclein overexpression in an adeno-associated virus model through multiple mechanisms including reduced α-synuclein aggregation propensity, an enhanced neuronal stress response, and the facilitation of dopamine neurotransmission.19
Herein, we describe the discovery of a novel clinical OGA inhibitor ASN90 with an excellent CNS drug and target selectivity profile. ASN90 is chemically distinct from carbohydrate-type substrate mimetic OGA inhibitors such as Thiamet G and MK-8719. We show that ASN90 binds to the OGA enzyme in the living rat brain and robustly elevates the O-GlcNAcylation of brain proteins, including both tau and α-synuclein, in vivo. Demonstrating the potential for ASN90 across different neurodegenerative pathologies, ASN90 had therapeutic efficacy in preclinical models of both tau and α-synuclein pathology. These results highlight therapeutic potential for the use of OGA inhibitors such as the clinical stage molecule ASN90 for the treatment of a wide range of common and rare neurodegenerative diseases.
Results
ASN90 is a Novel and Specific Inhibitor of the OGA Enzyme
The novel compound (S)-N-(5-(4-(1-(benzo[d][1,3]dioxol-5-yl)ethyl)piperazin-1-yl)-1,3,4-thiadiazol-2-yl)acetamide, also known as ASN90 (Figure 1A), was identified in a medicinal chemistry optimization campaign as a potent and selective inhibitor of the OGA enzyme. The inhibitory potency of ASN90 on recombinant full-length human OGA yielded a mean IC50 = 10.2 nM (Figure 1B). ASN90 is a chiral molecule, and an approximately 100-fold difference in potency exists between ASN90 and its less active enantiomer ASN89 (Figure 1A,B). The stereospecificity of inhibition implies that ASN90 binds to a structurally defined pocket in OGA. In human HEK293 cells, inhibition of OGA with ASN90 resulted in a sigmoidal increase in total protein O-GlcNAcylation measured with the pan O-GlcNAc antibody RL2 (Figure 1C) that specifically recognizes O-GlcNAc when attached to proteins.20 The effect on O-GlcNAcylation of tau protein was confirmed in HEK293 cells stably expressing human 2N4R tau with an immunoassay based on an antibody specifically recognizing tau when it is O-GlcNAcylated at serine 40021 (Figure 1C). The increase in general protein O-GlcNAcylation in cells upon OGA inhibition correlated well with the increase in tau O-GlcNAcylation, suggesting that the former can be used as a surrogate marker for tau O-GlcNAcylation. Hexosaminidase (Hex), a lysosomal enzyme with an enzymatic mechanism that is related to OGA, breaks down sphingolipids and oligosaccharides in lysosomes. Hex deficiencies cause the GM2 gangliosidoses Tay–Sachs and Sandhoff disease.22 In corresponding Hex enzyme assays, no inhibitory activity of ASN90 was observed up to the highest concentration tested (30 μM; Figure S1). This contrasted with the non-selective glycoside hydrolase inhibitor PUGNAc, which inhibited both HexA and A/B (IC50 = 490 and 31 nM, respectively; Figure S1).
Figure 1.

ASN90 is a potent, substrate-competitive, and reversible OGA inhibitor. (A) Chemical structure of ASN90 and its less active (R)-enantiomer ASN89. (B) ASN90 potently inhibits recombinant human O-GlcNAcase as quantified with a fluorogenic substrate (IC50 = 10.2 nM). ASN89 is about 2 orders of magnitude less potent (IC50 = 1017 nM). (C) In wild-type HEK293 cells, the potency of ASN90 was measured by quantifying the accumulation of total protein O-GlcNAcylation (EC50 = 320 nM). A similar cellular potency was obtained when measuring tau O-GlcNAcylation with an antibody specifically recognizing tau O-GlcNAcylated at Serine 400 in HEK293 cells expressing human 2N4R tau (EC50 = 314 nM). Data (n = 3) are displayed as mean+/– SD. (D) Enzyme velocity (ΔF/min) was measured at increasing 4MU-NAG substrate concentrations and several fixed concentrations of ASN90. Increasing ASN90 concentrations affect the Km but not Vmax indicative of substrate competition. (E) The Lineweaver–Burk plot confirms competitive inhibition since all lines intercept the Y axis at the same point (Y = 1/Vmax). (F) The shift of in vitro potency (IC50) of ASN90 upon dilution of preformed enzyme/inhibitor complexes is indicative of a reversible enzyme inhibition. Data are displayed as the mean +/– SD (n = 3).
ASN90 is a Reversible, Substrate-Competitive Inhibitor Inhibiting the Rodent and Human OGA Enzymes in Peripheral Blood Mononuclear Cells and Displays Activity in a Human Surrogate Target Engagement Assay
In a detailed enzyme kinetics experiment, ASN90 did not interfere with the maximum enzyme velocity (Vmax) but did diminish enzyme affinity (Km) (Figure 1D,E). These findings demonstrated that ASN90 is a substrate-competitive inhibitor of OGA. The binding of ASN90 to the active site of OGA was also supported by the results of an inhibitor cross-competition enzyme kinetics study with the active-site-directed OGA inhibitor Thiamet G. The corresponding Yonetani–Theorell analysis23 revealed that both compounds are binding to the same site (Figure S2). To determine the reversibility of enzyme-inhibitor binding, recombinant OGA was pre-incubated with ASN90 at different concentrations followed by dilution prior to addition of the fluorogenic substrate. The observed decrease in potency upon dilution of the enzyme reaction was indicative of a reversible mechanism of enzyme inhibition (Figure 1F). To confirm the relevance of the rodent studies described in the subsequent section and to provide a potential translational target engagement biomarker first in human clinical studies, the potency of ASN90 in isolated peripheral mononuclear blood cells (PBMC) from rats and human healthy donors was compared (Figure S3). ASN90 induced protein O-GlcNAcylation in plated human and rodent PBMC with similar potencies (EC50 of 209 and 489 nM for human and rodent PBMC, respectively, see Figure S3). Most importantly, ASN90 was also active when incubated ex vivo with human donor blood from seven different donors (Figure S4). ASN90 binds extensively to human plasma protein (Table S1; 1.9% unbound), which accounts for the shift in potency in the human ex vivo assay compared to the recombinant enzyme.
ASN90 has CNS-like Drug Properties and Binds with High Affinity to the OGA Enzyme in the Rat Brain
To evaluate the pharmacokinetic/pharmacodynamic (PK/PD) relationship in the rat, dose responses of total protein O-GlcNAcylation in the rat brain and PBMC were investigated 4 h after a single-oral dose of ASN90 (Figure 2A–C). Drug levels in the brain, plasma, and cerebrospinal fluid (CSF) were quantified by high-performance liquid chromatography–tandem mass spectrometry (LC–MS/MS) (Table S2). The observed ED50 of 7 mg/kg for brain protein O-GlcNAcylation corresponded to an in vivo CSF EC50 of 90 nM (equivalent to the free drug concentration in the brain). Interestingly, a maximum response is seen at around a doubling of the basal levels, implying that the accumulation of those O-GlcNAcylated proteins recognized by the RL2 antibody is limited. A highly significant correlation (R2 = 0.99) between the brain and PBMC O-GlcNAcylation was also seen, implying that peripheral and CNS OGA enzyme activities are equally inhibited by ASN90 (Figure 2D). Overall, the ASN90 PK profile showed good dose linearity and excellent brain penetration with a brain/plasma ratio of around 1. CSF drug levels were approximately at the levels of the free fraction in plasma (Table S2), confirming free diffusion of ASN90 across the blood brain barrier. ASN90 enzyme occupancy in living rat brains was quantified using the radioligand [18F]LSN3316612, which specifically binds to OGA and has been characterized in detail.24 The plasma concentration/enzyme occupancy relationship at the target binding site is shown in Figure 2E, and the ASN90 plasma concentration required to achieve 50% of OGA occupancy (Occ50) was 55.4 ng/mL. Correlating the calculated enzyme occupancy and accumulation of brain protein O-GlcNAcylation measured at a steady state in rats after 4 days of dosing demonstrated that brain O-GlcNAcylation (biomarker of enzyme inhibition) begins to increase at an enzyme occupancy of 35% (Figure 2F). Once approximately 98% enzyme occupancy is reached, further substrate accumulation continues up to 3-fold of basal levels. This increase in brain O-GlcNAcylation that occurs above 98% enzyme occupancy at t = 4 h rather reflects the greater trough drug levels at higher doses, which are expected to promote a continued accumulation of the substrate over the 4 day time period (at high OGA enzyme occupancy/inhibition).
Figure 2.

ASN90 PK/PD relationship and enzyme occupancy in wild-type rats after single-oral administration. ASN90 dose-dependently increased protein O-GlcNAcylation in both the rat brain (A) and rat PBMC (B) 4 h after a single-oral administration. Data are expressed in % vehicle control of protein O-GlcNAcylation (**p < 0.01, ***p < 0.001, ****p < 0.0001 versus vehicle groups, one-way ANOVA followed by Dunnett’s post hoc test, n = 6/group). (C) Plot of the rat brain and PBMC protein O-GlcNAcylation against log(dose) for ED50 calculation. (D) Highly significant correlation between the brain and PBMC pharmacodynamic response revealed by linear regression analysis (R2 = 0.99). (E) Relationship between ASN90 plasma concentrations and brain OGA enzyme occupancy in rats using the PET radioligand [18F]-LSN3316612, which specifically binds to OGA. The plasma concentration required to achieve 50% of OGA enzyme occupancy (Occ50) was 55.4 ng/mL. (F) Calculated relationship between protein O-GlcNAcylation at a steady state obtained from a separate PK/PD study (expressed as a fold increase in O-protein) and enzyme occupancy obtained from the PET study. The pharmacodynamic response (O-protein accumulation) started at about 35% calculated enzyme occupancy. The further accumulation of O-protein at >98% calculated target engagement at t = 4 h is likely reflective of the cumulative nature of the stabilization of protein O-GlcNAcylation at greater ASN90 drug trough levels.
Treatment Benefits of ASN90 in Tau Transgenic Mouse Models
To investigate the effects of a chronic ASN90 treatment in a preclinical model of tauopathy, we initially chose the hTauP301S model that expresses human P301S tau under the control of the neuron-specific Thy-1 promoter.25 In a pilot study, ASN90 was dosed orally once a day (QD) with 100 mg/kg for 4 days in 2 month old P301S tau mice followed by the quantification of ASN90 drug levels, total protein O-GlcNAcylation, O-tau, and various phospho-tau (ptau) species at 4, 8, and 24 h after the last dose (Figure 3). The results indicated that the ASN90 treatment elevated O-tau levels up to a 15.6-fold mean at 8 h with the 100 mg/kg QD dose (Figure 3B). The effect on total protein O-GlcNAcylation was less pronounced with a maximum elevation of 1.8-fold at 8 h and a much faster decrease back to baseline levels at 24 h (Figure 3A and Figure S5A,B). In good agreement with literature reports on Thiamet G,26 ASN90 also produced a significant increase in OGA protein expression (∼2.5-fold), however, without significantly modulating OGT expression (Figure S6A–F). In terms of effect size and overall kinetics, OGA inhibition had a much greater effect on O-tau than the total protein O-GlcNAcylation. To put these data into the context of CNS target engagement (Table S3), we utilized the rat enzyme occupancy data (Figure 2E). Since ASN90 plasma protein binding was similar between the mouse and rat (Table S1), we assumed that the same applied to the plasma EC50 for enzyme occupancy in the brain. Comparing target engagement and pharmacodynamic response revealed a complex picture (Figure 2E,F) since the latter resulted from the continued accumulation of enzyme substrates (O-tau and O-protein). Our interpretation of the data is that the duration of enzyme occupancy is most critical for the magnitude of the pharmacodynamic response (e.g., at 30 mg/kg, the extrapolated EO is already below 85% at t = 8 h, whereas it resides still above 95% at 100 mg/kg; Table S3).
Figure 3.

Pharmacodynamic response in P301S tau mice after 4 days of dosing with ASN90. ASN90 was orally administrated for 4 days at 100 mg/kg/day, and brain protein O-GlcNAcylation (A), O-tau (B), and tau phosphorylation at position Ser202/Thr205 (AT8) (C), Ser396 (D), and Ser356 (E) were quantified in the soluble cortex fraction of the animals at 4, 8, and 24 h after administration of the last dose. Corresponding plasma drug levels were 10,036 ng/mL (4 h), 2275 ng/mL (8 h), and 28 ng/mL (24 h). Data are displayed as mean +/– SEM after normalization to total tau levels (*p < 0.05 vs vehicle; **p < 0.01 vs vehicle; ****p < 0.0001 vs vehicle; one-way ANOVA followed by Dunnett’s post hoc test, n = 6/group).
A quantification of various ptau species (pSer202/Thr205, pSer356, and pSer396) known to be hyperphosphorylated in pathological tau27 demonstrated a significant elevation of these tau species upon OGA inhibition in the soluble brain fraction (Figure 3C–E). Tauopathy in hTauP301S mice develops rapidly between 2 and 5 months of age, making it an ideal model for the rapid assessment of the ability of therapeutics to affect the progression of disease-related tau pathology. Using this model, a preferred treatment regime starts around 2 months of age before substantial tau pathology can be detected28 and hence this time point was chosen for the initiation of treatment in our study. It is worth noting that low levels of toxic tau species are often present at 2 months of age,29 and the brainstem and spinal cord neuronal loss are already occurring around this time.25
To assess the effect of ASN90 on the development of neurofibrillary tangle pathology in P301S mice, a chronic study was initiated next. Starting at an age of 2 months, ASN90 was given once daily to P301S mice by oral gavage for 106 days at 30 and 100 mg/kg and compared to vehicle-treated animals (n = 15/group). No signs of adverse effects (mobility, distress, pain, or piloerection) related to ASN90 treatment at 30 or 100 mg/kg were observed during the study. Starting at 4.5 months of age, all groups of animals (vehicle, ASN90 at 30 and 100 mg/kg) developed progressive motor deficits measured by using the tail suspension (clasping) and rotarod test independent of the treatment (Figure S7). The severe and fatal motor phenotype observed in this model is largely due to the neurodegeneration in the brainstem and spinal cord where insoluble phosphorylated tau can already be detected at 2 months of age. We interpret this finding as evidence that, at the start of the dosing with ASN90, the pathology/seed of pathology causing the functional deficit had already progressed beyond the point where it could be modulated in this specific mouse model.
Different tissues (kidneys, spleen, stomach, gut, lungs, and heart) were examined at necropsy, and no gross abnormalities were observed. For biochemical analyses, pathological tau species were isolated from various brain regions in one hemisphere using the sarkosyl-extraction method30,31 and quantified with immunoassays for various tau phospho-epitopes that are hyperphosphorylated in pathological tau.27 At the highest dose of 100 mg/kg, highly significant reductions of pathological (sarkosyl-insoluble) tau were observed in the cortex using AT8, pS356, and pS396 phospho-tau assays (−40, −33, and −39% mean at the highest dose, respectively, Figure S8A–C) and in the hippocampus using the pS356 phospho-tau assay (−37% mean; Figure S8D).
For histological analysis of pathological tau, longitudinal brain sections were stained with phospho-tau-specific antibodies (AT100 and AT8) and Gallyas silver, the classical method of visualizing NFTs.32 Representative immunohistochemistry images are shown in Figure 4B,D,F. The quantification revealed a significant reduction of pathological tau in the granule cells of the dentate gyrus of the hippocampus as detected by AT8 (−41% mean at the highest dose) and AT100 (−78% mean at the highest dose) immunoreactivities (Figure 4A,C). The difference between the two antibodies may be explained by their specific epitopes. AT8 detects the pSer202/Thr205 epitope occurring early in the course of tau aggregation, whereas AT100 detects the pThr212/Ser214 epitope on paired helical filaments (PHF) that are closely correlated with the appearance of toxic NFT. In line with this, using Gallyas silver staining, an 80% reduction of NFT in the dentate gyrus was observed (Figure 4E). Overall, it can be stated that treatment with ASN90 leads to a reduction of pathological tau as consistently detected by different biochemical and histochemical means. Further analysis using western blot immunodetection with the antibody specific for S400 O-GlcNAcylated tau demonstrated that O-GlcNAcylated tau was present in the soluble tau fraction but absent in the sarkosyl-insoluble, toxic tau PHF fraction (Figure S9). This result suggests that O-GlcNAcylation and PHF formation are mutually exclusive.
Figure 4.

Chronic treatment (3.5 months) with ASN90 reduced NFT-like pathology in transgenic P301S tau mice. NFT-like pathology (positive neurons/mm2) present in the dentate gyrus (granular cell layer) was quantified by immunohistochemistry (IHC) with phospho-tau antibodies AT100 (A) and AT8 (C) and by using standard Gallyas silver staining (E). Representative images of NFT-like pathology determined by AT100 and AT8 IHC and by Gallyas silver staining are shown in panels (B), (D), and (F), respectively. Data are displayed as mean +/– SEM (*p < 0.05 vs vehicle; ***p < 0.001 vs vehicle ****p < 0.0001 vs vehicle; one-way ANOVA followed by Dunnett’s post hoc test). Scale bar: 50 μm.
Since we did not observe effects on motor behavior in this P301S mouse model, ASN90 was tested in a slower progressing P301L tau transgenic model.33 This specific tau model shows a cognitive decrease beginning around 5 months of age that parallels the beginning of tau pathology. Around 7 months, P301L mice develop motor impairment in the form of clasping behavior, central breathing deficits, and reduced mobility.34,35 Due to hindbrain tauopathy, poor nutritional intake, and tissue wasting, death or human sacrifice occurs in the vast majority of P301L mice between 9 and 12 months of life. For the breathing deficits, a direct correlation has been shown between this functional deficit and the presence of hyperphosphorylated protein tau in brainstem upper airway premotor neuronal populations such as Kölliker–Fuse and intermediate reticular nuclei.34,35
To assess the therapeutic potential of ASN90 to provide acute treatment benefits, P301L mice at 7 months of age were treated daily for 4 days using oral gavage (30 and 100 mg kg/day ASN90 or vehicle). The lung function measurement at day 4 of treatment showed that ASN90 significantly improved upper airway dysfunction. The Tiffeneau index (Figure 5A) (FEV0.2/FVC), which in humans is used in the diagnosis of respiratory disease, was significantly increased at both 30 and 100 mg/kg/day ASN90 compared to vehicle-treated animals (p = 0.0074; one-way ANOVA followed by Dunnett’s post hoc). Additionally, to this effect, we observed an increase in O-tau in the brainstem of ASN90-treated animals (Figure 5B). Taken together, the data demonstrate that the P301L tau-induced brainstem breathing deficit observed in the P301L tau model can be partially restored after acute treatment with the O-GlcNAcase inhibitor ASN90. These results are in good agreement with previously published data, where similar effects were reported with high doses (500 mg/kg/day) of Thiamet G.34
Figure 5.

Acute treatment with ASN90 improves breathing function, and chronic treatment provides functional and survival benefits in P301L tau transgenic mice. (A) ASN90 significantly improved upper airway dysfunction in 7 month old P301L tau Tg mice as illustrated by a significant increase in the Tiffeneau index (FEV0.2/FVC), at 30 and 100 mg/kg/day ASN90 compared to vehicle-treated animals. Data are displayed as mean +/– SEM (*p < 0.05 vs vehicle; one-way ANOVA followed by Dunnett’s post hoc). (B) Tau O-GlcNAcylation (O-tau) in the same P301L mice treated for 4 days (steady state) with 30 and 100 mg/kg ASN90. Data are displayed as mean +/– SEM after normalization to total tau (*p < 0.05 versus vehicle; ****p < 0.0001 versus vehicle; non-parametric Kruskal–Wallis followed by Dunn’s post hoc test). Please note that the brains were collected at t = 2.5 h, which is earlier than the standard time point for PK studies (t = 4 h). (C) Evolution of weekly clasping scores throughout chronic ASN90 treatment per treatment group. An age-related increase in the clasping score in relation to known pathology progression was observed (p < 0.0001). A significant decrease in the clasping score was demonstrated in the ASN90 30 mg/kg/day treatment versus the vehicle group by Dunnett’s post-hoc test at ages of 8.19, 8.42, and 8.65 months (p = 0.0248, 0.0265, and 0.0274, respectively). The data represent the average clasping scores per week and are displayed as means +/– SEM (*p < 0.05 vs vehicle; two-way repeated measure ANOVA followed by Dunnett’s multiple comparison post hoc test). (D) Kaplan–Meier survival curves after chronic treatment of hTauP301L mice with ASN90. Vertical dotted lines illustrate interim survival analyses performed at 8.5 and 9.2 months of age, and results are displayed in Table S4. Treatment effects on survival rates (%) were demonstrated between ASN90 treatment (30 and 100 mg/kg/day) and vehicle groups using a log-rank (Mantel–Cox) test. (E) Tau O-GlcNAcylation (O-tau) in P301L mice (midbrain) treated for 6 months with 30 and 100 mg/kg ASN90. Data are displayed as mean +/– SEM after normalization to total tau levels (****p < 0.0001 versus vehicle; non-parametric Kruskal–Wallis followed by Dunn’s post hoc test; +p = 0.015 versus vehicle; unpaired t test).
To investigate the potential of ASN90 to prevent the worsening of motoric behavior and progression to death, we examined the effect of chronic treatment with ASN90 by treating 3.5 month old P301L tau mice orally for 6 months with 30 and 100 mg/kg/day ASN90. The motoric dysfunction in P301L tau mice can be assessed by scoring of a clasping phenotype, a sensitive functional read-out. As expected, we observed an age-related increase in the clasping score (average score/week) that is known to parallel the progression of tau pathology (Figure 5C).33 Overall, treatment with ASN90 showed a tendency to decrease the clasping score (p = 0.0575; analyzed by two-way RM ANOVA). Importantly, multiple comparison using Dunnett’s post-hoc test revealed a significant decrease in the clasping score in the 30 mg kg/day ASN90 treatment group compared to the vehicle group at ages of 8.19, 8.42, and 8.65 months (p = 0.0248, 0.0265, and 0.0274, respectively). ASN90 treatment also significantly increased survival in P301L mice. Interim analyses performed at a stage when all treatment groups displayed at least 50% survival (n = 15) provided sufficient power to perform statistical analyses (Table S4 and Figure 5D). Consistent with a previously reported study using the OGA inhibitor Thiamet G,34 no statistically significant treatment effects on pathogenic tau isoforms such as pS202/205 (AT8) were observed (Figure S10). The quantification of O-tau in the midbrain, however, confirmed that ASN90-treatment increased O-tau steady-state levels (Figure 5E).
ASN90 Treatment Promotes O-GlcNAcylation of α-Synuclein and Reduces Motor Impairment and Astrogliosis in a Preclinical Mouse Model of Parkinson’s Disease
Given the therapeutic effect of ASN90 in tauopathy models, we reasoned that ASN90 may also be beneficial in other neurodegenerative proteinopathy models. Several lines of evidence from in vitro studies assessing α-synuclein aggregation and toxicity have highlighted the potential of OGA inhibitors for α-synucleinopathies such as PD. α-Synuclein has been closely linked to PD both genetically and neuropathologically.14,15 To investigate the therapeutic potential of ASN90 in PD, we utilized Line 61 α-synuclein transgenic mice that overexpress human α-synuclein throughout the brain under the Thy1 promoter.36 The appearance of pathology and motor deficits relevant to human disease have been well described37 in Line 61 mice, making them an attractive preclinical model for evaluating the potential efficacy of disease-modifying drugs for PD. Male Line 61 mice (n = 16 per group; vehicle and 30 and 100 mg/kg/day ASN90) and wild-type littermates (n = 16; vehicle only) were treated starting from week 4 for 24 weeks QD by oral gavage. The motor performance in the beam walk was assessed at baseline before the start of treatment (week 4 of age) and then again after 12 and 24 weeks of treatment (16 and 28 weeks of age). At baseline and throughout the study, the reported motor dysfunction was seen in the vehicle control Line 61 transgenic mice when compared to the wild-type littermates (Figure 6A–C). A highly significant treatment benefit in three different types of beam walk was observed after 12 weeks of ASN90 treatment in Line 61 mice, which persisted to the end of the study at week 24 of treatment (Figure 6). Immunohistochemical assessment after 24 weeks of treatment indicated a statistically significant reduction of glial fibrillary astrocytic protein (GFAP) expression indicative of a reduction of astrogliosis (Figure 7A–D). Detailed biochemical (Figure 7E) quantification of GFAP immunoreactivity revealed that ASN90 treatment significantly reduced astrogliosis in the cortex of the Line 61 mice (Figure 7E; −28 and −40% mean at 30 and 100 mg/kg/day, respectively). ASN90 (30 mg/kg/day) was sufficient to restrain GFAP immunoreactivity to the same levels as the wild-type littermates. When looking at α-synuclein itself, a significant decrease in object size for pS129 immunoreactivity was seen in the hippocampus (Figures S11 and S12A) whereas total α-synuclein remained unchanged (Figures S11 and S12B).
Figure 6.

Beneficial effects of ASN90 treatment on locomotor activity of Line 61 α-synuclein transgenic mice. (A–C) Locomotor function of Line 61 mice treated with 30 and 100 mg/kg/day ASN90 was evaluated by using beam walk tests at baseline (pre-dose) and after 12 and 24 weeks of treatment. Each graph displays the number of slips [n] per group evaluated on three different types of beam (trials A, B, and C). Data are displayed as a bar graph of mean +/– SEM (n values in each column reflect the number of mice willing to traverse the beam in each trial). For statistical analysis, vehicle-treated wild-type animals and ASN90-treated Line 61 (30 and 100 mg/kg/day) were compared to the vehicle-treated Line 61 group using mixed-effect analysis followed by Bonferroni’s multiple comparison test. (*p < 0.05; **p < 0.01; ***p < 0.001).
Figure 7.

Reduction of astrogliosis in ASN90-treated Line 61 mice. Representative images of brain sagittal sections of (A) vehicle-treated wild-type mice, (B) vehicle-treated Line 61 mice, and (C) 30 mg/kg ASN90 and (D) 100 mg/kg ASN90-treated Line 61 mice. Enhanced astrogliosis (GFAP immunofluorescence) is seen in the cerebral isocortex of Line 61 mice and reduced by ASN90 treatment. Nuclei are labeled using DAPI counterstaining. Single-channel magnifications show the region indicated by the rectangle in the overview image. (E) Biochemical quantification of astrogliosis using a GFAP immunoassay reveals a dose-dependent reduction in the cortex soluble-fraction from Line 61 mice upon ASN90 treatment. Data are displayed as mean +/– SEM (**p < 0.01, ***p < 0.001 vs Tg Line 61 vehicle group, one-way ANOVA followed by the Holm–Sidak post hoc test).
To assess the pharmacodynamic response to ASN90 treatment, total protein O-GlcNAcylation was quantified in the brains of vehicle control and ASN90-treated Line 61 mice after 24 weeks of treatment. A substantial and dose-dependent increase in brain protein O-GlcNAcylation (+78 and +105% mean for 30 and 100 mg/kg/day, respectively) was observed (Figure 8A). The Line 61 mice were sacrificed at the same time point as the rats in the PK/PD study (Figure 2) (t = 4 h post-dose), indicating that the pharmacodynamic response to OGA inhibition in vivo persists at a similar level in both the acute (single administration) and chronic administration (6 months) settings.
Figure 8.

ASN90 increases total O-protein and O-GlcNAcylated α-synuclein. (A) A dose-dependent increase in global protein O-GlcNAcylation was detected in the brains of ASN90-treated Line 61 mice at 30 and 100 mg/kg/day. The data are expressed in % O-GlcNAcylation relative to the average signal obtained in the vehicle group and displayed as mean +/– SEM (***p < 0.001, ****p < 0.0001 vs vehicle, non-parametric Kruskal–Wallis followed by Dunn’s post hoc test). (B) Western blot immunostaining of α-synuclein after chemoenzymatic mass tagging. Note the increased staining of an additional α-synuclein band at higher molecular mass (approximately 30 kDa) in the presence of GalT1(Y289L) in the samples. The unmodified α-synuclein band at 15 kDa serves as internal reference. (C, D) Densitometric analysis of α-synuclein O-GlcNAcylation in ASN90-treated Line 61 mice. (C) The ratio of the 30 kDa/15 kDa α-synuclein bands reveals a 2-fold increase in O-GlcNAcylated α-synuclein migrating at 30 kDa in the brains of 100 mg/kg ASN90-treated Line 61 mice as compared to vehicle control animals. Data are expressed as % of the signal obtained in the vehicle group and displayed as mean +/– SEM (**p = 0.0041, Mann–Whitney test). (D) Expressing O-GlcNAcylated α-synuclein as % of total α-synuclein (total α-synuclein represented by the combined immunoreactivities of the 15 and 30 kDa α-synuclein bands) showed that, in vehicle-treated animals, 20% of α-synuclein is O-GlcNAcylated, which raises to 34% upon chronic treatment with ASN90 [1.7-fold increase in good agreement with panel (C)]. Data are expressed as % of total α-synuclein and displayed as mean +/– SEM (**p = 0.0041, Mann–Whitney test). Samples from seven mice of each group were randomly chosen for chemoenzymatic mass tagging and the subsequent quantifications shown in panels (C, D).
To determine whether ASN90 promotes the O-GlcNAcylation of α-synuclein in vivo, we developed a new method of addressing this question. In the absence of an antibody that specifically recognizes O-GlcNAcylated α-synuclein, we developed a chemoenzymatic mass tagging method relying on click chemistry.38 This method involves the addition of a galactose moiety modified with an azide (GalNAz) to individual O-GlcNAc residues by a mutated galactosyl-transferase enzyme [GalT1(Y289L)].39 Using click chemistry, a 5 kDa polyethylene glycol mass tag is added. O-GlcNAcylated α-synuclein can then be detected on an immunoblot as a newly appearing band with higher molecular mass than unmodified α-synuclein. A comparison of brain homogenates from vehicle and 100 mg/kg/day ASN90-treated mice that have undergone chemoenzymatic mass tagging showed that, besides the expected α-synuclein band at 15 kDa, a new band of a higher molecular mass of around 30 kDa was stained by the α-synuclein antibody in all samples that contained the GalT1(Y289L) enzyme (Figure 8B). In the absence of GalT1(Y289L), the immunoreactivity of this α-synuclein band was substantially reduced, demonstrating that it was specifically generated by chemoenzymatic mass tagging. Most importantly, the immunoreactivity for this α-synuclein species was substantially increased in the ASN90-treated samples compared to vehicle. To quantify this increase, samples from seven representative animals from the vehicle and 100 mg/kg/day ASN90 groups were processed by chemoenzymatic mass tagging and the relative immunoreactivities quantified by infrared imaging. As shown in Figure 8C, chronic treatment with 100 mg/kg/day ASN90 increased α-synuclein O-GlcNAcylation to 210%, which is comparable to the effect of the drug on total protein O-GlcNAcylation (Figure 8A). Overall, in vehicle-treated animals, 20% of total α-synuclein appeared to be O-GlcNAcylated, which increased to 34% in ASN90-treated mice (Figure 8D). Since the mass tagged α-synuclein migrates at 30 kDa and the PEG tag has a molecular mass of 5 kDa, it is likely that three discrete sites are O-GlcNAcylated in the mouse brain.
Discussion
Our data report the development of a novel, brain-penetrant, clinical-stage OGA inhibitor, ASN90. ASN90, also known as ASN120290 or ASN-561, was developed as part of a medicinal chemistry lead optimization campaign starting with hits from a high throughput screen. As a representative example of a new class of OGA inhibitors, ASN90 is chemically distinct from sugar-like substrate mimetics such as Thiamet G. The biochemical characterization of ASN90 confirmed potent, substrate-competitive inhibition (low nanomolar IC50) of the recombinant human OGA enzyme and inhibitory activity against OGA in cell lines. The ex vivo activity of ASN90 on rodent and human PBMC (including human blood) provides proof of concept that the ASN90 target engagement seen in rodents translates to humans. While Thiamet G is a potent and highly selective OGA inhibitor that is useful in assessing on-target biology,8,40 it requires treatment with very high doses and is poorly suited for use in human patients due to poor CNS penetration with a brain-to-plasma ratio of 0.1 as compared with a ratio of approximately 1 for ASN90.41 The poor CNS penetration of Thiamet G has also inspired the closely related, clinical OGA inhibitor MK-8719.41 To date, ASN90 has completed several phase 1 clinical trials in healthy human subjects.42
To assess the potential of ASN90 for treating tau-related diseases, we compared treatment effects in tau transgenic mouse models. In the rapidly progressing P301S mouse model,25 we observed significant treatment effects on PHF and NFT formation in the cortex and hippocampus. This effect required relatively high target engagement, commanding a 100 mg/kg dose, that increases O-tau by about 14-fold over baseline at the peak. While Thiamet G also required relatively high target engagement to achieve a similar effect in rTg4510 tau transgenic mice, the effect size with respect to O-tau accumulation was not quantified in that study.12 It is worth noting that the half-life of ASN90 in rodents is short (T1/2 = 2.8 h in mice), and so, increasing the dosing frequency in human studies will increase exposure and thus mitigate the requirement for such a high dose.
In agreement with the concept that the O-GlcNAcylation of tau and aggregation are exclusive,8 O-tau immunoreactivity was absent in the sarkosyl-insoluble PHF fraction. The lack of detectable effects on motor behavior in the P301S mouse model could be due to the observation that ASN90 only affected cortical and hippocampal tauopathy. With this respect, one limitation of our study was that we did not investigate effects on cognition, which with respect to neuroanatomy could potentially correlate better with the effects seen on tau tangle formation. In addition, it is also conceivable that not all functional deficits in these mice are a direct result of the overexpression of the tau transgene. This cannot be ruled out since, for the alternative Tg4510 tau transgenic mouse model,43 it has been reported that the random integration of the tau transgene itself is responsible for a considerable proportion of the reported disease phenotypes such as brain atrophy.43 In addition, the rapid progression of tauopathy in the P301S mice could be a contributor to treatment resistance. Overall, ASN90 displayed effects on tau accumulation that are in line with reports on alternative OGA inhibitors.8,11−13 Acute treatment with ASN90 also directly affected tau biology as seen by the increase in various ptau species (pS202/pT205, pS356, and pS396) in the soluble fraction of young P301S mice. It is important to note that the effect of OGA inhibition on tau phosphorylation (increase or decrease) likely depends on the targeted tau sites, the timing of treatment, and the specific tau transgenic mouse model used.11,44 Additionally, a recent report indicates that tau phosphorylation, in particular at S356, may actually inhibit tau aggregation.45
To further understand the effect of ASN90 in tauopathies, we performed subsequent studies in a slower progressing P301L mouse model.33 One specific advantage of using this model is that these mice have a tau-induced breathing deficit that can be observed by 7 months of age. With respect to the Tiffeneau index, therapeutic efficacy was provided after just 4 days of daily oral treatment with ASN90. Given that two structurally diverse OGA inhibitors (Thiamet G and ASN90) have both shown this benefit upon acute treatment, the mechanism is likely a direct result of O-GlcNAcylation in brainstem upper airway premotor neuronal populations affected by P301L tau overexpression.34,35 Consistent with this hypothesis, ASN90 was shown to increase O-tau levels in the brainstem. Given the short duration of treatment, ASN90 improved brainstem function independent of NFT pathology.33
Further supporting the notion that mechanisms other than the prevention of NFT are responsible for the therapeutic efficacy of ASN90 in P301L mice, chronic treatment revealed efficacy on both motor behavior and overall survival at both the 30 and 100 mg/kg doses in the absence of detectable effects on tau pathology. These results are in agreement with a similar study that used Thiamet G.34 The lack of detectable changes in tau pathology after chronic treatment with ASN90 is interesting and in our view could be the result of increased O-GlcNAcylation of intracellular proteins other than tau. Alternatively, the enhanced survival of ASN90-treated animals could have confounded the assessment of tau pathology. Our interpretation of the data obtained in the two different tau transgenic mouse models is that, due to the specific genetic makeup of each tau transgenic mouse line, cross-comparisons are difficult. Taken together, ASN90 showed functional benefits and both acute and chronic effects on tau pathology that are in line with data reported by others.8,11−13
Given the central role of O-GlcNAcylation in a number of biological processes mediated by neuronal substrate proteins,46 it can be predicted that, besides direct effects on tau and α-synuclein proteins, additional beneficial mechanisms are likely at work. Increasing O-GlcNAcylation through pharmacologic OGA inhibition has been shown to reduce epileptic seizures,5 protect against ischemia and ischemia-reperfusion-induced brain injury,47 directly regulate neurotransmission,48 and improve cognitive function.49 Overall, these data support the hypothesis that OGA inhibition decreases aberrant neuronal excitation and protects neurons from stress and injury. This hypothesis is supported by our observation that treatment of both P301L and Line 61 transgenic mice produced clinically relevant functional benefits that were out of proportion to changes in tau and α-synuclein pathology.
Chronic treatment of Line 61 mice with ASN90 persistently increased total O-protein and α-synuclein O-GlcNAcylation by a similar magnitude. Importantly, chronic treatment with ASN90 did not lead to an attenuation of the pharmacodynamic drug response. Given the delicate equilibrium between OGA and OGT enzyme activities and the anticipated chronic treatment in patients, these data are encouraging and suggest that ASN90 durably increases O-GlcNAcylation. Regarding α-synuclein, ASN90 reduced the appearance of pS129 immunoreactivity in the hippocampus as detected by immunohistochemistry. This specific post-translational modification has been closely linked to the aggregation of α-synuclein. pS129 α-synuclein specifically accumulates in Lewy bodies,50 and plasma pS129 α-synuclein has been reported as a biomarker for motor severity and disease progression in PD.51 Since S129 has not been characterized as a site for O-GlcNAcylation, it is unlikely that ASN90 treatment promoted competing O-GlcNAcylation at this site.
The most prominent effect on corresponding Line 61 mouse brains was a global reduction in astrogliosis/GFAP expression as detected both by immunohistochemistry and a sensitive immunoassay. Astrogliosis was previously linked to O-GlcNAcylation since a forebrain-specific knockout of the OGT enzyme caused enhanced neuroinflammation including astrogliosis.52 Also, aging in general leads to a loss of OGT expression in rodents that contributes to cognitive decrease49 and reduced O-GlcNAcylation during aging appears to promote a glial fate switch of neuronal stems cells in mice.53 In the Line 61 mice, astrogliosis was a direct result of the α-synuclein transgene expression since it was absent in the age-matched wild-type littermates that were treated with vehicle. It is conceivable that, similar to the therapeutic benefit mediated by increasing O-GlcNAcylation in an aging rodent brain,49 ASN90 provides protection against the toxic insults from α-synuclein overexpression. In part, this may be due to the direct effect of increased α-synuclein O-GlcNAcylation but most likely also involves additional protective mechanisms mediated by other substrates of OGA. It is worth noting that, in an independent study, upregulating O-GlcNAcylation using either genetic means or pharmacological inhibition mitigated synaptic deficits, motor deficits, and neurodegeneration in an α-synuclein AAV virus (A53T) injection model of PD.19 Looking for an overarching mechanism that targets both tau and α-synuclein at the molecular level, the reported enhancement of anti-amyloid chaperone activity of small heat shock proteins (sHSP) such as HSP27 by O-GlcNAcylation54 could potentially provide such a link.
The preclinical data reported in this manuscript provide robust justification for both acute and chronic effects of ASN90 on the symptoms, pathology, and disease progression in both tau and α-synuclein models.46,55 While we did not assess β-amyloid (Aβ), recent reports have shown that OGA inhibition may also modulate Aβ pathology and mediate acute improvements in cognition in the intracerebroventricular Aβ injection model.7 These data justify the exploration of early clinical outcome measures and tau fluid biomarkers as potential biomarkers of target engagement in early phase clinical trials.
Chronic administration of ASN90 in both tau and α-synuclein models produced disease-modifying effects, including reduced astrogliosis, improved motor function, and increased survival. While these benefits were out of proportion to changes in tau and α-synuclein pathology, they nevertheless demonstrate that ASN90 and OGA inhibition more broadly are able to modify the progression of multiple neurodegenerative disease models through mechanisms that may be independent of effects on tau and α-synuclein aggregation. This may be an advantage in human neurodegenerative diseases, where multiple protein misfolding pathologies often co-exist. The tau (MAPT) H1 haplotype appears to increase the risk for PD,56 although a recent study reported that putative ectopic regulatory interactions in neurons may rather confer this disease association.57 The strongest link comes from carriers of mutations in the leucine-rich repeat kinase 2 (LRRK2) gene. LRRK2 mutations are the most common cause of familial PD and LRRK2 carriers that have prominent tau pathology.58 The intricate relationship between α-synuclein and AD pathology has been well documented in the past decades of research. α-Synuclein was initially identified as the non-amyloid beta/A4 protein component (NACP) of senile plaques,59 and Lewy bodies are frequently observed as co-pathology in AD.60 α-Synuclein expression can even modulate Aβ pathology in preclinical mouse models.61 Thus, OGA inhibition stands in contrast to—and may complement—monoclonal antibodies, antisense oligonucleotides, and protein degradation technologies that target a single disease pathology (e.g., misfolded tau, β-amyloid, or α-synuclein).
Taken together, these independent discoveries strengthen the rationale for developing OGA inhibitors as therapeutics for multiple intracellular proteinopathies. Their unique properties make OGA inhibitors promising drug candidates for AD and PD given the close association between tau and α-synuclein pathologies. Considering that ASN90 is a clinical stage molecule that has completed phase 1 testing,42 the preclinical data reported herein are of immediate relevance to clinical development. Acknowledging the slow progress in the development of new drugs for AD, combination therapy has been generally heralded as the most appropriate means to address the complex pathophysiology of the disease.62 OGA inhibitors may provide this in form of a single modality, which due to their multipronged mechanism of action can simultaneously modulate several pathologies and biological pathways.
Methods
Key Reagents
ASN90 is a new chemical entity with the chemical name (S)-N-(5-(4-(1(benzo[d][1,3]dioxol-5-yl)ethyl)piperazin-1-yl)-1,3,4-thiadiazol-2-yl)acetamide (or its hydrochloride salt as used for in vivo studies). LSN3316612 (N-(5-(((2S,4S)-2-methyl-4-(6-fluoropyridin-2-yloxy)piperidin-1-yl)methyl)thiazol-2-yl) acetamide) is a chemical that specifically binds to OGA and has been already characterized.24
In Vitro Assays
Cell-Free OGA and Inhibitor Cross-Competition Enzyme Kinetics Assays
The OGA assay was carried out at room temperature (RT) in 384-well plates using 20 nM His-tagged recombinant O-GlcNAcase in McIlvaine citrate–phosphate buffer containing 140 mM NaH2PO4 and 30 mM citric acid (pH 6.5) in the presence of 10 μM fluorescein mono-β-d-N-acetylglucosamine (Marker Gene Technologies, M-1485) as a fluorogenic substrate. Increasing concentrations of OGA inhibitors were added to the enzyme prior to the addition of the substrate. The generation of free fluorescein was measured on a Pherastar Fluorescence plate reader (Ex/Em: 485/520 nm), and the data were plotted using standard curve fitting algorithms for sigmoidal dose–response curves using the GraphPad Prism software. Inhibitor cross-competition assays were carried out by adding increasing concentrations of Thiamet G to the enzyme in the presence of various fixed concentrations of ASN90 (0, 4, 14, and 44 nM), prior to the addition of the substrate.
Hexosaminidase A and B Assays
The specificity against hexosaminidases A and B was determined by incubating increasing ASN90 concentrations in McIlvaine citrate–phosphate buffer (pH 4.5) in the presence of a 10 μM fluorogenic substrate and 20 nM recombinant HexA (Origene, TP303185; Table 1) or a fraction purified from human placenta (Sigma-Aldrich, A6152-5UN) containing Hex subunits A and B (HexA/B). The non-selective glycoside hydrolase inhibitor PUGNAc served as a control.
Table 1. Antibodies/Recombinant Proteins Used in This Work.
| antibodies/recombinant proteins | source | catalogue no. |
|---|---|---|
| Alexa 555-conjugated donkey anti-rabbit antibody | Abcam | ab150066 |
| Alexa 647-conjugated donkey anti rat antibody | Jackson ImmunoResearch | 712-605-153 |
| Alexa 750-conjugated donkey anti-goat antibody | Abcam | ab175745 |
| biotinylated rabbit monoclonal O-tau (Ser400) | in-house | |
| biotinylated mouse monoclonal anti-tau (HT7) | Thermo Fisher Scientific | MN1000B |
| biotinylated mouse monoclonal anti-GFAP | Synaptic Systems | 173211BT |
| biotinylated wheat germ agglutinin (WGA) | Vector Labs | B1025 |
| goat polyclonal anti-GFAP | Abcam | ab53554 |
| His-tagged recombinant human O-GlcNAcase | in-house | |
| HRP-labeled goat anti-mouse antibody | DAKO | P044701-2 |
| IRDye 680RD goat anti-mouse IgG secondary antibody | LI-COR Bioscience Inc. | 926-68070 |
| IRDye 680RD goat anti-rabbit IgG secondary antibody | LI-COR Bioscience Inc. | 926-68071 |
| IRDye 800CW goat anti-rabbit IgG secondary antibody | LI-COR Bioscience Inc. | 926-32211 |
| IRDye 800CW goat anti-mouse IgG secondary antibody | LI-COR Bioscience Inc | 926-32210 |
| mouse monoclonal anti-actin (clone C4) | Merck Millipore | MAB1501 |
| pan O-GlcNAc monoclonal antibody RL2 | Thermo Fisher Scientific | MA1-072 |
| phospho-tau (Thr212, Ser214) monoclonal antibody (AT100) | Thermo Fisher Scientific | MN1060 |
| phospho-tau (Ser356) monoclonal antibody | Abcam | ab75603 |
| phospho-tau (Ser396) monoclonal antibody | Invitrogen | 44-752G |
| purified hexosaminidase A/B from placenta | Sigma-Aldrich | 6152-5UN |
| rabbit monoclonal anti-MGEA/OGA | Abcam | Ab124807 |
| rabbit polyclonal anti-OGT | Abcam | Ab96718 |
| rabbit monoclonal anti-OGT | Cell Signaling | 24083 |
| rabbit anti-actin (13E5) | Cell Signaling | 4970 |
| rabbit monoclonal anti-pSer129 human α-synuclein (EP1536Y) | Abcam | ab51253 |
| rat monoclonal anti-GFAP (clone 2.2B10) | Invitrogen | 13-0300 |
| rat monoclonal anti-human α-synuclein (15G7) | Enzo Life Sciences | ALX-804-258 |
| recombinant human hexosaminidase (HEXA) | OriGene | TP303185 |
| SULFO-TAG-labeled goat anti mouse antibody | Meso Scale Discovery | R32AC-1 |
| SULFO-TAG-labeled anti ptauS202/T205 (AT8) | Thermo Fisher Scientific | MN1020 |
| SULFO-TAG-labeled goat anti rat antibody | Meso Scale Discovery | R32AH-1 |
| SULFO-TAG-labeled anti-tau (Tau-5) | Covance | SIG 39413 |
| SULFO-TAG-labeled anti-tau | DAKO | A0024 |
Substrate Competition and Reversibility Assay
For substrate competition, enzyme velocity was measured in the same McIlvaine buffer described above using increasing concentrations of 4-methylumbelliferyl N-acetyl-β-d-glucosaminide or 4 MU-NAG (Sigma-Aldrich, 69585) as the substrate in the presence of various concentrations of ASN90. During incubation of the plate for 60 min in the dark, the fluorescence was quantified every 2 min on a Pherastar fluorescence reader (Ex/Em: 350/450 nm). The enzyme kinetics data were plotted using the Lineweaver–Burk transformation to determine Vmax and Km for each concentration of ASN90. For the reversibility assay, the His-tagged OGA enzyme was pre-incubated for 1 h at RT with increasing ASN90 concentrations. The fluorogenic substrate for determination of enzyme activity was added to either undiluted or diluted (1:3 and 1:5) preincubation reactions.
Ex Vivo Whole Human Blood Assay
All research involving blood sampling from human subjects was approved by the local ethics legislation of Canton de Vaud, Switzerland. Each volunteer signed a written consent form allowing for the use of their blood for research purposes. Fresh, heparinized human blood was incubated with increasing concentrations of ASN90 for 2 h under continuous rolling at 37 °C, 5% CO2. After incubation, the peripheral blood mononuclear cells (PBMC) were isolated by density gradient centrifugation with Ficoll63,64 using 15 mL Sepmate tubes (Stemcell Technologies, 15420) and according to the manufacturer’s instructions. Briefly, samples were diluted with an equal volume of PBS and 2% fetal bovine serum (FBS) and mixed gently. The diluted blood was layered onto a Ficoll solution (GE Healthcare, 17-1440-02) and centrifuged at 1200g for 10 min. The top layer, which contained the enriched PBMC, was poured off into a new tube containing 8 mL of PBS and 2% FBS and centrifuged at 800g for 10 min at 37 °C. The PBMC were washed twice with 2 mL of PBS by centrifugation at 400g for 10 min. After the last centrifugation, the supernatant was discarded and the PBMC were snap-frozen for storage at −80 °C. To quantify total O-protein, the PBMC pellets were solubilized in lysis buffer [50 mM Tris–HCl pH 7.4, 150 mM NaCl, 1% Triton X-100, 0.1% SDS, 0.2% sodium deoxycholate + PI]. The level of total protein O-GlcNAcylation was quantified in PBMC samples using a sandwich O-protein immunoassay. For this, multiarray 96-well avidin Mesoscale plates (MSD, L15AA-1) were blocked for 1 h with 50 μl/well of MSD blocker A solution (MSD, R93AA-2) followed by coating with 50 μL (5 μg/mL) of biotinylated wheat germ agglutinin, WGA (Vector Biology, B1025) in PBS-T (PBS pH 7.4, 0.2% Tween 20) + 2% BSA. After 1 h of incubation at RT, the plates were incubated overnight at 4 °C with 50 μL of the PBMC cell lysate (60 μg protein). After washing, the plates were incubated for 2 h at RT under light protection with 50 μL of the pan O-GlcNAc monoclonal antibody RL2 (1:1000 dilution) mixed with a SULFO-TAG-labeled goat anti-mouse antibody in PBS-T + 2% BSA. After a final wash, the plates were read on a Sector Imager 6000.
Cellular O-Protein/O-Tau Assays
HEK293 cells stably transfected with wild-type human tau441 [2N4R tau21] were plated in 96-well plates (Thermo Fisher Scientific, 07-000-162) at a density of 100,000 cells/well and then incubated for 16 h at 37 °C with increasing concentrations of ASN90 in 0.3% DMSO final concentration. On the following day, the cells were washed with PBS and lysed in RIPA buffer [25 mM Tris–HCl pH 7.6, 150 mM NaCl, 1% NP-40, 1% sodium deoxycholate, 0.1% SDS + protease inhibitor, PI (Roche, 11836145001)]. O-Tau and O-GlcNAcylated proteins present in the cell lysates were quantified by immunoassays according to the following procedure. HEK293 tau cell lysates (25 uL/well, 1/300 dilution) were directly coated into each well of multiarray 96-well high bind Mesoscale plates (MSD, L15XB-3) and incubated overnight at 4 °C. After three washing steps with PBS-T + 2% BSA, the plates were blocked with MSD blocker A solution for 1 h at RT under agitation. After washing, the plates were incubated for 1 h at RT with 25 μL/well of the pan O-GlcNAc monoclonal antibody RL2 (Thermo Fisher Scientific, MA1-072) that specifically recognizes O-GlcNAc when attached to proteins.20 For detection, a SULFO-TAG-labeled goat anti-mouse secondary antibody (MSD, R32AC-1) was added into each well followed by 1 h of incubation under light protection. After a final wash with the MSD read buffer (MSD, R92TC-1), the plates were read on an MSD Sector Imager 6000. To quantify O-tau, a multiarray 96-well avidin Mesoscale plate (MSD, L15AA-1) was, after blocking, precoated with 25 μL (2.5 μg/mL) of the biotinylated rabbit monoclonal O-tau (Ser400) antibody described by Cameron et al.21 Then, 50 μL/well of the HEK293 tau cell lysate was transferred into each well followed by 16 h of incubation at 4 °C. After three washing steps with PBS-T, a 25 μL/well SULFO-TAG-labeled anti-tau polyclonal antibody (DAKO, A0024) was added followed by 1 h of incubation at RT under light protection. Finally, after a final wash, the plates were read using the MSD Sector Imager 6000.
In Vitro PBMC Cell-Based Assay
The potency of ASN90 was also determined in isolated and plated human (h) and/or rat (r) PBMC. After isolation following the Ficoll density gradient method, human and/or rat PBMC were plated in 96-well plates (Thermo Fisher Scientific, 07-000-162) at a density of 200,000 cells/well and incubated in the presence of increasing concentrations of ASN90 for 4 h at 37 °C. Protein O-GlcNAcylation was quantified by using the O-protein immunoassay described above.
Biochemical Analyses
Protein Determination
Protein concentrations were determined in brain samples (homogenates and soluble fractions) by using a bicinchoninic acid (BCA) protein assay kit (Pierce, Rockford, IL 23225) according to the manufacturer’s instructions. If not otherwise stated for all quantitative immunoassays, equal amounts of protein were loaded into each well.
In Vivo Studies
PK/PD Study in Wild-Type Rats
PK/PD rat studies were performed at the facilities of the Center of Phenogenomics, EPFL Switzerland, with approval by the Swiss Federal and Cantonal Veterinarian offices (license VD3179). The animals (wild-type Wistar rats) were housed in ventilated cages and GM1500 and had access to food and pre-filtered sterilized water “ad libitum”. Thirty-six male Wistar rats of 6 weeks of age (n = 6/group) were orally administrated with different doses of ASN90 in vehicle (0.5% HPMC/0.25% Tween 20). The animals were sacrificed 4 h post-administration by decapitation to collect brain tissues, blood, and cerebrospinal fluid (CSF) according to the following procedure. After deep anesthesia with pentobarbital, 50 μL of CSF was collected from the cisterna magna and 4 mL of blood was taken by cardiac puncture with Sarstedt tubes containing 35 IU of Heparin. Heparinized blood (400 μL) was used for the isolation of rat PBMC following the standard procedure with Ficoll density gradient as described above. Heparinized blood (100 μL) was centrifuged at 3800g for 10 min to isolate the plasma, which was stored at −80 °C for PK analyses. After brain dissection, the right frontal lobe of the cortex was homogenized using Precellys tubes (VWR, 432-3752) in ice-cold Cytobuster reagent buffer (Merck, 71009) with PI. The left frontal cortex was directly snap-frozen in dry ice and stored at −80 °C for PK analyses. The brain tissue homogenate was submitted to a first centrifugation at 18,000g for 15 min, 4 °C. Finally, the resulting supernatants were submitted to an ultracentrifugation (100,000g, 60 min, 4 °C) to isolate the soluble fraction of the cortex. After protein determination (BCA), O-protein was quantified in brain-soluble fractions and in PBMC cell lysates by using the O-protein immunoassay. ASN90 concentrations present in the brain, CSF, and plasma were quantified using the following bioanalytical methodology. Plasma and CSF samples were processed by protein precipitation. The sample (50 μL) was mixed with 150 μL of acetonitrile containing an internal standard (0.5 μg/mL Tolbutamide) on a vortex mixer for 5 min. After centrifugation for 10 min at 3800g, the supernatant was transferred into 96-well LC–MS/MS sample plates for analysis. The brain tissue was homogenized in PBS, pH 7.4 (1 g of tissue in 5 mL of buffer) using a bullet blender at 4 °C. A sample of 50 μL of each homogenate was processed as described for plasma above by protein precipitation. Samples were analyzed by the LC–MS/MS system consisting of Nexera UHPLC (Shimadzu) coupled to an AB Sciex API 4000 mass spectrometer. Samples were separated using a Phenomenex Synergi polar RP 80A (75 × 2 mm, 4 μm) column with a mobile phase (MP) consisting of 0.1% formic acid in Milli-Q water (A) and 0.1% formic acid in 100% acetonitrile (B). The MS instrument was operated in positive mode (ESI+). Multiple reaction monitoring (MRM) transitions were selected for the test and reference compounds (Tolbutamide) for the LC–MS/MS analysis. For analysis, 5 μL of the processed sample was injected into the LC–MS/MS instrument. The collected data were analyzed using the Analyst 1.6.1 software. The lower limit of quantitation (LLOQ) of this method to quantify ASN90 in the plasma, CSF, and brain samples was 1 ng/mL (calibration range of 1–10,000 ng/mL). The accuracy of back-calculated standards as well as QC samples was within ±15%.
In Vivo Positron Emission Tomography (PET) Study
In vivo PET imaging studies were performed at Invicro, Hammersmith Hospital, London (UK) in accordance with the U.K. Animals (Scientific Procedures) Act 1986 and the transposed EU directives 2010/63/EU. The procedures used were approved by the Imperial College Animal Ethical Review Committee. The preparation of the radiotracer was prepared as previously described.24 In brief, LSN3316612 (N-(5-(((2S,4S)-2-methyl-4-(6-fluoropyridin-2-yloxy)piperidin-1-yl)methyl)thiazol-2-yl)acetamide) was radiolabeled using a GE FASTlab synthesizer (GE Healthcare) by adding a solution of the corresponding nitro precursor LSN3316612(N-(5-(((2S,4S)-2-methyl-4-(6-nitropyridin-2-yloxy)piperidin-1-yl)methyl)thiazol-2-yl)acetamide) to the dried complex [18F]KF/Kryptofix (previously prepared on a Siemens RDS-111 Eclipse cyclotron) followed by heating at 130 °C for 15 min. The diluted crude reaction was separated onto the semi-prep Agilent Eclipse XDB C8 HPLC column (5 μm, 250 × 9.5 mm) at a flow rate of 5 mL/min eluted with MeCN:0.02 M ammonium acetate solution (33:67 v/v). Adult male Wistar rats (n = 6) were surgically cannulated and placed on a bed in a Siemens Inveon DPET with a docked multimodality CT scanner with isoflurane anesthetic delivery and scavenging. The body temperature was maintained using a heating mat and monitored using a rectal probe. The respiration rate was monitored with a respiration pad. Approximately 100 IU heparin sodium was given i.v. prior to the scans to aid blood sampling. The brain was placed in the field of view of the scanner, and a CT scan was acquired for attenuation and scatter correction. A 60 min baseline dynamic PET scan was carried out after the intravenous administration of 5–15 MBq of [18F]LSN3316612. An intravenous (i.v.) bolus dose of ASN90 was given, and a second dynamic PET scan (post-dose scan) with [18F]LSN3316612 was carried out. The doses of ASN290 and time of administration prior to the post-dose scan were based on existing and preceding data. Blood samples were taken at three separate time points prior to and after the start of the second PET scan at 0, 30, and 60 min for drug level measurement. The PET images were acquired in list mode and reconstructed with increasing time frame over the duration of the scan to characterize the radiotracer kinetics. Image processing and data analysis were performed using VivoQuant and MIAKA, an in-house computational pipeline implemented in MATLAB. One-tissue and two-tissue compartmental models, Logan graphic analysis, and MA1 (Multilinear Analysis 1) were explored and used to generate volume of distribution (VT) estimates. Lassen graphical interpretation of the changes in VT from the most suitable model MA1 (20 min) between the baseline and post-dose scans provided an estimate of ASN90 occupancy. The relationship of the plasma-PK and occupancy data was fitted to an appropriate Emax model to estimate the Occ50 of ASN90.
In Vivo Studies in Tau Transgenic Mice
In vivo studies using tau transgenic mice (hTauP301S and hTauP301L) were conducted in accordance with the EU directive 2010/63/EU for animal well-being using protocols approved by the ethical committee (operating under approval number LA1210532) in Belgium. Transgenic mice were housed in reMYND SPF facilities in individually ventilated (IVC) makrolon T2 cages equipped with solid floors, a layer of corncob bedding, and cocoons as nesting materials. Mice had access to standard mouse chow and pre-filtered sterile water ad libitum. The homozygous hTauP301S-Tg model25 used in this study consists of the F1 progeny from a cross between two homozygous hTauP301S-Tg parental mice in the C57Bl/6JxCBA/ca background. The hTauP301S-Tg model is characterized by an early onset of tau pathology in the brain and spinal cord, starting at the age of 3 months and displaying a progressive age-dependent increase in Tau hyperphosphorylation in the spinal cord, brainstem, cerebral cortex, and hippocampus from 3 months onward.65
To study the chronic effect of ASN90 on tau pathology, 45 homozygous female hTauP301S mice (2 months of age) were treated every day for 3.5 months either with vehicle (0.5% HPMC/0.25% Tween 20) or with ASN90 (30 or 100 mg/kg; n = 15 per group). Twenty-four hours after the last compound administration, the mice were anesthetized with a mixture of ketamine, xylazin 2%, atropine, and saline (4:2.5:1:2.5) and were flushed transcardially with ice-cold saline at 4 °C to remove blood from the brain vessels. The brain was removed and divided into the left and right hemisphere by using a midline sagittal cut. The right hemisphere (including the cerebellum and brainstem) was post-fixed overnight in PBS containing 4% paraformaldehyde for histology analysis. After micro-dissection of the left hemisphere into the cortex and hippocampus, tissue samples were immediately frozen at −80 °C until further biochemical analyses of the soluble and sarkosyl-insoluble tissue fractions. The methodology of Greenberg and Davies30 with few modifications exploited this fractionation.31 In brief, cortex and hippocampus tissues were homogenized in 10% wt/vol of ice-cold PhosphoSafe reagent buffer (Merck Millipore, 71296-4) with protease inhibitor cocktail to obtain a crude tissue homogenate (S0). Homogenates (300 μL) were spun at 80,000g at 4 °C for 20 min to obtain the supernatants S1 (soluble fraction) and the pellets P1. The P1 pellets were homogenized in 5% wt/vol of sucrose extraction buffer (10 mM Tris–HCl pH 7.4, 0.8 M NaCl, 10% sucrose, protease inhibitors) and spun at 4000g at 4 °C for 20 min. The resulting supernatants were incubated for 1 h at 37 °C in the presence of 1% sarkosyl (final concentration) before ultracentrifugation at 80,000g at 4 °C for 1 h. Finally, the resulting pellets (sarkosyl-insoluble fractions or P3 pellets) were either resuspended in 50 μL of NuPAGE LDS sample buffer (Thermo Fisher Scientific, NP0007) for western blot or in 50 μL of TBS (10 mM Tris–HCl pH 7.4, 0.8 M NaCl + PI) for quantitative analyses of O-GlcNAcylated proteins and O-tau by using our MSD immunoassays described previously. In addition, total tau was quantified in the S0 fractions (hippocampus and cortex) of hTauP301S Tg mice by the MSD immunoassay with the biotinylated mouse monoclonal anti-tau HT7 (Thermo Fisher Scientific, MN1000B) capture antibody and SULFO-TAG-labeled Tau-5 antibody as the detection antibody. Tau phosphorylation (AT8) at position Ser202/Thr205 (following the numbering of the longest 2N4R adult isoform, Tau441) was quantified in the S0 and P3 fractions (hippocampus and cortex) of hTauP301S Tg mice using an MSD immunoassay with the biotinylated HT7 capture antibody followed by detection with the SULFO-TAG-labeled AT8 (Thermo Fisher Scientific, MN1020) antibody. Tau phosphorylations at positions Ser356 and Ser396 were quantified in the P3 fraction (hippocampus and cortex) of hTauP301S Tg mice using a direct MSD immunoassay with anti-phospho tau antibodies ptauSer356 (Abcam, ab75603) or ptauSer396 (Invitrogen, 44-752G) as detection antibodies.
For western blot analyses, 20 μg of proteins of the soluble brain fraction (S0) and 10 μL of the sarkosyl-insoluble fraction (P3) from the cortex of hTauP301S mice were resuspended in NuPAGE LDS sample buffer, heated at 70 °C for 10 min, and separated on 4–12% Bis-Tris SDS-PAGE gels followed by wet transfer onto nitrocellulose membranes. After Ponceau S staining to assess equal loading, membranes were blocked in LI-COR Odyssey blocking buffer (LI-COR Bioscience Inc., 927-60001) and probed with the rabbit monoclonal O-tau (Ser400) antibody at 1:1000, the mouse monoclonal anti-ptauSer202/Thr205 (AT8) antibody at 1:1000, or the mouse monoclonal anti-tau (HT7) antibody at 1:20,000 dilution overnight at 4 °C. The membranes were washed with TBS-T and incubated with the IRDye 680RD goat anti-mouse IgG secondary antibody (LI-COR Bioscience Inc., 926-68070) or with the IRDye 800CW goat anti-rabbit IgG secondary antibody (LI-COR Bioscience Inc., 926-32211) for 1 h at room temperature and protected from light. After extensive washing in TBS-T, membranes were scanned on a LI-COR Odyssey infrared imager (LI-COR Bioscience Inc.) for quantification. For pathological analyses, 20 serial free-floating sagittal sections for each animal (40 μm thickness) were cut on a vibratome and kept for histological and immunohistological staining. Sets of five sections per mouse (each separated by 160 μm) and comprising the region of interest (hippocampus-dentate gyrus) were silver-impregnated following the method of Gallyas–Braak to visualize filamentous tau pathology.66,67 For immunohistochemistry, the sections were incubated with AT8 or with AT100, a mouse monoclonal anti-ptauThr212/Thr214 (Thermo Fisher Scientific, MN1060) at a concentration of 0.05 μg/mL in PBS-T with 10% FCS. After rinsing, the sections were incubated with a goat anti-mouse peroxidase-labeled secondary antibody (DAKO, P044701-2) at a concentration of 1/500 in PBS-T + 10% FCS. The signal was developed with 3,3′-diaminobenzidine tetrahydrochloride (DAB, one tablet per 10 mL of Tris–HCl with 3 μL of H2O2 per 10 mL). Images were acquired with an Olympus BX41 microscope equipped with a XC30 3M pixel 1/1.8″ cooled Olympus CCD camera and analyzed with a computer using AnalySIS FIVE (Olympus CellSens) software. For each staining, typically, five brain sections per mouse were included in the analysis and the mean value (number of positive neurons/mm2) was determined for each animal in the selected brain region. Statistical analysis was performed using one-way ANOVA followed by Dunnett’s post hoc test comparing vehicle- to ASN90-treated groups.
Finally, the acute effect of ASN90 on tau phosphorylation was also investigated in hTauP301S mice. For this, 42 female homozygous female hTauP301S mice (2 months of age) were treated every day either with vehicle (0.5% HPMC/0.25% Tween 20) or with ASN90 (30 or 100 mg/kg/day) for 4 days (n = 6 per group). The animals were then sacrificed at 4, 8, or 24 h after the last compound administration. After brain dissection and homogenization, protein O-GlcNAcylation and O-tau and tau phosphorylation were quantified in the brain-soluble fraction (cortex) by the MSD immunoassay as described above.
In Vivo Functional Studies in hTauP301L Mice
The homozygous hTauP301L-Tg model33 consists of the F1 progeny from a cross between two homozygous hTauP301L-Tg parental mice in the FVB/N background. The hTauP301L transgenic mice start accumulating hyperphosphorylated tau at the age of 6 months, although with a high variability of onset. They also suffer from motoric defects like fore and hindlimb clasping, reduced general mobility, and die prematurely at 8–11 months of age.33 Therefore, the premature death in this model appears to be directly linked to tau pathology (clasping phenotype).
The effect of a chronic treatment with ASN90 on the motoric function and the survival of hTauP301L mice was investigated using the clasping test. For this, 90 homozygous female hTauP301L mice (3.5 months of age) were treated every day for 6 months either with vehicle (0.5% HPMC/0.25% Tween 20) or ASN90 (30 or 100 mg/kg; n = 30 per group) and the animals were sacrificed 4 h after the last compound administration. From the age of 7.1 months onward, clasping severity was assessed daily until sacrifice. For this, the hTauP301L mice were kept approximately 1.5 cm above their tail base for about 10 s (tail suspension test). Clasping of the limbs was scored for each limb separately using the four-point rating scale. Hind limb clasping was scored according to
0 = hindlimb folded backwards and distant from the body, angle of the limb with the body axis >0° (at least once during the screened time window).
0.5 = any phenotype in between 0 and 1 (starting from 100% of time fully stretched but in line (= 0°) with the body axis).
1 = one hindlimb partially retracted during more than 50% of the time.
3 = limb completely retracted during more than 50% of the time.
Left and right hindlimb scores unified in one clasping score were used for evaluation of clasping evolution throughout treatment and assessment of group differences at study termination.
Forelimb clasping was scored according to
0 = limb stretched and distant from the body.
1 = limb is partially retracted during more than 50% of the time.
3 = limb is completely retracted, immobile, muscle loss.
Stage 4 corresponds to a stage where a mouse has died or has been prematurely sacrificed after reaching the severe clasping stage wherein humane end point criteria are met. Forelimb scores were applied to determine humane end points and sacrifice decisions (see the “sacrifice” criteria below). The weekly average clasping score of each animal was calculated for each treatment group. Statistical analysis was performed using two-way RM ANOVA followed by Dunnett’s post hoc testing (comparing the vehicle group with both ASN 90 treatment groups).
For survival analysis, hTauP301L mice showing a severe clasping phenotype (forelimb reaching stage 4) resulting in weight loss below 20% of the maximum body weight during study in combination with a body temperature drop below 34 °C, or in the case of weight loss till below 17 g of body weight or were not able to get up within 5 s when put on either side in the home cage, were sacrificed before general study termination (so-called premature sacrifice). Statistical analyses were performed using a log-ranked (Mantel–Cox) test comparing vehicle- to ASN90-treated groups.
The effect of an acute treatment with ASN90 on the breathing function of hTauP301L mice was investigated using the flexiVent FX system (SCIREQ Inc.) equipped with an FX1 module with a mice adapter (NPFE extension) and operated by the flexiWare v7.2 software. For this, 30 female hTauP301L mice (7 months of age) were treated every day for 4 days with vehicle (0.5% HPMC/0.25% Tween 20) or ASN90 at 30 or 100 mg/kg/day (n = 10 per group). On the fourth day and 2 h after the last compound administration, mice were anesthetized with an intraperitoneal (i.p.) injection of pentobarbital sodium (±120 mg/kg; Dolethal, Vétoquinol). Once a surgical plane of anesthesia was reached, the trachea was exposed to insert an 18-gauge metal cannula having a typical resistance of 0.3 cm H2O·s/mL. Mice were quasi-sinusoidally ventilated with a tidal volume of 10 mL/kg, a frequency of 150 breaths/min, an inspiratory-to-expiratory ratio of 2:3, and a positive end-expiratory pressure of 3 cm H2O. An NPFE maneuver was performed to obtain an FV loop and the FE-related parameters. This was done by first inflating the lungs to a pressure of +30 cm H2O over 1.2 s and then rapidly exposing the mouse’s airways to a negative pressure of −55 cm H2O to generate an imposed negative expiratory pressure gradient. From the FE parameters, the forced expiratory volume and flow at 0.1 s (FEV0.1) and 0.2 s (FEV0.2), forced vital capacity (FVC), and peak expiratory flows (PEF) were considered as well as the FEV0.1/FVC (Tiffeneau index at 0.1 s) and FEV0.2/FVC (Tiffeneau index at 0.2 s). All data were exported in excel format and analyzed by Graphpad 8.2 software. Statistical analyses were performed using one-way ANOVA followed by Dunnett’s post hoc (comparing the vehicle group with both ASN90 treatment groups).
In Vivo Chronic Study in α-Synuclein Transgenic Line 61 Mice and Wild-Type Littermates
In vivo studies using the Line 61 α-synuclein transgenic mice were performed at the QPS Austria animal facility, which is fully accredited by the Association for Assessment and Accreditation of Laboratory Animal Care (AAALAC). All procedures in this study complied with the Animal Care and Welfare Committee. Animals had access to dried, pelleted standard rodent chow and normal tap water ad libitum. The effect of a chronic treatment with ASN90 on the locomotor activity of Line 61 mice was investigated by the beam walk test. For this, a total of 48 male Line 61 mice (1 month of age) as well as 16 non-transgenic age- and sex-matched littermate controls were randomly allocated to four groups of 16 animals per group. Animals were dosed once daily (oral gavage) with either vehicle (0.5% HPMC/0.25% Tween20) or ASN90 (30 or 100 mg/kg/day) for a total of 24 weeks. The beam walk test was performed to assess the treatment benefits with ASN90 on the motoric function, while histological and biochemical analyses were performed to evaluate the effect of ASN90 on the histopathology.
Beam Walk Test
Motor coordination and balance of the mice were evaluated by the beam walk test at three different time points of the study: at baseline before treatment (week 0), at week 12 (interim results), and week 24 (at the end of treatment). This test measured the ability of the mice to traverse a graded series of narrow beams to reach the home cage. The beams were long strips of wood (1 m) with a 20 mm (only used for training trial), 13 mm (trial A), and 10 mm (trial B) square cross-section or a 16 mm (trial C) round diameter. The beams were placed horizontally, 50 cm above the surface, with one end mounted on a narrow support and the other end attached to the home cage into which the mouse can escape. Three training trials were performed prior to testing with three different starting points on the 20 mm square beam: proximity to the home cage (trial 1), in the center of the beam (trial 2), and at the brightly illuminated end of the beam (trial 3). Once the mice were trained, they received consecutive testing trials on each of the three different beams progressing from the widest to the narrowest beam. The testing trials were videotaped and subsequently evaluated with an Observer XT 10.5 (Noldus). The latency to traverse each beam and the number of slips [n] off each beam were recorded and reported for each trial. A mouse not willing to traverse the beam was not considered into a given trial (A, B, or C). Statistical analyses were performed using GraphPad Prism version 8.02 for Windows (GraphPad Software), and data were tested for normal distribution. For statistical analysis, a mixed-effect analysis followed by Bonferroni’s multiple comparison test was used to compare each treatment group. At the end of the treatment period and after the last round of beam walk tests, all mice were deeply anesthetized (i.p. injection of pentobarbital at 600 mg/kg) and samples were collected for histology and biochemical analysis. For this, the mice were transcardially perfused with 0.9% saline until the blood was totally flushed out of the capillaries. Then, the brains were removed carefully and hemisected into left hemibrains that were weighed, snap-frozen on dry ice, and stored at −80 °C for future biochemical analysis. The right hemibrains were fixed by immersion in freshly prepared 4% paraformaldehyde in phosphate buffer pH 7.4 for 2 h at RT and transferred to sucrose-PBS solution overnight for cryoprotection.
Histopathology (Human α-Synuclein, pS129-α-Synuclein, and GFAP Immunohistochemistry)
Tissue blocks were trimmed, transferred to cryomolds, embedded in an OCT medium, and snap-frozen in dry ice-cooled liquid isopentane. Five consecutive cryosections were sagittally cut at 10 μm thickness on a Leica cryotome. The next 25 sections per level were discarded. This scheme was repeated for 12 levels, resulting in a collection of 60 sections in total. Sectioning levels were chosen according to the brain atlas of Paxinos and Franklin (“The Mouse Brain in Stereotaxic Coordinates”, 2nd edition, 2001). The collection of sections started at a level ∼0.2 mm lateral from midline and extended through the hemisphere to ensure systematic random sampling through the target regions. For Immunofluorescence (IF) analysis, cryosections were incubated with rat monoclonal [15G7] anti-h-α-synuclein at 1:10 (Enzo Life Sciences, ALX-804-258), rabbit monoclonal [EP1536Y] anti-pSer129-α-synuclein at 1:1000 (Abcam, ab51253), and goat polyclonal anti-GFAP at 1:1000 (Abcam, ab53554) as primary antibodies in 1% normal donkey serum overnight at 4 °C in a damp chamber. Then, sections were incubated with donkey anti-rat IgG H + L Alexa 647-conjugated at 1:500 (Jackson ImmunoResearch, 712-605-153), donkey anti-rabbit IgG H + L Alexa 555-conjugated at 1:500 (Abcam, ab150066), and donkey anti-goat IgG H + L Alexa 750-conjugated at 1:500 (Abcam, ab175745) as secondary antibodies in 1% normal donkey serum for 60 min in a damp chamber (light protected). After a series of washes in PBS (3 × 5 min), sections were counterstained with DAPI working solution for 15 min (light-protected) followed by a series of PBS washes (3 × 5 min) and a final 5 min wash in distilled water. For imaging, whole slide scans of the stained sections were recorded on a Zeiss automatic microscope AxioScan Z1 with high aperture lenses, equipped with a Zeiss Axiocam 506 mono and an Hitachi HV-F202SCL 3 CCD camera and Zeiss ZEN 2.3 software. Image analyses were done with Image Pro 10 (Media Cybernetics, Inc.). After determination of the area of interest (AOI) in target areas (cortex and hippocampus), the following parameters, such as the number and the size of immunoreactive objects, were identified in each AOI.
GFAP Immunoassay
Soluble fractions from the cortex and hippocampus were prepared for the quantification of total protein O-GlcNAcylation and astrogliosis (GFAP). In brief, the cortex and hippocampus from the left hemibrains were micro-dissected and homogenized in 20 mM Tris–HCl, pH 7.4, 500 mM NaCl, 1% Triton X-100, 0.2 mM NA3VO4 plus PI, and phosphatase inhibitor cocktail (Merck Millipore, 524627) and incubated for 30 min on ice. After centrifugation for 60 min at 15,000g (4 °C), the supernatants (soluble fractions) were collected and submitted to protein determination using the bicinchoninic acid protein assay. O-GlcNAcylated protein was quantified by MSD immunoassays as previously described in the manuscript. Glial fibrillary acidic protein (GFAP) was quantified in the soluble fraction from the cortex and hippocampus of Line 61 α-synuclein transgenic mice using a sandwich MSD immunoassay with a biotinylated mouse monoclonal anti-GFAP antibody (Synaptic system, 173211BT) as the capture antibody and a rat monoclonal anti-GFAP antibody (Invitrogen, 13-0300) as the detection antibody. Statistical analyses were performed using GraphPad Prism version 8.02 for Windows (GraphPad Software), and data were tested for normal distribution. One-way ANOVA followed by the Holm–Sidak post hoc test was used to analyze group differences. Data were presented as mean +/– SEM.
Detection of O-GlcNAcylated α-Synuclein by Using Chemoenzymatic Mass Tagging
Homogenates (10% wt/vol) from Line 61 α-synuclein transgenic mice treated with vehicle or ASN90 were prepared by homogenizing half of a cortex in ice-cold buffer composed of 25 mM Tris (pH 7.5), 150 mM NaCl, 1% Triton X-100, 20 μM PUGNAc (Tocris), and an EDTA-free protease inhibitor cocktail (Roche) using a Precellys homogenizer 5000 rpm with two cycles of 30 s with 1 s pause between the two cycles. The homogenates were incubated for 30 min in ice before centrifugation at 18,500g, 4 °C for 15 min and the supernatants were processed for chemoenzymatic mass tagging. Protein of each sample (300 μg) was precipitated by standard methanol/chloroform extraction and resuspended in 100 μL of 20 mM HEPES (pH 7.9), 1% SDS. Protein concentrations were determined by BCA, and the samples were normalized to 2.5 μg/μL protein in 20 mM HEPES (pH 7.9), 1% SDS. The terminal N-acetyl-β-d-glucosamine (GlcNAc) residues of glycoproteins present in these samples were labeled with N-azido-galactose using a Click-IT kit with the GalT1(Y289L) enzyme according to the manufacturer’s instructions (Thermo Fisher Scientific, 33368). Sample reactions without the GalT1(Y289L) enzyme were used as controls. After 20 h of labeling with N-azido-galactose, 7.5 μL of freshly made iodoacetamide (600 mM) was added to each sample and incubated for 30 min in the dark under rotation. The samples were precipitated with methanol/chloroform and solubilized in 90 μL of 10 mM triethanolamine (pH 7.4) (TEA, Sigma-Aldrich), 150 mM NaCl, 1% SDS, and 10 μL of 10 mM DBCO-PEG 5 kDa (Click Chemistry Tools, A118-100) was added for mass tagging using click chemistry. After boiling for 5 min at 98 °C, the reactions were precipitated with methanol/chloroform and resulting pellets were resuspended in 20 μL of 10 mM TEA (pH 7.4), 150 mM NaCl, 1% SDS, and 10 μL of 1.5× Tricine-SDS sample buffer (NuPage, Novex) containing 200 mM DTT (Sigma-Aldrich) and boiled for 5 min at 98 °C. Equal volumes of the samples (20 μL) were separated on 10–20% Tricine gels (NuPage Novex) and transferred onto nitrocellulose membranes. Ponceau S staining (loading control; Sigma-Aldrich) was followed by western blot immunostaining using a mouse monoclonal anti α-synuclein Syn205 at 1:1000 (Cell Signaling Technology, 2644) and IRDye 680-conjugated goat anti-rabbit secondary antibody at 1:8000 (Li-Cor, 926-68071). The blots were scanned using an Odyssey infrared imager at 700 nm, and the α-synuclein bands were quantified by densitometry.
Statistical Analyses
Each value obtained for O-GlcNAcylated protein, O-tau, total, and phospho-tau MSD immunoassays was expressed as % vehicle control (mean +/– SEM) and plotted in bar graph format. To account for variations in human tau expression between animals, all tau readings (e.g., O-tau and phospho-tau) were normalized to the total tau signal obtained in S0 (crude homogenate) of the respective animal. The GraphPad Prism software was used for statistical analysis. All data were first submitted to a normality test (Shapiro–Wilk test). Data passing the normality test (Gaussian distribution) were analyzed by the parametric one-way ANOVA followed by Dunnett’s post hoc test. Data that were not distributed according to a Gaussian distribution were analyzed by the non-parametric Kruskal–Wallis test followed by Dunn’s post hoc test.
Acknowledgments
We would like to acknowledge the teams of our close collaborators at reMYND (Leuven, Belgium), Invicro (London, United Kingdom), Syngene (Bangalore, India), and QPS Austria (Grambach, Austria) for their excellent technical support and Dr. Manfred Schneider for his advice on pharmacokinetics and pharmacodynamics studies. The table of content (TOC) graphic has been created with BioRender.com.
Glossary
Abbreviations
- AAALAC
Association for Assessment and Accreditation of Laboratory Animal Care
- AD
Alzheimer’s disease
- Aβ
β-amyloid
- BCA
bicinchoninic acid
- FBS
fetal bovine serum
- FEV0.1
the forced expiratory volume and flow at 0.1 s
- FEV0.2
the forced expiratory volume and flow at 0.2 s
- FVC
forced vital capacity
- GalNAz
galactose moiety modified with an azide
- GalT1(Y289L)
permissive mutant Galactosyl-transferase enzyme
- GFAP
glial fibrillary astrocytic protein
- GlcNAc
N-acetyl-d-glucosamine
- Hex
hexosaminidase
- HexA/B
hexosaminidase A and B isozymes
- i.p.
intraperitoneal
- i.v.
intravenous
- IF
immunofluorescence
- IVC
individually ventilated
- Km
Michaelis constant (substrate concentration at which the reaction rate is half of its maximal value)
- LC–MS/MS
liquid chromatography–tandem mass spectrometry
- LLOQ
lower limit of quantitation
- LRRK2
leucine-rich repeat kinase 2
- MAPT
tau H1 haplotype
- MP
mobile phase
- MRM
multiple reaction monitoring
- MSA
multiple system atrophy
- NACP
non-amyloid beta/A4 protein component
- OGA
O-GlcNAcase
- OGT
O-linked N-acetylglucosaminyltransferase
- PBMC
peripheral mononuclear blood cells
- PD
Parkinson’s disease
- PHF
paired helical filaments
- PK/PD
pharmacokinetic/pharmacodynamic
- ptau
phospho-tau protein
- QD
once a day
- sHSP
small heat shock proteins
- SNCA
α-synuclein gene
- UDP-GlcNAc
uridine 5′-diphospho-N-acetyl-d-glucosamine 3
- Vmax
maximum velocity
- VT
volume of distribution
- WGA
wheat germ agglutinin
Supporting Information Available
The Supporting Information is available free of charge at https://pubs.acs.org/doi/10.1021/acschemneuro.2c00057.
ASN90 not inhibiting lysosomal hexosaminidases, inhibitor cross-competition enzyme kinetics implying overlapping binding sites for Thiamet G and ASN90, potency of ASN90 in human (hPBMC) and rat (rPMBC) PBMC, activity of ASN90 in a human ex vivo whole blood target engagement assay, ASN90-induced O-protein and OGA increases in P301S mice, chronic treatment with ASN90 and motor deficits in P301S tau transgenic mice, reduction of pathological tau protein in the cortex and hippocampus of P301S tau transgenic mice after chronic treatment with ASN90, western blot analysis of the soluble and sarkosyl-insoluble tau from the cortex of P301S tau transgenic mice treated with ASN90, pathological tau protein in the brainstem and hippocampus of P301L tau transgenic mice treated with ASN90, immunohistochemistry images of pS129 and human α-synuclein in the hippocampus of ASN90-treated Line 61 mice, and pSer129 α-synuclein immunoreactivity being reduced in the hippocampus of ASN90-treated Line 61 mice (PDF)
Author Contributions
C.W., B.P., A.Q., and D.B. conceived and designed the research. A.S., S.O., M.N., and J.H. performed the research. A.S., S.O., M.N., J.H., and B.P. assembled the data, C.W., B.P., A.Q., R.S., and D.B. analyzed the data, and D.B., B.P., and R.S. wrote the manuscript.
Part of the funding was provided by the Alzheimer’s Drug Discovery Foundation (ADDF). The ADDF catalyzes and funds drug discovery and drug development for Alzheimer’s disease, related disorders, and cognitive aging.
The authors declare the following competing financial interest(s): All authors are or were employees of Asceneuron and hold shares, founder warrants or stock options of the company.
Notes
All data associated with this study are present in the paper or in the Supporting Information.
Supplementary Material
References
- Torres C. R.; Hart G. W. Topography and polypeptide distribution of terminal N-acetylglucosamine residues on the surfaces of intact lymphocytes. Evidence for O-linked GlcNAc. J. Biol. Chem. 1984, 259, 3308–3317. 10.1016/S0021-9258(17)43295-9. [DOI] [PubMed] [Google Scholar]
- Haltiwanger R. S.; Holt G. D.; Hart G. W. Enzymatic addition of O-GlcNAc to nuclear and cytoplasmic proteins. Identification of a uridine diphospho-N-acetylglucosamine:peptide beta-N-acetylglucosaminyltransferase. J. Biol. Chem. 1990, 265, 2563–2568. 10.1016/S0021-9258(19)39838-2. [DOI] [PubMed] [Google Scholar]
- Dong D. L.; Hart G. W. Purification and characterization of an O-GlcNAc selective N-acetyl-beta-D-glucosaminidase from rat spleen cytosol. J Biol Chem 1994, 269, 19321–19330. 10.1016/S0021-9258(17)32170-1. [DOI] [PubMed] [Google Scholar]
- Pinho T. S.; Verde D. M.; Correia S. C.; Cardoso S. M.; Moreira P. I. O-GlcNAcylation and neuronal energy status: Implications for Alzheimer’s disease. Ageing Res Rev 2018, 46, 32–41. 10.1016/j.arr.2018.05.003. [DOI] [PubMed] [Google Scholar]
- Sánchez R. G.; Parrish R. R.; Rich M.; Webb W. M.; Lockhart R. M.; Nakao K.; Ianov L.; Buckingham S. C.; Broadwater D. R.; Jenkins A.; de Lanerolle N. C.; Cunningham M.; Eid T.; Riley K.; Lubin F. D. Human and rodent temporal lobe epilepsy is characterized by changes in O-GlcNAc homeostasis that can be reversed to dampen epileptiform activity. Neurobiol Dis 2019, 124, 531–543. 10.1016/j.nbd.2019.01.001. [DOI] [PMC free article] [PubMed] [Google Scholar]
- Liu F.; Shi J.; Tanimukai H.; Gu J.; Gu J.; Grundke-Iqbal I.; Iqbal K.; Gong C. X. Reduced O-GlcNAcylation links lower brain glucose metabolism and tau pathology in Alzheimer’s disease. Brain 2009, 132, 1820–1832. 10.1093/brain/awp099. [DOI] [PMC free article] [PubMed] [Google Scholar]
- Park J.; Ha H. J.; Chung E. S.; Baek S. H.; Cho Y.; Kim H. K.; Han J.; Sul J. H.; Lee J.; Kim E.; Kim J.; Yang Y. R.; Park M.; Kim S. H.; Arumugam T. V.; Jang H.; Seo S. W.; Suh P. G.; Jo D. G.. O-GlcNAcylation ameliorates the pathological manifestations of Alzheimer’s disease by inhibiting necroptosis. Sci. Adv. 2021, 7 (), 10.1126/sciadv.abd3207. [DOI] [PMC free article] [PubMed] [Google Scholar]
- Yuzwa S. A.; Shan X.; Macauley M. S.; Clark T.; Skorobogatko Y.; Vosseller K.; Vocadlo D. J. Increasing O-GlcNAc slows neurodegeneration and stabilizes tau against aggregation. Nat. Chem. Biol. 2012, 8, 393–399. 10.1038/nchembio.797. [DOI] [PubMed] [Google Scholar]
- Marotta N. P.; Lin Y. H.; Lewis Y. E.; Ambroso M. R.; Zaro B. W.; Roth M. T.; Arnold D. B.; Langen R.; Pratt M. R. O-GlcNAc modification blocks the aggregation and toxicity of the protein α-synuclein associated with Parkinson’s disease. Nat. Chem. 2015, 7, 913–920. 10.1038/nchem.2361. [DOI] [PMC free article] [PubMed] [Google Scholar]
- Levine P. M.; Galesic A.; Balana A. T.; Mahul-Mellier A. L.; Navarro M. X.; De Leon C. A.; Lashuel H. A.; Pratt M. R. α-Synuclein O-GlcNAcylation alters aggregation and toxicity, revealing certain residues as potential inhibitors of Parkinson’s disease. Proc. Natl. Acad. Sci. U. S. A. 2019, 116, 1511–1519. 10.1073/pnas.1808845116. [DOI] [PMC free article] [PubMed] [Google Scholar]
- Graham D. L.; Gray A. J.; Joyce J. A.; Yu D.; O’Moore J.; Carlson G. A.; Shearman M. S.; Dellovade T. L.; Hering H. Increased O-GlcNAcylation reduces pathological tau without affecting its normal phosphorylation in a mouse model of tauopathy. Neuropharmacology 2014, 79, 307–313. 10.1016/j.neuropharm.2013.11.025. [DOI] [PubMed] [Google Scholar]
- Hastings N. B.; Wang X.; Song L.; Butts B. D.; Grotz D.; Hargreaves R.; Fred Hess J.; Hong K. K.; Huang C. R.; Hyde L.; Laverty M.; Lee J.; Levitan D.; Lu S. X.; Maguire M.; Mahadomrongkul V.; McEachern E. J.; Ouyang X.; Rosahl T. W.; Selnick H.; Stanton M.; Terracina G.; Vocadlo D. J.; Wang G.; Duffy J. L.; Parker E. M.; Zhang L. Inhibition of O-GlcNAcase leads to elevation of O-GlcNAc tau and reduction of tauopathy and cerebrospinal fluid tau in rTg4510 mice. Mol. Neurodegener. 2017, 12, 39. 10.1186/s13024-017-0181-0. [DOI] [PMC free article] [PubMed] [Google Scholar]
- Wang X.; Li W.; Marcus J.; Pearson M.; Song L.; Smith K.; Terracina G.; Lee J.; Hong K. K.; Lu S. X.; Hyde L.; Chen S. C.; Kinsley D.; Melchor J. P.; Rubins D. J.; Meng X.; Hostetler E.; Sur C.; Zhang L.; Schachter J. B.; Hess J. F.; Selnick H. G.; Vocadlo D. J.; McEachern E. J.; Uslaner J. M.; Duffy J. L.; Smith S. M. MK-8719, a Novel and Selective O-GlcNAcase Inhibitor That Reduces the Formation of Pathological Tau and Ameliorates Neurodegeneration in a Mouse Model of Tauopathy. J. Pharmacol. Exp. Ther. 2020, 374, 252–263. 10.1124/jpet.120.266122. [DOI] [PubMed] [Google Scholar]
- Polymeropoulos M. H.; Lavedan C.; Leroy E.; Ide S. E.; Dehejia A.; Dutra A.; Pike B.; Root H.; Rubenstein J.; Boyer R.; Stenroos E. S.; Chandrasekharappa S.; Athanassiadou A.; Papapetropoulos T.; Johnson W. G.; Lazzarini A. M.; Duvoisin R. C.; Di Iorio G.; Golbe L. I.; Nussbaum R. L. Mutation in the alpha-synuclein gene identified in families with Parkinson’s disease. Science 1997, 276, 2045–2047. 10.1126/science.276.5321.2045. [DOI] [PubMed] [Google Scholar]
- Singleton A. B.; Farrer M.; Johnson J.; Singleton A.; Hague S.; Kachergus J.; Hulihan M.; Peuralinna T.; Dutra A.; Nussbaum R.; Lincoln S.; Crawley A.; Hanson M.; Maraganore D.; Adler C.; Cookson M. R.; Muenter M.; Baptista M.; Miller D.; Blancato J.; Hardy J.; Gwinn-Hardy K. alpha-Synuclein locus triplication causes Parkinson’s disease. Science 2003, 302, 841. 10.1126/science.1090278. [DOI] [PubMed] [Google Scholar]
- Spillantini M. G.; Schmidt M. L.; Lee V. M.; Trojanowski J. Q.; Jakes R.; Goedert M. Alpha-synuclein in Lewy bodies. Nature 1997, 388, 839–840. 10.1038/42166. [DOI] [PubMed] [Google Scholar]
- Wang Z.; Udeshi N. D.; O’Malley M.; Shabanowitz J.; Hunt D. F.; Hart G. W. Enrichment and site mapping of O-linked N-acetylglucosamine by a combination of chemical/enzymatic tagging, photochemical cleavage, and electron transfer dissociation mass spectrometry. Mol. Cell. Proteomics 2010, 9, 153–160. 10.1074/mcp.M900268-MCP200. [DOI] [PMC free article] [PubMed] [Google Scholar]
- Tavassoly O.; Yue J.; Vocadlo D. J.. Pharmacological inhibition and knockdown of O-GlcNAcase reduces cellular internalization of α-synuclein preformed fibrils. FEBS J. 2021. [DOI] [PubMed] [Google Scholar]
- Lee B. E.; Kim H. Y.; Kim H. J.; Jeong H.; Kim B. G.; Lee H. E.; Lee J.; Kim H. B.; Lee S. E.; Yang Y. R.; Yi E. C.; Hanover J. A.; Myung K.; Suh P. G.; Kwon T.; Kim J. I. O-GlcNAcylation regulates dopamine neuron function, survival and degeneration in Parkinson disease. Brain 2020, 143, 3699–3716. 10.1093/brain/awaa320. [DOI] [PMC free article] [PubMed] [Google Scholar]
- Ahrend M.; Käberich A.; Fergen M. T.; Schmitz B. Immunochemical methods for the rapid screening of the o-glycosidically linked N-acetylglucosamine modification of proteins. Methods Mol. Biol. 2008, 446, 267–280. 10.1007/978-1-60327-084-7_19. [DOI] [PubMed] [Google Scholar]
- Cameron A.; Giacomozzi B.; Joyce J.; Gray A.; Graham D.; Ousson S.; Neny M.; Beher D.; Carlson G.; O’Moore J.; Shearman M.; Hering H. Generation and characterization of a rabbit monoclonal antibody site-specific for tau O-GlcNAcylated at serine 400. FEBS Lett. 2013, 587, 3722–3728. 10.1016/j.febslet.2013.09.042. [DOI] [PubMed] [Google Scholar]
- Leal A. F.; Benincore-Flórez E.; Solano-Galarza D.; Garzón Jaramillo R. G.; Echeverri-Peña O. Y.; Suarez D. A.; Alméciga-Díaz C. J.; Espejo-Mojica A. J.. GM2 Gangliosidoses: Clinical Features, Pathophysiological Aspects, and Current Therapies. Int. J. Mol. Sci. 2020, 21 (), 10.3390/ijms21176213. [DOI] [PMC free article] [PubMed] [Google Scholar]
- Yonetani T. The Yonetani-Theorell graphical method for examining overlapping subsites of enzyme active centers. Methods Enzymol. 1982, 87, 500–509. 10.1016/S0076-6879(82)87028-6. [DOI] [PubMed] [Google Scholar]
- Paul S.; Haskali M. B.; Liow J. S.; Zoghbi S. S.; Barth V. N.; Kolodrubetz M. C.; Bond M. R.; Morse C. L.; Gladding R. L.; Frankland M. P.; Kant N.; Slieker L.; Shcherbinin S.; Nuthall H. N.; Zanotti-Fregonara P.; Hanover J. A.; Jesudason C.; Pike V. W.; Innis R. B. Evaluation of a PET Radioligand to Image O-GlcNAcase in Brain and Periphery of Rhesus Monkey and Knock-Out Mouse. J. Nucl. Med. 2019, 60, 129–134. 10.2967/jnumed.118.213231. [DOI] [PMC free article] [PubMed] [Google Scholar]
- Allen B.; Ingram E.; Takao M.; Smith M. J.; Jakes R.; Virdee K.; Yoshida H.; Holzer M.; Craxton M.; Emson P. C.; Atzori C.; Migheli A.; Crowther R. A.; Ghetti B.; Spillantini M. G.; Goedert M. Abundant tau filaments and nonapoptotic neurodegeneration in transgenic mice expressing human P301S tau protein. J Neurosci 2002, 22, 9340–9351. 10.1523/JNEUROSCI.22-21-09340.2002. [DOI] [PMC free article] [PubMed] [Google Scholar]
- Zhang Z.; Tan E. P.; VandenHull N. J.; Peterson K. R.; Slawson C. O-GlcNAcase Expression is Sensitive to Changes in O-GlcNAc Homeostasis. Front Endocrinol (Lausanne) 2014, 5, 206. 10.3389/fendo.2014.00206. [DOI] [PMC free article] [PubMed] [Google Scholar]
- Simic G.; Babic Leko M.; Wray S.; Harrington C.; Delalle I.; Jovanov-Milosevic N.; Bazadona D.; Buee L.; de Silva R.; Di Giovanni G.; Wischik C.; Hof P. R. Tau Protein Hyperphosphorylation and Aggregation in Alzheimer’s Disease and Other Tauopathies, and Possible Neuroprotective Strategies. Biomolecules 2016, 6, 6. 10.3390/biom6010006. [DOI] [PMC free article] [PubMed] [Google Scholar]
- Chai X.; Wu S.; Murray T. K.; Kinley R.; Cella C. V.; Sims H.; Buckner N.; Hanmer J.; Davies P.; O’Neill M. J.; Hutton M. L.; Citron M. Passive immunization with anti-Tau antibodies in two transgenic models: reduction of Tau pathology and delay of disease progression. J Biol Chem 2011, 286, 34457–34467. 10.1074/jbc.M111.229633. [DOI] [PMC free article] [PubMed] [Google Scholar]
- van Olst L.; Verhaege D.; Franssen M.; Kamermans A.; Roucourt B.; Carmans S.; Ytebrouck E.; van der Pol S. M. A.; Wever D.; Popovic M.; Vandenbroucke R. E.; Sobrino T.; Schouten M.; de Vries H. E. Microglial activation arises after aggregation of phosphorylated-tau in a neuron-specific P301S tauopathy mouse model. Neurobiol Aging 2020, 89, 89–98. 10.1016/j.neurobiolaging.2020.01.003. [DOI] [PubMed] [Google Scholar]
- Greenberg S. G.; Davies P. A preparation of Alzheimer paired helical filaments that displays distinct tau proteins by polyacrylamide gel electrophoresis. Proc. Natl. Acad. Sci. U. S. A. 1990, 87, 5827–5831. 10.1073/pnas.87.15.5827. [DOI] [PMC free article] [PubMed] [Google Scholar]
- Delobel P.; Lavenir I.; Fraser G.; Ingram E.; Holzer M.; Ghetti B.; Spillantini M. G.; Crowther R. A.; Goedert M. Analysis of tau phosphorylation and truncation in a mouse model of human tauopathy. Am. J. Pathol. 2008, 172, 123–131. 10.2353/ajpath.2008.070627. [DOI] [PMC free article] [PubMed] [Google Scholar]
- Uchihara T. Silver diagnosis in neuropathology: principles, practice and revised interpretation. Acta. Neuropathol. 2007, 113, 483–499. 10.1007/s00401-007-0200-2. [DOI] [PMC free article] [PubMed] [Google Scholar]
- Terwel D.; Lasrado R.; Snauwaert J.; Vandeweert E.; Van Haesendonck C.; Borghgraef P.; Van Leuven F. Changed conformation of mutant Tau-P301L underlies the moribund tauopathy, absent in progressive, nonlethal axonopathy of Tau-4R/2N transgenic mice. J. Biol. Chem. 2005, 280, 3963–3973. 10.1074/jbc.M409876200. [DOI] [PubMed] [Google Scholar]
- Borghgraef P.; Menuet C.; Theunis C.; Louis J. V.; Devijver H.; Maurin H.; Smet-Nocca C.; Lippens G.; Hilaire G.; Gijsen H.; Moechars D.; Van Leuven F. Increasing brain protein O-GlcNAc-ylation mitigates breathing defects and mortality of Tau.P301L mice. PLoS One 2013, 8, e84442 10.1371/journal.pone.0084442. [DOI] [PMC free article] [PubMed] [Google Scholar]
- Dutschmann M.; Menuet C.; Stettner G. M.; Gestreau C.; Borghgraef P.; Devijver H.; Gielis L.; Hilaire G.; Van Leuven F. Upper airway dysfunction of Tau-P301L mice correlates with tauopathy in midbrain and ponto-medullary brainstem nuclei. J. Neurosci. 2010, 30, 1810–1821. 10.1523/JNEUROSCI.5261-09.2010. [DOI] [PMC free article] [PubMed] [Google Scholar]
- Rockenstein E.; Mallory M.; Hashimoto M.; Song D.; Shults C. W.; Lang I.; Masliah E. Differential neuropathological alterations in transgenic mice expressing alpha-synuclein from the platelet-derived growth factor and Thy-1 promoters. J. Neurosci. Res. 2002, 68, 568–578. 10.1002/jnr.10231. [DOI] [PubMed] [Google Scholar]
- Chesselet M. F.; Richter F.; Zhu C.; Magen I.; Watson M. B.; Subramaniam S. R. A progressive mouse model of Parkinson’s disease: the Thy1-aSyn (″Line 61″) mice. Neurotherapeutics 2012, 9, 297–314. 10.1007/s13311-012-0104-2. [DOI] [PMC free article] [PubMed] [Google Scholar]
- Darabedian N.; Thompson J. W.; Chuh K. N.; Hsieh-Wilson L. C.; Pratt M. R. Optimization of Chemoenzymatic Mass Tagging by Strain-Promoted Cycloaddition (SPAAC) for the Determination of O-GlcNAc Stoichiometry by Western Blotting. Biochemistry 2018, 57, 5769–5774. 10.1021/acs.biochem.8b00648. [DOI] [PMC free article] [PubMed] [Google Scholar]
- Thompson J. W.; Griffin M. E.; Hsieh-Wilson L. C. Methods for the Detection, Study, and Dynamic Profiling of O-GlcNAc Glycosylation. Methods Enzymol. 2018, 598, 101–135. 10.1016/bs.mie.2017.06.009. [DOI] [PMC free article] [PubMed] [Google Scholar]
- Yuzwa S. A.; Macauley M. S.; Heinonen J. E.; Shan X.; Dennis R. J.; He Y.; Whitworth G. E.; Stubbs K. A.; McEachern E. J.; Davies G. J.; Vocadlo D. J. A potent mechanism-inspired O-GlcNAcase inhibitor that blocks phosphorylation of tau in vivo. Nat. Chem. Biol. 2008, 4, 483–490. 10.1038/nchembio.96. [DOI] [PubMed] [Google Scholar]
- Selnick H. G.; Hess J. F.; Tang C.; Liu K.; Schachter J. B.; Ballard J. E.; Marcus J.; Klein D. J.; Wang X.; Pearson M.; Savage M. J.; Kaul R.; Li T. S.; Vocadlo D. J.; Zhou Y.; Zhu Y.; Mu C.; Wang Y.; Wei Z.; Bai C.; Duffy J. L.; McEachern E. J. Discovery of MK-8719, a Potent O-GlcNAcase Inhibitor as a Potential Treatment for Tauopathies. J. Med. Chem. 2019, 62, 10062–10097. 10.1021/acs.jmedchem.9b01090. [DOI] [PubMed] [Google Scholar]
- Ryan; Michael J.; Quattropani; Anna; Abd-Elaziz; Khalid; Den D.; Izaak; Schneider; Manfred; Ousson; Solenne; Neny; Maud; Sand; Astrid; Hantson; Jennifer; Permanne; Bruno; Wiessner; Christoph; Beher; Dirk, – O1–12-05: Phase 1 Study in Healthy Volunteers of the O-Glcnacase Inhibitor Asn120290 as a Novel Therapy for Progressive Supranuclear Palsy and Related Tauopathies.
- Gamache J.; Benzow K.; Forster C.; Kemper L.; Hlynialuk C.; Furrow E.; Ashe K. H.; Koob M. D. Factors other than hTau overexpression that contribute to tauopathy-like phenotype in rTg4510 mice. Nat. Commun. 2019, 10, 2479. 10.1038/s41467-019-10428-1. [DOI] [PMC free article] [PubMed] [Google Scholar]
- Yu Y.; Zhang L.; Li X.; Run X.; Liang Z.; Li Y.; Liu Y.; Lee M. H.; Grundke-Iqbal I.; Iqbal K.; Vocadlo D. J.; Liu F.; Gong C. X. Differential effects of an O-GlcNAcase inhibitor on tau phosphorylation. PLoS One 2012, 7, e35277 10.1371/journal.pone.0035277. [DOI] [PMC free article] [PubMed] [Google Scholar]
- Haj-Yahya M.; Gopinath P.; Rajasekhar K.; Mirbaha H.; Diamond M. I.; Lashuel H. A. Site-Specific Hyperphosphorylation Inhibits, Rather than Promotes, Tau Fibrillization, Seeding Capacity, and Its Microtubule Binding. Angew. Chem. Int. Ed. Engl. 2020, 59, 4059–4067. 10.1002/anie.201913001. [DOI] [PMC free article] [PubMed] [Google Scholar]
- Hart G. W. Three Decades of Research on O-GlcNAcylation - A Major Nutrient Sensor That Regulates Signaling, Transcription and Cellular Metabolism. Front. Endocrinol. 2014, 5, 183. 10.3389/fendo.2014.00183. [DOI] [PMC free article] [PubMed] [Google Scholar]
- Gu J. H.; Shi J.; Dai C. L.; Ge J. B.; Zhao Y.; Chen Y.; Yu Q.; Qin Z. H.; Iqbal K.; Liu F.; Gong C. X. O-GlcNAcylation Reduces Ischemia-Reperfusion-Induced Brain Injury. Sci. Rep. 2017, 7, 10686. 10.1038/s41598-017-10635-0. [DOI] [PMC free article] [PubMed] [Google Scholar]
- Stewart L. T.; Abiraman K.; Chatham J. C.; McMahon L. L. Increased O-GlcNAcylation rapidly decreases GABA(A)R currents in hippocampus but depresses neuronal output. Sci. Rep. 2020, 10, 7494. 10.1038/s41598-020-63188-0. [DOI] [PMC free article] [PubMed] [Google Scholar]
- Wheatley E. G.; Albarran E.; White C. W. 3rd; Bieri G.; Sanchez-Diaz C.; Pratt K.; Snethlage C. E.; Ding J. B.; Villeda S. A. Neuronal O-GlcNAcylation Improves Cognitive Function in the Aged Mouse Brain. Curr. Biol. 2019, 29, 3359–3369.e4. 10.1016/j.cub.2019.08.003. [DOI] [PMC free article] [PubMed] [Google Scholar]
- Saito Y.; Kawashima A.; Ruberu N. N.; Fujiwara H.; Koyama S.; Sawabe M.; Arai T.; Nagura H.; Yamanouchi H.; Hasegawa M.; Iwatsubo T.; Murayama S. Accumulation of phosphorylated alpha-synuclein in aging human brain. J. Neuropathol. Exp. Neurol. 2003, 62, 644–654. 10.1093/jnen/62.6.644. [DOI] [PubMed] [Google Scholar]
- Lin C. H.; Liu H. C.; Yang S. Y.; Yang K. C.; Wu C. C.; Chiu M. J.. Plasma pS129-α-Synuclein Is a Surrogate Biofluid Marker of Motor Severity and Progression in Parkinson’s Disease. J. Clin. Med. 2019, 8 (). [DOI] [PMC free article] [PubMed] [Google Scholar]
- Wang A. C.; Jensen E. H.; Rexach J. E.; Vinters H. V.; Hsieh-Wilson L. C. Loss of O-GlcNAc glycosylation in forebrain excitatory neurons induces neurodegeneration. Proc. Natl. Acad. Sci. U. S. A. 2016, 113, 15120–15125. 10.1073/pnas.1606899113. [DOI] [PMC free article] [PubMed] [Google Scholar]
- White C. W. 3rd; Fan X.; Maynard J. C.; Wheatley E. G.; Bieri G.; Couthouis J.; Burlingame A. L.; Villeda S. A. Age-related loss of neural stem cell O-GlcNAc promotes a glial fate switch through STAT3 activation. Proc. Natl. Acad. Sci. U. S. A. 2020, 117, 22214–22224. 10.1073/pnas.2007439117. [DOI] [PMC free article] [PubMed] [Google Scholar]
- Balana A. T.; Levine P. M.; Craven T. W.; Mukherjee S.; Pedowitz N. J.; Moon S. P.; Takahashi T. T.; Becker C. F. W.; Baker D.; Pratt M. R. O-GlcNAc modification of small heat shock proteins enhances their anti-amyloid chaperone activity. Nat. Chem. 2021, 441. 10.1038/s41557-021-00648-8. [DOI] [PMC free article] [PubMed] [Google Scholar]
- Yuzwa S. A.; Vocadlo D. J. O-GlcNAc and neurodegeneration: biochemical mechanisms and potential roles in Alzheimer’s disease and beyond. Chem. Soc. Rev. 2014, 43, 6839–6858. 10.1039/C4CS00038B. [DOI] [PubMed] [Google Scholar]
- Maraganore D. M.; Hernandez D. G.; Singleton A. B.; Farrer M. J.; McDonnell S. K.; Hutton M. L.; Hardy J. A.; Rocca W. A. Case-Control study of the extended tau gene haplotype in Parkinson’s disease. Ann Neurol 2001, 50, 658–661. 10.1002/ana.1228. [DOI] [PubMed] [Google Scholar]
- Corces M. R.; Shcherbina A.; Kundu S.; Gloudemans M. J.; Frésard L.; Granja J. M.; Louie B. H.; Eulalio T.; Shams S.; Bagdatli S. T.; Mumbach M. R.; Liu B.; Montine K. S.; Greenleaf W. J.; Kundaje A.; Montgomery S. B.; Chang H. Y.; Montine T. J. Single-cell epigenomic analyses implicate candidate causal variants at inherited risk loci for Alzheimer’s and Parkinson’s diseases. Nat. Genet. 2020, 52, 1158–1168. 10.1038/s41588-020-00721-x. [DOI] [PMC free article] [PubMed] [Google Scholar]
- Henderson M. X.; Sengupta M.; Trojanowski J. Q.; Lee V. M. Y. Alzheimer’s disease tau is a prominent pathology in LRRK2 Parkinson’s disease. Acta Neuropathol Commun 2019, 7, 183. 10.1186/s40478-019-0836-x. [DOI] [PMC free article] [PubMed] [Google Scholar]
- Uéda K.; Fukushima H.; Masliah E.; Xia Y.; Iwai A.; Yoshimoto M.; Otero D. A.; Kondo J.; Ihara Y.; Saitoh T. Molecular cloning of cDNA encoding an unrecognized component of amyloid in Alzheimer disease. Proc. Natl. Acad. Sci. U. S. A. 1993, 90, 11282–11286. 10.1073/pnas.90.23.11282. [DOI] [PMC free article] [PubMed] [Google Scholar]
- Hamilton R. L. Lewy bodies in Alzheimer’s disease: a neuropathological review of 145 cases using alpha-synuclein immunohistochemistry. Brain Pathol 2000, 10, 378–384. 10.1111/j.1750-3639.2000.tb00269.x. [DOI] [PMC free article] [PubMed] [Google Scholar]
- Bachhuber T.; Katzmarski N.; McCarter J. F.; Loreth D.; Tahirovic S.; Kamp F.; Abou-Ajram C.; Nuscher B.; Serrano-Pozo A.; Müller A.; Prinz M.; Steiner H.; Hyman B. T.; Haass C.; Meyer-Luehmann M. Inhibition of amyloid-β plaque formation by α-synuclein. Nat. Med. 2015, 21, 802–807. 10.1038/nm.3885. [DOI] [PubMed] [Google Scholar]
- Cummings J. L.; Tong G.; Ballard C. Treatment Combinations for Alzheimer’s Disease: Current and Future Pharmacotherapy Options. J Alzheimers Dis 2019, 67, 779–794. 10.3233/JAD-180766. [DOI] [PMC free article] [PubMed] [Google Scholar]
- Böyum A. Isolation of leucocytes from human blood. Further observations. Methylcellulose, dextran, and ficoll as erythrocyteaggregating agents. Scand J Clin Lab Invest Suppl 1968, 97, 31–50. [PubMed] [Google Scholar]
- So E. C.; Sallin M. A.; Zhang X.; Chan S. L.; Sahni L.; Schulze D. H.; Davila E.; Strome S. E.; Jain A. A high throughput method for enrichment of natural killer cells and lymphocytes and assessment of in vitro cytotoxicity. J. Immunol. Methods 2013, 394, 40–48. 10.1016/j.jim.2013.05.001. [DOI] [PubMed] [Google Scholar]
- Hampton D. W.; Webber D. J.; Bilican B.; Goedert M.; Spillantini M. G.; Chandran S. Cell-mediated neuroprotection in a mouse model of human tauopathy. J Neurosci 2010, 30, 9973–9983. 10.1523/JNEUROSCI.0834-10.2010. [DOI] [PMC free article] [PubMed] [Google Scholar]
- Braak H.; Braak E.; Ohm T.; Bohl J. Silver impregnation of Alzheimer’s neurofibrillary changes counterstained for basophilic material and lipofuscin pigment. Stain Technol 1988, 63, 197–200. 10.3109/10520298809107184. [DOI] [PubMed] [Google Scholar]
- Gallyas F. Silver staining of Alzheimer’s neurofibrillary changes by means of physical development. Acta Morphol Acad Sci Hung 1971, 19, 1–8. [PubMed] [Google Scholar]
Associated Data
This section collects any data citations, data availability statements, or supplementary materials included in this article.