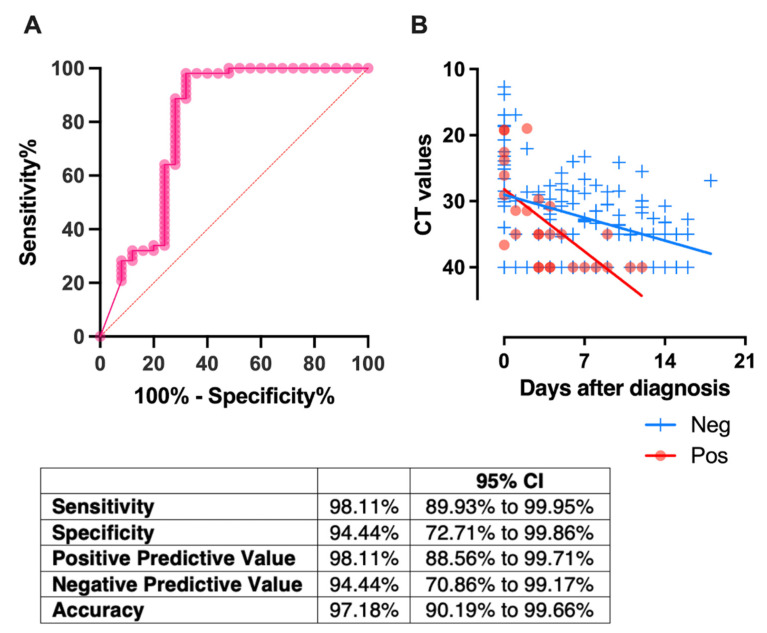
Figure 6.
(A) Receiver-operating characteristic (ROC) curves, constructed using 78 NELF samples, with both IgA and NAb levels measured. The area under the curve (AUC) was 0.80 with p < 0.001. Using the ROC curve, the threshold for NELF IgA was defined as > 4.386 by the Youden index calculation. Using this cutoff value, the sensitivity and specificity were 98.11% and 94.44%, respectively, with an accuracy of 97.18%. (B) All the available CT values of the paediatric patients who showed NELF IgA levels above  and below
  the thresholds level are plotted against time. For this panel data, a fixed-effect regression model was applied to compare the changes of the CT values across time between these 2 groups. A statistically significant difference was found in the decline rate of the viral load at p = 0.002.

