

SUMMARY
Rats readily switch between foraging and more complex navigational behaviors such as pursuit of other rats or prey. These tasks require vastly different tracking of multiple behaviorally significant variables including self-motion state. To explore whether navigational context modulates self-motion tracking, we examined self-motion tuning in posterior parietal cortex neurons during foraging versus visual target pursuit. Animals performing the pursuit task demonstrate predictive processing of target trajectories by anticipating and intercepting them. Relative to foraging, pursuit yields multiplicative gain modulation of self-motion tuning and enhances self-motion state decoding. Self-motion sensitivity in parietal cortex neurons is, on average, history dependent regardless of behavioral context, but the temporal window of self-motion integration extends during target pursuit. Finally, many self-motion-sensitive neurons conjunctively track the visual target position relative to the animal. Thus, posterior parietal cortex functions to integrate the location of navigationally relevant target stimuli into an ongoing representation of past, present, and future locomotor trajectories.
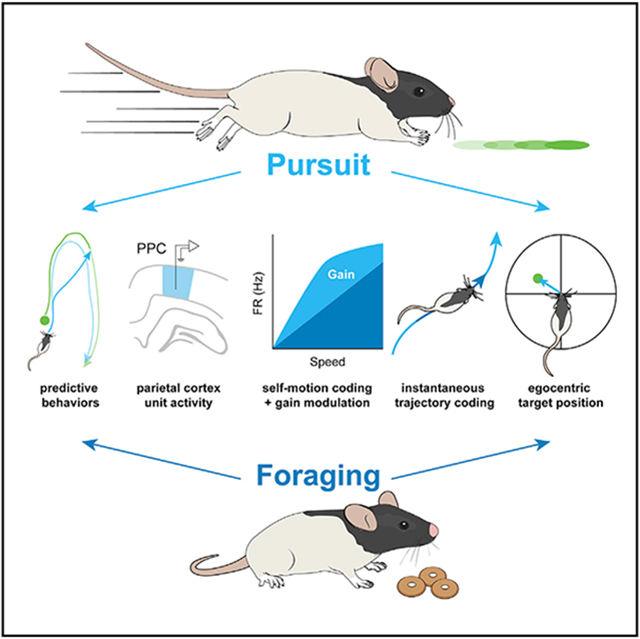
Graphical Abstract
In brief
Alexander et al. examine rats pursuing visual targets and characterize emergent predictive behaviors. Relative to free exploration, pursuit elicits enhanced coding of self-motion in the parietal cortex over extended temporal durations. A subset of parietal cortex neurons code for self-motion state and egocentric position of the pursuit target simultaneously.
INTRODUCTION
Rodents exhibit pursuit behaviors in social, sexual, and predatory contexts (Calhoun, 1963; Eisenberg and Leyhausen, 1972; Kurtz and Adler, 1973). Pursuit requires continuous adjustment of movement plans as a function of past and current movement states and target position (i.e., in egocentric space). In primates, efficiency in chase behavior is enhanced by predictive movements based on the hypothesized trajectory of the target (Barnes et al., 2000; Yoo et al., 2020).
The demanding nature of pursuit behavior requires greater precision of sensorimotor processing than other forms of navigation such as free exploration (FE). Movement modulates sensory processing (Niell and Stryker, 2010; Vinck et al., 2015; Bouvier et al., 2020; Guitchounts et al., 2020), but the influence of behaviorally relevant sensory information on movement coding has received little attention in rodents. It is unclear whether types of navigation (e.g., pursuit [P] or FE) flexibly modulate movement processing to support behavior.
In rodents, pursuit requires the dorsal striatum, superior colliculus (SC), and zona incerta (Schiller and Stryker, 1972; Cooper et al., 1998; Hoy et al., 2016, 2019; Shang et al., 2019; Zhao et al., 2019; Kim et al., 2019). Sensory cues relevant to predatory behavior (e.g., the sight, sound, or smell of prey) are potentially combined in areas such as posterior parietal cortex (PPC), which possesses reciprocal connectivity to sensorimotor cortical regions and projects to the SC and dorsal striatum (Reep et al., 1994; Wilber et al., 2015; Hovde et al., 2019; Gilissen et al., 2021). Lateralized PPC damage produces hemispatial neglect, impairing detection and orientation to stimuli present in contralateral space (Bisiach and Luzzatti, 1978; Behrmann et al., 1997). Thus, PPC functioning is critical for spatial awareness and attentional processes necessary to chase a moving goal.
PPC neurons exhibit sensitivity to self-motion (e.g., linear and angular speed), posture, and visual target position and movement direction (Kawano et al., 1980; Chen et al., 1994; Whitlock et al., 2012; Rancz et al., 2015; Wilber et al., 2014, 2017; Andersen and Mountcastle, 1983; Sasaki et al., 2020; Mimica et al., 2018). PPC ensembles are sensitive to trajectory shape through space, position, task phase, and the integration of information over time (Nitz, 2006, 2012; Harvey et al., 2012; Goard et al., 2016; Pho et al., 2018; Minderer et al., 2019; Scott et al., 2017; Hwang et al., 2017; Akrami et al., 2018; Krumin et al., 2018; Morcos and Harvey, 2016). Furthermore, PPC may support coordinate system transformations critical for sensorimotor coordination necessary for target chasing (Cohen and Andersen, 2002; Save and Poucet, 2000; Angelaki and Cullen, 2008; Bicanski and Burgess, 2018). Here, we examined PPC dynamics as rats chased and intercepted a floor-projected visual stimulus.
RESULTS
Rats perform a target pursuit task and exhibit shortcutting behavior
Rats (n = 6) performed a target-chasing task wherein they pursued and attempted to intercept a light target moving along the surface of an open arena in experimenter-generated pseudo-random trajectories (RTs). On each trial, the rat engaged in pursuit behavior until it caught the light target, which was subjectively determined based off positional overlap (Figures 1A and S1A; Videos S1, S2, and S3; see STAR methods). Following interception, the light target disappeared, a reward was delivered to a random position within the arena, and the light target reappeared hovering on the reward to guide retrieval. After consumption, the next trial began at a new position. During each session, rats averaged 33 RT pursuits for a median total duration of 134.6 s (interquartile range [IQR], 99.3–180.2 s; n = 132 sessions, IQR trial count = 24–41.8 trials) of a median 3.97 s in duration (IQR = 2.75–5.43 s).
Figure 1. Rats pursue visual targets and exhibit spatial shortcuts on known trajectories.

(A) Rats chase a floor-projected visual target moving in pseudo-random trajectories (RTs). Top left: all paths throughout an example target pursuit session (light gray), all RT pursuit paths (dark gray), and all RTs of the visual target (blue). Remaining plots depict 5 example pursuits with trial-starting location (X), approximate location of target interception (circle), and path to reward retrieval (purple) marked. Rat trajectories are depicted in light gray and target trajectories are in blue.
(B) Top left: all paths throughout an example target pursuit session (light gray), all pursuits along the characteristic trajectory (CTs; dark gray), and all characteristic paths of the visual target (blue). Remaining plots depict 3 example characteristic trajectories marked as in (A).
(C) Quantification of the temporal relationship between the animal and the visual target. Top plot: animal (x, dark gray; y, light gray) and target position (x, blue; y, light blue) across time on an example CT. Arrows illustrate temporal lag between rat and visual target position. Middle plot: correlation between rat and target position as a function of temporal shift of rat position relative to the target during RTs. Black line, mean of all trials. Purple lines, individual sessions. Bottom plot: same as above but for CTs. Position correlation curves are right shifted during CTs relative to RTs, indicating that rat and target positions were more temporally proximal during CTs. Vertical gray lines depict latency with peak correlation for each trial type.
(D) Mapping of visual target relative to the rat in egocentric coordinates. Top left: scheme for examining egocentric relationship between visual target and rat (see STAR methods). Bottom left: illustration of egocentric position of target relative to the rat independent of allocentric position or heading in the 120-cm-diameter circular environment. Top right: all visual target positions relative to the animal during mobility within an example pursuit session. Bottom right: mean target occupancy in egocentric coordinates across all animals and pursuit sessions (n = 132).
(E) Top: mean target occupancy in egocentric coordinates for all RTs across all animals and sessions. Bottom: same as above but for all CTs.
(F) Same as in (A and B), but for CT trials in which the animal executed a spatial shortcut (S).
(G) Median distance and bearing to the visual target for RT, CT, and S trials.
See also Figure S1; Videos S1, S2, S3, S4, S5, S6, S7, S8, and S9.
To explore the effect of navigational uncertainty on animal behavior, we randomly inserted “characteristic trajectories (CTs)” of the visual target among the RTs (Figures 1B and S1B; Videos S4, S5, and S6, n = 11 CTs per session, IQR = 7–15, median total duration of CTs within a session = 32.2 s, IQR = 17.3–47.7 s). CTs possessed a reliable shape that involved moving outbound from the initiation point to the opposite side of the arena, performing a U-turn, and returning inbound to a location displaced approximately 25 cm from the start point (Figures 1B and S1D). In contrast to RTs, each instance of a CT started and finished at approximately the same positions within the allocentric reference frame (as defined by visible distal cues; Figure S1D). As CTs involved movement along a stereotypical allocentric path, this trial type was distinct from RTs occurring within the same environment.
The presence of CTs introduced regularity in an otherwise stochastic navigational environment (Figure S1D). We questioned whether rats could learn the shape of the CT path through path integration despite its immersion among RTs. We hypothesized that after learning the existence of such a path, the animal would be able to predict the trajectory of the moving target during CTs and more closely track the stimulus compared with RTs. Indeed, temporal shifts of rat position relative to visual target position revealed that animals were approximately 250 ms (IQR = 200–300 ms) behind the location of the visual stimulus during random pursuits but only 150 ms (IQR = 100 −200 ms) behind during CTs (Figure 1C; gray vertical line, mean temporal lag yielding highest correlation between rat and target position; n = 132, Wilcoxon rank-sum test, z = 6.25, p = 4.20 × 10⁻¹⁰).
To further characterize pursuit behavior, we examined the distance and angle of the light stimulus relative to the animal in egocentric coordinates, irrespective of allocentric position within the environment or current heading (Figure 1D). Throughout the entirety of the pursuit block, which included both target pursuits and subsequent reward retrievals, the visual target occupied the full range of egocentric bearings and distances relative to the animal (Figure 1D). During actual pursuits, target position was primarily localized to a 90° range centered along the nasal axis of the animal regardless of trial form (i.e., CT or RT; Figure 1E). Distance to the target was slightly greater and more variable during CTs compared with RTs (RT median distance = 20.4 cm, IQR = 18.2–22.4; CT median = 21.7 cm, IQR = 19.1–23.3, Wilcoxon rank-sum test, z = −2.34, p = 0.02; RT median distance range = 9.6 cm, IQR = 8.38–11.3, CT median distance range = 11.5 cm, IQR = 9.45–14.1, z = −3.77, p = 1.66 × 10⁻⁴). Egocentric bearing to the target was unchanged between trial types (RT median = −2.41° [CCW], IQR = −17.4 – 11.6; CT median = 4.53 [CW], IQR = −4.79 – 13.8, Wilcoxon rank-sum test, z = 1.92, p = 0.05), but the range of egocentric bearing was substantially reduced during CTs (RT median bearing range = 50.4°, IQR = 44.1–56.9; CT median bearing range = 28.3°, IQR = 23.3–38.2, Wilcoxon rank-sum test, z = 8.63, p = 6.17 × 10⁻¹⁸).
The increased maintenance of a consistent angular position relative to the visual cue on CTs indicated that rats had internalized the sequence of actions, headings, and positions that collectively composed these known paths. In support of this interpretation, rats demonstrated knowledge of the structure of CTs by exhibiting shortcutting behavior (Figure 1F; median shortcuts of CTs per session 11.1%, IQR = 0%–32.9%; n = 1 shortcut trials per session, IQR = 0–3). Shortcuts primarily involved interception of the visual target at the apex of the CT trajectory (Figure 1F; Videos S7, S8, and S9) but took many different forms (Figures S1C and S1D). Shortcuts involved navigation through the region bordered by outbound and inbound segments of the CT and could be distinguished from non-shortcut trials in two ways. First, rat distance to target increased on shortcut trials prior to interception (Figure 1G, distance shortcuts = 26.3 cm, IQR = 23.6–29.5 cm; CT = 22.3 cm, IQR = 19.9–24.9 cm; RT = 21.6 cm, IQR = 19.3–23.2 cm; Kruskal-Wallis test with Tukey-Kramer, n = 91, χ2 = 54.0, p = 1.9 × 10⁻¹²). Second, egocentric bearing to the target was increased on shortcuts compared with full CTs (Figure 1G, median bearing shortcuts = 29.2°, IQR = 10.0°–41.5°; CT = −1.4°, IQR = −8.4°–11.2°; RT = 13.4°, IQR = 0.2–20.8 cm; Kruskal-Wallis test with Tukey-Kramer, n = 91, χ2 = 60.2, p = 8.4 × 10⁻¹⁴). Variability in trial number, duration, and sensorimotor behavior precluded an indepth analysis of neural correlates supporting navigation during RT, CT, and shortcut trajectories in the current dataset. Regardless, our observations demonstrate that rats pursue moving visual stimuli and make predictions about target trajectories in an insightful manner.
Nonlinear self-motion correlates of PPC cells
We recorded 302 neurons from PPC (n = 5 rats, n = 113 sessions) during target chasing (Figure S2). For comparison, pursuit sessions were paired with preceding and/or succeeding FE sessions within the same arena and no visual target present. Pursuit blocks were longer in temporal duration than FE to yield adequate numbers of pursuits (pursuit block median length = 22.7 min, IQR = 21.1–25.1; FE median length = 12.3 min, IQR = 10.9–15.7), but animals engaged in target chasing behavior for only a brief amount of time within this period (median time pursuing target = 3.02 min, IQR = 2.32–3.92).
As a consequence of task structure, rats exhibited lower median linear speeds during the full pursuit session than during FE (Figure S3A). However, linear speeds during actual target pursuits were greater than those observed in FE (Figure S3A, n = 113 sessions, speed FE = 21.7 cm/s, IQR = 17.3–24.6 cm/s; full pursuit = 13.9 cm/s, IQR = 11.4–17.0 cm/s; median linear speed in pursuit = 47.6 cm/s, IQR = 44.7–51.7, Kruskal-Wallis test with Tukey-Kramer, n = 113, χ2 = 255.3, p = 3.67 × 10−56). Absolute angular velocity (AV) was highly similar between the two full sessions but was reduced during actual pursuit epochs as target pursuits were subjected to less abrupt angular deviations (Figure S3B, n = 113 sessions, average absolute AV FE = 74.9°/s, IQR = 70.8°–78.9°/s; full pursuit = 78.9°/s, IQR = 75.1°–83.8°/s; actual pursuits = 59.0°/s, IQR = 53.5°–71.7°/s; Kruskal-Wallis test with Tukey-Kramer, n = 113, χ2 = 85.4, p = 2.85 × 10⁻¹⁹). Autocorrelations of self-motion variables revealed greater regularity during target chasing (Figures S3D and S3E).
We next calculated linear and angular velocity tuning curves for each task for all PPC neurons (Figure 2A). All analyses of neural data combined all phases of the pursuit session. Tuning curves were constructed on the basis of matched sampling of linear and angular velocities for pursuit and FE sessions. We fitted true and randomized tuning curves with a uniform distribution, a linear model, and a Gaussian-modified linear model (GML). Neurons with significant linear or GML model fits (relative to the uniform fit) and with significant within session reliability were deemed sensitive to self-motion.
Figure 2. Nonlinear self-motion correlates of PPC are modulated by navigational demands.

(A) Linear (top) and angular (bottom) speed tuning curves for 6 PPC neurons (columns, mean ± SE). Dashed lines are best model fit and are shown only for tuning curves that had significant modulation. Aii, a neuron with Gaussian-like nonlinear linear speed tuning; Aiii, a neuron with robust firing during immobility.
(B) Linear speed tuning curves for both FE and pursuit epochs for all PPC neurons with significant modulation. Top plots: linear speed tuning curves for neurons that had greater mean activation during FE (left column), sorted by peak linear speed bin in FE. Bottom plots: linear speed tuning curves for neurons that had greater mean activation during pursuit (right column), sorted by peak linear speed bin in pursuit.
(C) Same as (B), but for neurons with significant angular speed tuning.
See also Figures S2 and S3.
A total of 56.6% (n = 171/302) of PPC neurons met criteria for either linear or angular speed tuning during either target pursuit or FE (Figures 2B and 2C). Linear speed tuning was more prominent in PPC (Figure 2B; 50.6%, n = 153/302) than angular speed related activation (Figure 2C; 28.8%, n = 87/302), and most angular tuned neurons were also sensitive to linear speed (79.3%, n = 69/87). 51.0% of all putative principal neurons were influenced by self-motion (45.3% linear velocity modulated, n = 111/245 principal cells, 25.3% angular velocity modulated, n = 62/245 principal cells, n = 62/87 [71.3%] of all angular velocity modulated including interneurons). Nearly all putative interneurons sensitive to movement (80.7%, n = 46/57) were modulated by linear speed (91.3% n = 42/46); fewer were modulated by angular velocity (54.3%, n = 25/46).
For many cells, speed tuning curves appeared nonlinear. We therefore compared fits for the linear and GML models. Most linear speed-sensitive cells showed significant improvement to model fit when Gaussian terms were included, indicating high incidence of nonlinear relationships (Figure 2A; dashed lines; 75.8%, n = 116/153, F test linear versus linear + Gaussian, F(3,24) = [3.01–4480.2], p = [0–0.049]). Many nonlinear speed relationships resembled previously reported saturating speed tuning (Figure 2A; Hinman et al., 2016); others had firing rate peaks at specific linear speeds (Figure 2Aii). The latter group included a subset with peak rates during immobility (Figure 2Aiii). Most tuning curves of angular velocity-sensitive PPC cells were best fitted by GMLs (87.4%, n = 76/87, F test linear versus linear + Gaussian, F(3,29) = [2.96–130.43], p = [0–0.049]). Many angular speed tuning curves possessed Gaussian characteristics with receptive fields spanning restricted ranges of angular movements rather than linear functions transitioning between clockwise (CW) and counterclockwise (CCW) movements (Figures 2A and 2C).
PPC self-motion correlates exhibit two forms of gain modulation as a function of navigational context
Consistent with flexible recruitment of PPC during increased navigational demands, the number of neurons with self-motion sensitivity increased during pursuit (FE linear speed, n = 96/302, 31.8%; pursuit linear speed, n = 126/302, 41.7%; FE angular speed, n = 45/302, 14.9%; pursuit angular speed, n = 72/302, 23.8%). Individual neurons exhibited similar firing as a function of self-motion between pursuit and FE even if the neuron only reached criterion for detection in one condition (Figures 2B and 2C; Spearman’s ρ FE versus Pursuit, median ρ linear speed = 0.60, IQR = 0.37–0.79; median ρ angular speed = 0.57, IQR = 0.38–0.74).
We hypothesized that increased self-motion sensitivity during pursuit could arise from gain modulation of the relationship between self-motion and neuronal activation. We examined mean firing rate differences in self-motion tuning consistent with additive gain modulation that, despite potentially degrading self-motion selectivity, evidenced sensitivity to navigational context (Figure 3A). Subsets of PPC neurons exhibited increases or decreases in mean overall rate as a function of self-motion and behavioral epoch (Figures S4A and S4B). Figures 2B and 2C show all linear and angular speed tuning curves for both FE and pursuit blocks, split into subsets with increased (P > FE) or decreased (P < FE) firing rate during pursuit and sorted by position of peak self-motion tuning within their “preferred” navigational epoch.
Figure 3. Gain modulation of self-motion tuning as a function of navigational demand.

(A) Schematic of additive (top) and multiplicative (bottom) gain modulation on self-motion tuning curves. Gray curve depicts hypothetical relationship between self-motion and firing rate for a baseline session. Colored curves depict hypothetical relationship between self-motion and firing rate for a session in which either multiplicative or additive gain modulation manifests. Additive gain modulation reduces the signal-to-noise ratio (SNR; SNRa < SNR), while multiplicative gain produces an enhanced SNR for the modulated session (SNRm > SNR).
(B) Three PPC neurons with rate differences between FE and pursuit that are concentrated at specific linear (top row) or angular (bottom row) speeds. Left plot depicts parameters of Gaussian-modified linear fits. Sloped dashed lines indicate linear regression. Self-motion receptive fields are fitted by an additive Gaussian function. The center (D) and amplitude (C) of the Gaussian map, the peak of the self-motion receptive field, and its magnitude above the linear fit, respectively.
(C) Shaded line plots depict mean population tuning for linear (top) and angular (bottom) speed-sensitive neurons for pursuit (pink) and FE sessions (gray). Dashed lines depict mean percent difference in firing rate as a function of speed (dark blue, PPC neurons with greater activation in pursuit than FE [P > FE]; light blue, PPC neurons with greater activation in FE [P < FE]).
(D) Peak normalized differences in receptive field amplitude between pursuit and free explore (▴μAmp) versus difference in mean firing rate (▴μFR) for PPC neurons with significant linear and/or angular speed correlates.
(E) Position of linear and angular receptive fields for pursuit versus FE.
See also Figures S3 and S4.
Significant proportions of linear-speed-modulated cells had greater mean firing rates during pursuit than FE (binomial test for proportion of linear speed cells with greater activity in pursuit versus FE, n = 153, n P > FE = 101, p = 9.17 × 10⁻⁵; angular speed cells, n = 87, n P > FE = 48, p = 0.39). Linear speed sensitive neurons with increased firing during pursuit (P > FE) returned to baseline firing during a second FE session (Figure S4B). PPC neurons composing the P < FE subset did not have systematic modulation and showed greater similarity in mean firing rate for neighboring sessions, suggestive of ensemble drift or sustained state changes following task engagement (Figure S4B).
In addition to additive gain modulation, self-motion tuning differences between pursuit and FE could be restricted to specific ranges of movement speeds consistent with multiplicative gain modulation (Figures 3A and 3B). In support of this hypothesis, differences between pursuit and FE were associated with changes in the distribution of peaks in self-motion-related activation (Figures 2B and 2C) and the profile of mean tuning across the full population (Figure 3C). We compared parameters of GML fits with self-motion tuning curves for pursuit and FE. The amplitude parameter of the GML (c) reflects additional activation above a linear fit and, thus, models within receptive field firing magnitude (Figure 3B). PPC neurons exhibited significant amplitude alterations consistent with multiplicative gain modulation (Figures 3D and S4C). While we also observed slight differences in the magnitude and form of linear acceleration between pursuit and FE (Figures S3C-S3I), it is notable that PPC neurons that were (Figure S3G) or were not sensitive (Figure S3H) to linear acceleration showed no context related differences in multiplicative gain modulation (Figure S4J, speed + acceleration, n = 101; speed without acceleration n = 52; Kolmogorov-Smirnov test, D = 0.09, p = 0.90). As was the case with mean rate changes between behaviors, amplitude gain alterations were, in most cases, modulated in a systematic fashion (Figures S4D and S4E). Within-receptive-field-amplitude differences were correlated with alterations of mean rate between pursuit and FE, indicating that many neurons were subjected to both additive and multiplicative gain modulation in pursuit versus FE (Figures 3A and 3D).
In pursuit, receptive field amplitude was increased for preferred linear speeds and decreased for preferred angular speeds (Figure S4C). These changes matched animal behavior during active target chasing wherein rats typically exhibited higher linear speeds and lower angular speeds compared with FE (Figure S3; recall that tuning curve calculation controlled for differences in self-motion sampling). In parallel with the pattern of changes to receptive field amplitude, the center parameter (d) of model fits (Figure 3B), corresponding to the location of the Gaussian component, shifted to higher linear speeds during pursuit compared with FE (Figure 3E; Wilcoxon sign rank test for zero median, n = 153, z = 2.47, p = 0.0134). Angular speed preferences were unchanged between pursuit and FE (Wilcoxon sign rank test for zero median P – FE, n = 87, z = −1.38, p = 0.17). Thus, both the gain and the profile of self-motion tuning curves were modulated to match animal behavior, indicating that self-motion correlates in PPC are highly adaptive to behavioral demands.
Decoding of self-motion state is modulated by navigational context
The observed multiplicative gain modulation suggested that the signal-to-noise ratio (SNR) for self-motion coding was altered as a function of task and greater in pursuit (Figure 3A). We tested this using a decoding analysis by training a maximum correlation classifier to predict linear and angular speed from firing rate (Figures 4A and S5). Classifier accuracy was quantified by correlating the predicted linear or angular speed with the true value, as exemplified in Figure 4A.
Figure 4. Multiplicative gain modulation produces enhanced dynamic range and decoding of self-motion correlates.

(A) Left: a linear speed-sensitive neuron with multiplicative gain modulation. Right: decoding of linear speed using spiking activity of the same neuron in FE (top) and pursuit (bottom). Correlation (Spearman’s rho, ρ) between predicted speed (black/pink) and true speed (gray) is indicated above each plot.
(B) Linear speed decoder for pursuit versus FE. Inset: median + IQR of decoder accuracy for FE (black) and pursuit (purple).
(C) Left plot: linear speed tuning curves for 8 simultaneously recorded PPC neurons in FE and pursuit. Rows, linear speed tuning curves of the same neurons recorded in both conditions. Colormap, low (purple) to maximum firing (yellow) across both sessions. Right: example population decoding of linear speed for FE (top) and pursuit (bottom).
(D) Ensemble decoding accuracy for pursuit versus FE.
See also Figure S5.
Consistent with enhanced SNR for self-motion tuning in pursuit, linear speed decoding was significantly more accurate during pursuit for most PPC neurons with linear speed sensitivity (Figure 4B, binomial test for decoding accuracy of linear speed pursuit versus FE, n = 153, n P > FE = 103, p = 2.20 × 10⁻⁵; Wilcoxon rank-sum test, median accuracy (ρ) pursuit = 0.20, IQR = 0.1–0.32; ρ FE = 0.14, IQR = 0.05–0.28, z = 2.35, p = 0.02). There was no significant bias in angular speed decoding accuracy in pursuit versus FE (Figure S5, binomial test, pursuit versus FE, n = 87, n P > FE = 49, p = 0.28; Wilcoxon rank-sum test, z = 1.16, p = 0.25). Similar self-motion decoding results were observed when simultaneously recorded ensembles (n ≥ 5 neurons, n = 22 sessions) were utilized (Figures 4C, 4D, and S5, Wilcoxon rank-sum test, median ensemble decoding accuracy [ρ] of linear speed pursuit = 0.5, IQR = 0.45–0.57; median ρ FE = 0.42, IQR = 0.34–0.48, z = 2.48, p = 0.013; angular speed ρ pursuit = 0.12, IQR = 0.08–0.15; angular speed ρ FE = 0.13, IQR = 0.09–0.17, z = 1.19, p = 0.24).
Self-motion decoding is accurate for extended temporal windows during pursuit behavior
Spiking activity can exhibit temporally latent relationships to ongoing behavior (Figure S6). To test whether shifts in the temporal latency between spike trains and behavior would alter decoder accuracy, we shifted each neuron’s rate vector 2 s backward or forward in 100-ms increments relative to behavior and decoded self-motion. Importantly, if decoder accuracy increased during backward shifts, this implied that neuronal activation was correlated with the history of movement (i.e., retrospectively), whereas enhanced predictions following forward spike train shifts suggested that neuronal activation was prospectively related to locomotor state (Figures 5A and S6).
Figure 5. History-dependent spiking correlates are informative about self-motion state over extended temporal windows.

(A) Schematic of temporal relationship among spiking, self-motion, and decoding. Top: gray and purple lines, real and predicted linear speed, respectively. Gray shading, times of speed change. Colored arrows, direction of spike train temporal shift. Bottom: hypothetical spike trains for a single neuron with instantaneous (black), retrospective (pink), or prospective (blue) sensitivity to speed.
(B) Decoder accuracy as a function of spike train temporal shift for 4 PPC neurons in both FE (gray) and pursuit conditions (purple). Left column: 2 PPC neurons sensitive to linear speed. Right column: 2 PPC neurons sensitive to angular speed. Gray horizontal lines, the 99th, 50th, and 1st percentiles of randomized decoding accuracy (see STAR methods). Dots, preferred latency of spike train temporal shift yielding peak decoding.
(C) Decoding accuracy latency curves for all linear-speed-sensitive neurons, sorted by preferred latency within FE (left) and pursuit (right).
(D) Same as in (C), but for all angular speed sensitive neurons.
(E) Comparison between decoding accuracy at instantaneous (gray) and preferred latency (pink) across sessions for linear (top) and angular (bottom) speed sensitive neurons.
(F) Distribution of preferred shift latencies for linear and angular speed neurons in pursuit and FE.
(G) Differences in preferred latency between pursuit and FE for linear and angular speed neurons.
(H) Left: decoding accuracy latency curve for a linear-speed-sensitive cell in pursuit and FE with corresponding model fits (dashed lines). Colored horizontal bars are plotted at ~50% of the peak to visualize width differences between sessions. Right: decoder in pursuit versus FE for linear speed sensitive neurons.
(I) Same as in (H) but for the temporal window of angular speed decoding.
See also Figure S6.
For most neurons, the preferred latency yielding maximal decoder accuracy was non-instantaneous (Figures 5B-5D). Self-motion decoding accuracy at preferred latencies was significantly greater than the zero-lag instantaneous decoding for both FE and pursuit sessions (Figure 5E, Wilcoxon sign rank test, linear speed, n = 153, FE, z = −10.04, p = 9.8 × 10⁻²⁴; pursuit, z = −9.78, p = 1.39 × 10⁻²²; angular speed, n = 87, FE, z = −7.77, p = 7.85 × 10⁻¹⁵; pursuit, z = −7.67, p = 1.68 × 10⁻¹⁴). Decoding at the preferred latency during FE did not surpass decoding accuracy at the preferred latency in target pursuit (Wilcoxon sign rank test, linear speed, n = 153, z = −3.75, p = 0.0001). The opposite pattern was observed for angular speed decoding, accuracy that was greater during FE across all possible latencies (Wilcoxon sign rank test, linear speed, n = 153, z = −3.75, p = 0.0001; angular speed, n = 87, z = 2.91, p = 0.004).
To quantify temporal relationships between spiking and self-motion, we compared model fits to decoding accuracy latency curves between pursuit and FE. Preferred latencies for linear speed decoding across the population were biased toward history dependence in both FE and pursuit yet only reached significance for pursuit (Figure 5F; Wilcoxon sign rank for zero median, linear speed, n = 153, median FE = −10.9 ms, IQR = −313.5–210.7 ms, z = −1.14, p = 0.26; median pursuit = −57.3 ms, IQR = −280.3–181.4 ms, z = −2.12, p = 0.03). Distributions of preferred latencies also skewed retrospectively for angular speed decoding (Figure 5F; Wilcoxon sign rank for zero median, angular speed, n = 87, median FE = −252.8 ms, IQR = −371.7–106.2 ms, z = −6.08, p = 1.19 × 10⁻⁹; median pursuit = −189.4 ms, IQR = −411.4 to −66.1 ms, z = −4.75, p = 2.02 × 10⁻⁶). Overall, there were no significant changes in preferred latency for individual neurons between pursuit and FE, indicating that although parietal cortex neurons are more responsive to the history of self-motion, this preference is rigid and not task dependent (Figure 5G; Wilcoxon sign rank for zero median difference in preferred latencies, linear speed, z = −1.17, p = 0.24; angular speed, z = 1.34, p = 0.18). Similar retrospective biases and extended self-motion-encoding temporal windows were observed when we used a previously implemented self-referenced displacement analysis (Figure S6).
Examination of the temporal profile of decoding accuracy suggested that PPC neurons may exhibit extended temporal windows of movement integration under pursuit (Figures 5B-5D). To quantify the time window over which the spiking activity of individual neurons is related to past, present, and future self-motion states, we compared the width parameters of model fits with decoding latency curves between the two behavioral tasks (Figures 5H and 5I). The temporal window for accurate linear speed decoding was significantly longer in duration during pursuit compared with FE (Figure 5H; Wilcoxon sign rank test, n = 148, median pursuit – FE = 280 ms, IQR = 0.00–523 ms, z = −6.97, p = 3.13 × 10⁻¹²). The decoding window for angular speed was similarly extended during pursuit despite overall greater decoding accuracy during FE (Figure 5I; Wilcoxon sign rank test, n = 86, median pursuit – FE = 228 ms, IQR = 85–427 ms, z = −6.69, p = 2.31 × 10⁻¹¹).
The temporal duration of accurate self-motion decoding may arise as an artifact of the increased continuity of behavior during pursuit (Figures S3D and S3E). Numerous aspects of the data suggest that this is not the case. First, movement continuity was statistically greater in pursuit for linear speed (Figures S3D and S3E), yet the duration of decoding was temporally extended for both angular and linear speed during target chasing. If the extended window was epiphenomenal to behavior, we would not expect to also observe it for angular speed decoding. Furthermore, behavioral similarity over extended temporal windows was primarily driven by the presence of trial-like structure during pursuit, which resulted in the animal spending more time immobile than during FE (Figure S3). We analyzed spike train shifted decoding after excluding time frames in which the animal was not moving (speed < 5 cm/s). Longer windows of self-motion decoding during target pursuit were again observed when differences in immobility were accounted for (Wilcoxon sign rank test, linear speed, n = 152, median pursuit – FE = 149 ms, IQR = −40 to 402 ms, z = −5.81, p = 6.21 × 10⁻⁹; angular speed, n = 86, median pursuit – FE = 206 ms, IQR = 80–366 ms, z = −6.75, p = 1.48 × 10⁻¹¹). Collectively, these results indicate that the largest subset of parietal cortex neurons track the previous self-motion state of the animal irrespective of navigational context yet exhibit self-motion-related activation over elongated temporal durations during increased navigational demands (i.e., target chasing).
Parietal cortex tracks visual target position in egocentric coordinates
We next examined whether and how the pursuit target itself is integrated into PPC firing patterns. We hypothesized that neurons in PPC would be responsive to the bearing and/or distance of the target in egocentric coordinates. However, accurate detection of neurons that track the position of the visual target relative to the animal is complicated by the fact that pursuit behavior requires simultaneous covariation of spatial and self-motion variables that are known to modulate activation in cortical neurons.
Accordingly, we implemented a generalized linear model (GLM) to examine the relative influence of spatial (position and head direction), self-motion (angular and linear speed), and target position (egocentric bearing and distance to the visual target) on the probability of spiking (Figure 6A). We also included predictors for egocentric boundary vector-related tuning, a property of some PPC neurons (Gofman et al., 2019; Alexander et al., 2020). Many PPC neurons were significantly modulated by combinations of behavioral and spatial predictors (Figure 6B). As expected, large proportions of cells were sensitive to linear and angular speed. We also found large percentages of PPC neurons possessing sensitivity to the position of boundaries relative to the animal (Figures S7A and S7B). Consistent with integration of target location into PPC firing activities, 33% of PPC neurons (n = 100/302) had significant decrements to model fit when the predictor for egocentric visual target position was dropped from the model (Figure 6B; “VT”). Approximately one-half of neurons with egocentric boundary correlates were also modulated by the egocentric position of the visual target, suggesting that neurons with this coding property can map and integrate the egocentric position of multiple environmental features simultaneously (Figure S7C). Furthermore, nearly one-half of neurons with self-motion sensitivity also responded to the position of the target relative to the animal (Figure 6F).
Figure 6. PPC neurons track self-motion and the egocentric position of the visual target.

(A) Schema of generalized linear modeling (GLM) framework. Left column: illustrations of different predictor classes. Right column: 17.5 s of Z-scored values for the different predictor classes. Black lines, directional predictors. Shaded colors, all other predictors. Bottom plots: GLM-derived probability of spiking for each timestamp (lambda) and real spike train.
(B) Proportion of all PPC neurons sensitive to each predictor class (diagonal) and all pairwise combinations of predictor classes (off diagonal) for FE (left) and pursuit (right). LV, linear velocity; AV, angular velocity; HD, head direction; Pos, allocentric position; EB, egocentric boundary; VT, visual target.
(C) Rat-to-target ratemaps. Left plot: heatmap of egocentric occupancy of target relative to the rat (white, low occupancy; blue, high occupancy). Middle: trajectory plot of all egocentric target positions (gray) and positions where a single neuron spiked (blue). Right: rat-to-target ratemap of a neuron active when the target is to the animal’s front left.
(D) Rat-to-target ratemaps for 9 PPC neurons with significant sensitivity to the egocentric position of the target. Top row: 3 neurons with broad bearing selectivity and limited target distance information. Bottom 2 rows: 6 neurons with more restricted target-position-receptive fields possessing both bearing and distance components.
(E) Properties of egocentric target receptive fields. Left: preferred bearing of all PPC neurons with significant tuning to the target in gray. Dark blue, preferred bearing for PPC neurons with reliable bearing. Middle: widths of egocentric bearing tuning. Right: preferred distances to visual target. All colors as in left plot.
(F) PPC neuron with simultaneous sensitivity to the egocentric position of the visual target and self-motion with pursuit related gain modulation. Left plot: rat-to-target ratemap. Middle plot: linear speed tuning curves in pursuit (purple) and FE (black). Right: angular speed tuning curves for both sessions.
(G) Left 2 plots: cumulative density functions of absolute difference in receptive field amplitude (i.e., multiplicative gain) between pursuit and FE for linear and angular speed-sensitive neurons conjunctively sensitive to target position (VT, purple) or not (VT, gray). Significant rightward shift of VT curve indicates that neurons with target sensitivity exhibited greater gain modulation. Right 2 plots: same as left plots, but for absolute difference in mean rate (i.e., additive gain) between self-motion-sensitive neurons with or without VT sensitivity.
See also Figure S7.
To visualize the responses of target-sensitive neurons, we computed rat-to-target egocentric ratemaps using, for each spike and position frame, the bearing and distance to the visual target relative to the animal (Figure 6C). Robust target position-receptive fields tended to fall into one of two forms: (1) restricted receptive fields possessing both a bearing and distance component (Figures 6C and 6D, bottom rows) or (2) broader receptive fields primarily sensitive to egocentric bearing to target (Figure 6D, top row). Preferred bearings were distributed bilaterally with an average tuning width of approximately 70° (Figure 6E). The distribution of preferred distances fell within two modes ranging from animal proximal (<20 cm) to more distal (>30 cm), potentially reflecting the two forms of target-to-rat-receptive fields. The distribution of preferred bearings was skewed in front of the animal for neurons with significant target sensitivity and reliable bearing tuning across non-overlapping task epochs (Figure 6E). Accordingly, preferred bearings behind the animal likely reflect the influence of other covariates on rat-to-target ratemaps (e.g., actions, position of boundaries, etc.).
Finally, we suspected that multiplicative gain modulation of self-motion-related activation could emerge in neurons that simultaneously tracked the visual target. In support of this hypothesis, linear-speed-sensitive neurons with target sensitivity had significantly greater differences in within-receptive-field amplitude (i.e., multiplicative gain) and mean rate (i.e., additive gain) between pursuit and FE than the subset of neurons that did not possess responsivity to the target (Figure 6G; linear speed amplitude difference: VT, n = 65, median = 1.02 Hz, IQR = 0.50–1.85 Hz; no VT, n = 88, median = 0.57 Hz, IQR = 0.27–0.93 Hz; Kolmogorov-Smirnov test, D = 0.32, p = 8.46 × 10⁻⁴; linear speed mean difference: VT, median = 0.86 Hz, IQR = 0.41–1.16 Hz; no VT, n = 88, median = 0.49 Hz, IQR = 0.16–0.98 Hz; Kolmogorov-Smirnov test, D = 0.27, p = 0.008). No significant differences were observed between the populations of angular velocity-sensitive neurons with or without visual target sensitivity (Figure 6G; angular speed amplitude difference, D = 0.14, p = 0.81; mean difference, D = 0.19, p = 0.44). These results indicated that gain modulation of linear speed tuning potentially arose from the multiplexing of movement commands with information relating to the target position in egocentric coordinates.
DISCUSSION
We developed an ethologically inspired paradigm wherein rats pursued moving visual targets in a manner akin to hunting or social chase behaviors (Calhoun, 1963). We established that (1) rats can be trained to chase purely visual stimuli and (2) rats exhibit predictive behaviors manifesting as shortcuts to target interception for learned trajectories. We also demonstrated that self-motion tuning in PPC is strongly impacted by navigational context. Specifically, the relationship between spiking activity and self-motion was subject to both mean rate modulation and multiplicative gain modulation, which yielded enhanced decodability of movement in pursuit relative to FE. Finally, we showed that individual PPC neurons tracked both self-motion and the egocentric position of the visual target. Collectively, these results indicate that PPC adaptively codes for multiple task-relevant idiothetic and external variables over temporal integration windows related to the statistics of goal-directed behavior.
Prediction, shortcuts, and memory
Pursuit behaviors demand continuous tracking of a target and mirroring of its trajectories. If the trajectory of the target can be predicted on the basis of previous experience, pursuit behaviors may also include attempts at target interception. Such behavior would require short-term memory processes involving motion integration and prediction. Indeed, pursuit on probe trials using a “characteristic” path having a stable shape and location evidenced seconds-long integration of trajectories. This manifested as shortcutting behavior yielding interception of the target’s path. Shortcuts occurred even though the full trajectories themselves could not be viewed in full at any given moment. Thus, predictive behaviors in our data demonstrate that male rats can learn route shapes and quickly recognize known trajectories of the target as a simple function of time-integrated experience. The emergence of inferential behavior in our task established a behavioral framework by which prediction in freely moving rodents can be further examined.
Adaptive PPC self-motion tuning and gain modulation
We examined PPC neurons that, in navigating rodents, exhibit conjunctive encoding of egocentric goal location, locomotor actions such as turning, and progress through a route (Chen et al., 1994; Whitlock et al., 2012; Wilber et al., 2014, 2017; Nitz, 2006, 2012). Consistent with previous reports, the majority of PPC neurons were tuned to linear and/or angular speed during both pursuit and FE but that this tuning was dynamically modulated in several ways as a function of task (Whitlock et al., 2012). The profiles of movement-related tuning took many forms including nonlinear functions (Hinman et al., 2016). Tuning functions became more nonlinear during pursuit producing greater proportions of neurons sensitive to self-motion compared with FE (Figure 2).
PPC neurons exhibited increased mean rates during chase behavior, even with control for self-motion differences between each locomotor regimen (Figures 2 and S3). This presented as additive gain modulation across the range of velocities examined. Multiplicative gain modulation was also observed and was primarily restricted to tuning curve peaks during pursuit (Figures 3 and S4). This parallels multiplicative gain modulation observed in sensory cortices wherein multimodal contextual information increases response magnitude without altering base receptive field properties (Ferguson and Cardin, 2020; Niell and Stryker, 2010; Salinas and Thier, 2000). Our data provide evidence of such gain modulation for idiothetic signals in freely moving rats.
Adaptation of self-motion tuning curves as a function of task was seen in two other ways that were related to differences in movement between FE and pursuit. During chasing, target pursuit dictated rat movement at higher linear speeds with fewer abrupt changes to angular velocity. In keeping with these changes in the distributions of self-motion, firing rate peaks in tuning curves shifted to higher linear speeds. Moreover, decoding of self-motion was enhanced for linear speed but not angular speed in pursuit, again matching shifts in behavior required to perform the task. Thus, adaptations in PPC self-motion tuning followed variation in how the animal moved within the environment between navigation tasks.
Self-motion integration in PPC
Evidence for self-motion integration, as opposed to instantaneous self-motion coding, was established by shifting spike trains relative to behavioral data and determining the accuracy of self-motion prediction (Figure 5). The distribution of optimal latencies between instantaneous firing rate and self-motion was broad but biased to retrospective tuning in contrast to earlier reports of primarily anticipatory responses in PPC (Moore et al., 2017; Whitlock et al., 2012). It is possible that the observed history-dependent bias is related to pursuit behavior. Many PPC neurons are conjunctively sensitive to movement, sensory, and spatial variables. It is unlikely that individual PPC neurons would always function in an anticipatory or history-dependent manner, as this would require tight covariance among these variables. We also note that retrospective bias in linear speed decoding reached significance only under pursuit conditions, that some neurons were reliably tuned prospectively, and that temporal offsets in peak tuning accuracy were generally stable across conditions. Retrospective biases reported here extend previous work showing that PPC is critical for decision making based on prior trial outcomes to the domain of navigation (Morcos and Harvey, 2016; Hwang et al., 2017; Akrami et al., 2018; Runyan et al., 2017). Furthermore, retrospective coding of self-motion could support memory processes critical for the internalization of characteristic routes required for the execution of predictive shortcuts. In this interpretation, PPC operates as the history-tracking component of a cross-regional implementation of a Kalman filter for prediction. If so, movement-related correlates in the region might be driven by motor efference copy entering PPC from M2.
Across neurons, self-motion prediction accuracy exceeded chance for temporal relationships between spiking and behavior on the order of seconds extending both behind and ahead in time. Temporally extended windows of linear speed decoding have previously been reported, suggesting that movement tracking at behaviorally relevant timescales is a general property of cortex (Dannenberg et al., 2019). PPC neuronal activity exhibited these temporally extended relationships to self-motion in both FE and pursuit. Because this same population of neurons exhibits tuning that spans all combinations of linear and angular velocity values, it follows that PPC populations together reflect the past, present, and future trajectory of the animal.
Such time-lagged tuning of locomotor states perhaps explains why PPC ensembles produce unique firing patterns for all positions along a path even when specific actions such as left/right turns and directions of travel repeat multiple times (Nitz, 2006, 2012). Under such conditions, route positions sharing the same momentary linear and angular velocity combination may nevertheless differ in the linear and angular velocity sequences that precede them.
Critically, self-motion temporal integration of PPC neurons was extended during pursuit where linear and angular speeds were sustained for longer temporal durations. In this way, the tuning properties of PPC neurons adapted to the distribution of locomotor variables in different locomotor regimens. We speculate that such adaptation allows the system to encode task-related locomotor sequences and their associated trajectories over a range of distances per unit time (Andersen and Cui, 2009).
Mechanisms of PPC adaptation and efferent targets
The most obvious sensory difference between pursuit and FE is the presence of the visual target. We recorded in medial PPC (mPPC/V2m), where there is less innervation from primary visual cortex or thalamic visual areas (Reep et al., 1994; Nitz, 2009; Wilber et al., 2015; Olsen and Witter, 2016; Olsen et al., 2017). However, it is important to note that analogous anatomical regions in mice are considered part of the higher visual cortex (Glickfeld and Olsen, 2017; Hovde et al., 2019; Gilissen et al., 2021) and that mPPC receives dense afferents from dysgranular RSC (dRSC) where visually evoked responsivity has been reported (Fischer et al., 2020; Mao et al., 2020; Powell et al., 2020; Zhuang et al., 2017). Unsurprisingly, we find that a subset of PPC neurons were sensitive to the egocentric position of the visual target. Accordingly, the observed changes to firing rate gain, self-motion decoding, and non-instantaneous trajectory integration could result purely from increased activity relating to the presence of a visual stimulus (Keshavarzi et al., 2022). Beyond the influence of purely visually evoked excitation, the target undoubtedly engages arousal and attentional mechanisms known to modulate cortical activation and facilitate gain modulation (Ferguson and Cardin, 2020; Reynolds et al., 2000; Vinck et al., 2015; Bucci et al., 1998; Colby and Goldberg, 1999; Tingley et al., 2014; Stitt et al., 2018). Further investigation of the role of visual and attentional processing streams, including the role of the basal forebrain, on the observed adaptations to self-motion processing in PPC during pursuit behavior is needed (Disney et al., 2007; Goard and Dan, 2009; Minces et al., 2017; Záborszky et al., 2018; Fu et al., 2014; Ferguson and Cardin, 2020).
Conclusions
We conclude that changes to PPC dynamics during pursuit illustrate systematic and flexible processing recruitment in the service of behavioral demands associated with a specific navigational context. Pursuit-related changes to PPC self-motion computations appear ideal for coordinating movement and trajectories at multiple timescales in response to the position of visual targets and may complement the pursuit-related dynamics in the striatum, SC, and hypothalamus by enabling predictive behaviors (Schiller and Stryker, 1972; Cooper et al., 1998; Hoy et al., 2016, 2019; Shang et al., 2019; Zhao et al., 2019; Kim et al., 2019).
Limitations of the study
There are important limitations to consider with respect to the current study. First, and most critical in our opinion, is the lack of a comparison of neural dynamics between random, characteristic, and shortcut trajectories. Unfortunately, the lack of standardization in spatial position, self-motion, temporal duration, and overall occurrence of different trial types precluded an indepth analysis of any differences in neural activity between them. Future work should automate the presentation of the visual stimulus in a closed-loop manner to more closely match these variables across different trajectory types. In addition, we were unable to determine how the presence of visual stimuli and changes to behavioral demands independently influence neural activity patterns in the current experimental design. The inclusion of a second, non-behaviorally relevant, visual stimulus in follow-up studies would enable a dissociation of these factors. Beyond changes to the task, additional experiments should seek to manipulate PPC neural circuits during different epochs associated with predation behavior. Although we doubt that PPC inactivation would not produce behavioral impairments, it would be interesting to explore the influence of PPC afferent and efferent connectivity with respect to predictive shortcuts. Finally, an examination of sex differences on pursuit behavior would be an excellent avenue of future research.
STAR★METHODS
RESOURCE AVAILABILITY
Lead contact
Further information and requests for resources should be directed to and will be fulfilled by the lead contact, Andrew S. Alexander (asalexan@gmail.com).
Materials availability
This study did not generate any new reagents.
Data and code availability
Datasets supporting the current study will be shared by the lead contact upon request.
Original code has been deposited at Zenodo (https://doi.org/10.5281/zenodo.6081293).
Any additional information required to reanalyze the data reported in this paper is available from the lead contact upon request.
EXPERIMENTAL MODEL AND SUBJECT DETAILS
Male Long-Evans rats (n = 6, 3–6 months of age) served as behavioral subjects and were housed individually and kept on a 12-h light/dark cycle. Animals were habituated to the colony room and handled daily for a period of 1–2 weeks prior to training on the visual target chasing task. Rats were food restricted to approximately 85–90% of their free-fed weight. Water was available continuously. All experimental protocols adhered to AALAC guidelines and were approved by IACUC and the UCSD Animal Care Program.
METHOD DETAILS
Target chasing behavior
Animals were trained to pursue a moving light stimulus in a 122 cm diameter circular arena for reward. The visual stimulus was a 1.25 cm dot from a bright green laser pointer controlled by one of two experimenters in the experimental room. The arena was placed on a table 92 cm above the ground. Boundaries of the arena were 2.5 cm in height and fixed distal cues were outside of the arena across all sessions. Prior to the initiation of training all rats were handled extensively.
Acquisition of visual target pursuit behavior required behavioral shaping over approximately 1–2 months of training. Rats were initially habituated to the arena for 1 week by randomly placing cereal bits around the arena and allowing the animal to free forage for 20 min per day. After arena habituation the visual stimulus was introduced. During this stage, 5–10 cereal pieces would be present on the arena at any given time and the experimenter would direct the visual stimulus to hover on top of rewards that the animal was about to ingest. After the animal acquired a reward that the light stimulus was positioned on, the stimulus would shut off in order to create an association between the visual target and reward. After approximately 1 week of this process the next phase of shaping began. In the third stage, a single cereal piece was tossed to a random position in the arena at a time. The visual stimulus hovered over the reward and shut off when the animal retrieved it. This step repeated continually for a 20-30-min session for approximately 1–2 weeks or until the animal was readily running to the visual target/reward position. In the final shaping phase, the onset of the stimulus would occur in the absence of a reward in the arena. Because the visual target was associated with reward, the animal would approach it. Prior to the rat reaching the stimulus, the experimenter would move the visual target smoothly away from the animal and in most cases the rat would engage in pursuit. If the rat intercepted the stimulus it would disappear, and a reward would be tossed into a random location within the arena. The visual target would then reappear hovering over the reward location, and again disappear after the animal retrieved the reward. Following reward consumption, the next trial would begin by activating the visual stimulus in a pseudorandom location within the arena and the aforementioned process would repeat. Over approximately a 1-month period (duration was dependent on the behavior of individual rats), the length of pursuit could be extended without causing the animal to lose interest or become frustrated.
After shaping, rats would chase the visual target for approximately 25 min per day during concurrent in vivo electrophysiological recordings. The visual target primarily moved in pseudorandom trajectories (RTs) but characteristic trajectories (CTs) of the target were also instantiated after animals were frequently chasing the visual target. For CTs, the light target would execute a stereotypical path that began and ended at the same approximate allocentric locations within the arena and recording room. CTs occurred less frequently than RTs and were randomly interspersed throughout the target pursuit block. Two CTs were utilized across animals. CT1 moved from north to south and required the animal to execute a clockwise U-Turn while CT2 moved from east to west and required a counterclockwise U-Turn (Figure S1). Target pursuit blocks could occur before or after free foraging sessions conducted in the same arena (approximately 10–20 min). In a subset of recordings, the pursuit session was conducted between two free foraging sessions of approximately 10–15 min each.
Surgery
After readily engaging in 20+ pursuits of the visual target in a session, rats were surgically implanted with tetrode arrays (twisted sets of four 12 micrometer tungsten wires or 17 micrometer platinum-iridium wires) fitted to custom-fabricated microdrives that allowed movement in 40 μm increments. Each microdrive contained 4 tetrodes. Rats were implanted with 3 total microdrives positioned in either posterior parietal cortex (PPC) or retrosplenial cortex (RSC, data not shown). Rats were anesthetized with isoflurane and positioned in a stereotaxic device (Kopf Instruments). Following craniotomy and resection of dura mater overlying cortical regions, microdrives were implanted relative to bregma (PPC, A/P −3.8 mm, M/L ± 2.2 mm, D/V −0.5 mm; RSC, A/P −5.8 mm, M/L ± 0.7–1.2 mm, D/V −0.5mm, 10–12° medial/lateral angle). Recordings were conducted primarily from deeper cortical layers (IV-VI) although exact laminar location is difficult to ascertain with drivable electrode arrays so we did not parse PPC neurons into deep versus superficial sub-groups. 1 of the 6 rats trained on the behavior did not have a PPC implant and is therefore included in behavioral analyses (Figure 1) but not included in analyses of neural data (remaining figures).Further, two rats performed the task well but had low single unit yields in PPC (KB09 = 4 total neurons; KB10 = 7 total neurons). These animals are included in pooled data analyses as even within these small populations examples of the broader findings were observed. 2 of the 3 remaining rats yielded approximately 50 neurons (LP06 = 46 total neurons; KB20 = 51), while the final rat yielded a substantially greater number of cells (KB19 = 194 neurons). Examples of the main behavioral observations (including shortcuts), additive and multiplicative gain modulation, enhanced movement decoding over extended temporal windows, and egocentric visual target mapping were observed in all rats. However, to verify that the main effects described in the study were not driven by one animal, we dropped KB19 from all pooled analyses and found that main results were recapitulated.
Recordings
Each microdrive had one or two electrical interface boards (EIB-16, Neuralynx) individually connected to amplifying headstages (20×, Triangle Biosystems). Signals were initially amplified and filtered (50×, 150 Hz) on the way to an acquisition computer running Plexon SortClient software. Here the signal was digitized at 40 kHz, filtered at 0.45–9 kHz and amplified 1–15X (to reach a total of 1,000–15,000X). Electrodes were moved ventrally (40 μm) between recordings to maximize the number of distinct units collected for each animal. Single-units were manually identified using Plexon OfflineSorter software. Primary waveform parameters utilized were peak height, peak-valley, energy, and principal components.
Animal position was tracked at 60 Hz using a camera set 305 cm above the recording room floor. Plexon’s CinePlex Studio software was utilized to separately detect blue and red LED tracking lights affixed to the recording implant. Lights sat approximately 4.5 cm apart and were positioned perpendicular to the length of the animal’s head. During the target chasing paradigm, the green visual stimulus was simultaneously tracked using the same software.
Histology
Animals were perfused with 4% paraformaldehyde under deep anesthesia. Brains were removed and sliced into 50 μm sections and Nissl-stained to identify the trajectory and depth of electrode wires in PPC and RSC. Boundaries of each region were defined in accordance with our previous work as well as the Paxinos and Watson and Zilles atlases (Paxinos and Watson, 2006; Zilles, 2012). All tetrodes were determined to be within the bounds of mPPC. Documented micro-drive depth across recordings and final electrode depth observed in histology were compared and found to be compatible in all cases.
Identification of pursuits and shortcuts
Pseudorandom (RTs), characteristic (CTs), and shortcut trials were identified using a custom graphical user interface (GUI) designed in MATLAB. The GUI enabled fine resolution scoring of starts and ends of runs. Starts of runs were identified as timepoints wherein the visual target and rat began moving coherently. Ends of runs were identified as timepoints wherein the rat intercepted the visual target and the visual target disappeared (i.e. tracking of the target was lost). CTs were easily identifiable relative to RTs because of their consistent shape and position in the environment. The total amount of CTs identified using tracking data were cross-referenced with recording logs from each session. Shortcuts were also readily identified, as they were similar to CTs but the animal intercepted the target at an earlier point and the target disappeared. Median egocentric bearing and distance (described below) across all position samples from all RTs, CTs, and shortcuts were compared and verified identification of the different trial types.
Latency between position of rat and visual target
To assess the temporal proximity of rat pursuit of the visual target between pseudorandom trajectories (RTs) and characteristic trajectories (CTs) the x- and y-position of the animal was concatenated and shifted in time relative to the position of the visual target in 50 ms increments and similarity was assessed via Spearman’s correlation (ρ) at each lag. Latency was defined as the shift in rat position that yielded maximal correlation. This often required shifting backwards in time to match the rat position to the prior position of the target (e.g. the animal is now at the same position that the visual target was 150 ms ago).
Autocorrelations of movement variables
To assess differences in movement statistics between free exploration (FE) and pursuit (P) we calculated autocorrelations (‘xcorr’ in MATLAB) of linear and angular speed (Figure S3C). To determine the temporal continuity of movement behavior we found the temporal lag wherein the autocorrelation dropped below 0.25 for each recording session. Rats exhibited more similar linear speed for extended temporal windows during P when compared to FE. Continuity of angular speed was more similar between FE and P, but FE had significantly greater temporal lags (Figure S3D).
Analysis of the egocentric position of the visual target position relative to the animal
For each position frame of each recording session, the instantaneous distance between the rat and the visual target was calculated as the Euclidean distance in centimeters (cm) between the average x- and y-positions of tracking lights on the animal and the tracked position of the target. The instantaneous egocentric bearing to the visual target was calculated as the difference between the rat’s heading direction and the inverse tangent of the difference between x- and y-positions of the visual target and the rat.
To examine the distribution of target occupancy relative to the animal, occupancy maps were generated by binning egocentric distance in 2.5 cm increments (up to 65 cm) and egocentric bearing in 5° angular bins. Differences in egocentric target occupancy between RTs and CTs were assessed by generating target occupancy maps separately for each trial type. We summated across distance and bearing bins to create marginalized occupancy vectors for egocentric bearing and distance separately, then fit these with Gaussian-modified linear models (GML) using the built-in ‘fit’ function in MATLAB. As the GML model is utilized in multiple analyses throughout the paper we define it now. GMLs took the form:
Where a and b are the intercept and slope of the linear fit and c, d, and e are the amplitude, center, and standard deviation of the additive Gaussian function. To quantify differences in target distance, bearing and bearing deviation, we compared the center and standard deviations of model fits between RTs and CTs.
Construction of self-motion tuning curves and normalization of behavior free foraging and pursuits
Behavior-matched angular and linear speed and acceleration tuning curves were constructed for all neurons. Within a recording session, we discretized linear speed into 29 bins spanning 0 to 45 cm/s (1.6 cm/s bins) for free exploration (FE) and target pursuit (P) separately. Angular speed (34 bins ranging from −180° to +180° in 10.6° increments) and linear acceleration (30 bins ranging from −75 cm/s2 to +75 cm/s2 in 5 cm/s2 increments) were similarly binned. For each self-motion variable, the minimum occupation across all speed bins across both FE and P epochs was identified. We next computed 1000 tuning curves for each individual neuron for P and FE(s), each time sub-sampling from all possible spike train indices (within P or FE) at a given speed bin to match this minimum occupation time minus an additional 1 s to allow for some variability in the speed bin with lowest sampling. All tuning curves depicted in the manuscript are the mean (±s.e.) of these 1000 sub-sampled tuning curves. Using this method all self-motion tuning curves were behaviorally matched between FE and P as well as across speed bins. We repeated this process for each neuron after randomly shifting the spike train relative to self-motion behavior (within FE and P blocks) 1000 times to generate random (null) self-motion tuning curves. Reliability of tuning curves was assessed within a behavioral epoch by repeating this process but for non-overlapping odd and even minutes within a session, then assessing their similarity using Spearman’s correlation (ρ).
Fitting self-motion tuning curves, model comparisons, and identification of significant tuning
Each tuning curve for each neuron was fit with a uniform function, linear fit, and the GML model described above. All randomized tuning curves for each neuron were also fit with these models. F-tests were run to compare the residuals of all combinations of model fits. Any neuron with a true p value for either uniform versus linear or uniform versus GML fits that was less than the 1st percentile of the same tests conducted on the neuron’s corresponding null self-motion tuning curves was considered to have significantly nonuniform tuning to self-motion. The final subset of neurons identified to have significant self-motion sensitivity passed this metric for at least one session (i.e. FE1, P, or FE2) and had a reliability score (Spearman’s ρ, as described above) that was greater than the 99th percentile of the distributions of reliability scores calculated from each neuron’s null self-motion tuning curves. Significant nonlinearity of tuning curves was attributed to neurons with p values from F-tests of linear versus GML fits that were less than the 1st percentile of the distributions of p values computed from similar tests conducted on model fits to null self-motion tuning curves. All percentile tests were done within neuron and behavioral task (i.e. from the distribution of p values on model fits to all 1000 of the null self-motion tuning curves calculated from randomly shifting that neuron’s spike train within pursuit or free exploration).
Assessment of gain modulation
Additive gain in self-motion tuned neurons for FE or P was determined by peak normalizing self-motion tuning curves for each epoch by the maximum firing rate value across tuning curves taken from all behavioral sessions, then taking the mean difference between these normalized tuning curves between P and FE. Neurons with mean differences less than zero prefer FE (P < FE) while neurons mean differences above zero prefer P (P > FE). To assess multiplicative gain, we examined differences in the amplitude parameter of GML model fits to tuning curves between P and FE. Systematic modulation of both additive and multiplicative gain was assessed by comparing differences in mean rate or peak amplitude between all combinations of P, FE1, and FE2 for the subset of self-motion tuned neurons recorded in two FE conditions.
Decoding of self-motion
Decoding of self-motion at the level of single neurons was conducted using a maximum correlation coefficient classifier taken from the Neural Decoding Toolbox (Meyers, 2013); http://www.readout.info/). Spike times for a given neuron were matched to behavioral position samples to generate a spike train with the same temporal resolution as the position tracking system (60 Hz). Spike trains were smoothed with a Gaussian filter with a 200 ms standard deviation and partitioned into 50% training and 50% test datasets. The classifier was trained on the instantaneous firing rate vector with self-motion (either linear or angular speed) as the response variable. Self-motion was binned in the same manner as for analysis of tuning curves described above. The training data was used to generate a template by learning the mean firing rate associated with each class (i.e. speed). Predictions on test data are chosen by finding the class with the smallest square difference between the template and a given test sample (i.e. a single firing rate bin in the spike train). Decoding was performed ten times using different 50/50 randomly selected splits of train and test data and accuracy was assessed via Spearman’s correlation between predicted and true self-motion. All correlations reported are the average across each decoding iteration.
Decoding of self-motion using simultaneously recorded PPC ensembles was conducted with a naïve Bayes classifier again using the Neural Decoding Toolbox. Ensembles ranged in size from 5 to 12 PPC neurons and the classifier was trained on the same spike trains generated for single neuron prediction and self-motion response variables. Training data was used to calculate the discretized mean firing rates for each neuron for each class (i.e. speed bin) and the log likelihood function is calculated using these rates as lambda parameters to define Poisson distributions for each neuron. For a single test point, the probability of observing the combination of mean firing rates across the ensemble is calculated for each class and multiplied across all neurons to give a likelihood of being at each speed. The speed with the highest likelihood is the predicted self-motion state. Data was partitioned in the same manner as outlined above and prediction accuracy was again assessed using Spearman’s correlations and averaged across decoding iterations.
Self-motion decoding latency analysis
To quantify the temporal relationship between neural activation and self-motion decoding, we additionally ran the maximum correlation coefficient classifier analysis for single neurons after shifting the spike train relative to behavior incrementally. Specifically, the spike train was shifted from −2 s to +2 s in 100 ms increments relative to a fixed behavioral response variable (e.g. linear or angular speed). The shifted variable is key to interpretation as the temporal relationships relative to the reference vector dictate whether lagged relationships are prospective (i.e. anticipatory) or retrospective (i.e. history-dependent). Because we shifted the spike train, backwards shifts relative to behavior mean spiking occurred after the response variable (i.e. speed), while forward shifts relative to behavior mean spiking occurred before the response variable. Increased decoding accuracy for the former indicates history-dependent relationships between neural activity and behavior while the latter evidences anticipatory relationships.
For each temporal lag iteration, the decoder was trained and tested as described above. Accuracy was again assessed by correlating the self-motion prediction associated with each spike train lag with the true self-motion. These values were stored in a 41-bin vector for each neuron which we refer to as the ‘Decoding accuracy latency curve.’ These curves were fit with the GML model and center and width parameters were extracted to assess the preferred latency and decoder width for each neuron, respectively. For all decoding analyses, including the instantaneous decoding described above, real decoding accuracy was compared to the 99th percentiles of decoding accuracy taken from a null distribution for each neuron following circular shifts of the spike train relative to self-motion for durations greater than 2 s for 41 iterations (the number of spike train shifts in the latency analysis).
Self-motion displacement analysis
Analyses were conducted according to prior work (Alexander et al., 2020; Whitlock et al., 2012). Briefly, angular heading displacement and distance travelled were calculated between all position samples using a sliding 100 ms temporal window. These values were transformed to the Cartesian coordinate system to generate x- and y-displacement values in centimeters, which were binned into a displacement occupancy map and convolved with a 2D Gaussian spanning 3 cm. The same process was repeated for displacement values that co-occurred with an individual neuron’s spike times to generate a ratemap reflecting the firing rate of a cell as a function of self-motion displacement. For each neuron, this process was repeated for multiple shifts of the spike train forwards and backwards in time from −2 s to 2 s in 50 ms increments.
Self-motion displacement maps were quantified in two ways. First, we repeated the above process for non-overlapping odd and even minute time bins and utilized a Spearman’s correlation to assess the reliability of self-motion related firing for each ratemap as a function of the spike train lag. Second, we calculated the coherence of each ratemap by correlating the firing rate in each displacement map bin with the mean firing rate of all adjacent bins.
Generalized linear models (GLMs)
To test the influence of multiple behavioral and spatial variables on the activity of PPC neurons simultaneously we utilized a GLM framework (https://github.com/hasselmonians/pippin). The probability of spiking in a given behavioral frame (60 Hz) is described by an inhomogeneous Poisson process, where the spiking probability in a given position sample is described by the continuous variable λ:
Where:
Where β0 defines the baseline firing rate of the neuron. All subscripted variables are fit coefficients weighting the other (time-varying) variables. S is the running speed of the animal and A is the angular displacement of the animal, as described above. φ is the head direction, and x and y are measurements of the animal’s position in the environment in centimeters. Finally, d is the animal’s distance from the center of the environment (EB) or the distance to the visual target (VT), and θ is the egocentric angle to the center of the environment (EB) or the egocentric angle to the visual target (VT). VT predictors are not included in GLMs for FE as no target was present.
Coefficients were determined by fitting to maximize log likelihood (MATLAB function ‘glmfit’) of the experimental spike train given the behavioral variables. Model selection was completed in a stepwise fashion in order to identify the simplest model. On each iteration, we added the predictor which increased model fit (on average of 5-folds) the most, and was statistically significant compared to a Chi-Square distribution (degrees of freedom equal to the number of coefficients set to zero, p ≤ 0.001). We then dropped any predictor which no longer had a significant contribution (p > 0.05). This process was repeated until the model converged. While theoretically the change in log likelihood should follow a Chi-Square distribution, this is only the case when the spike train has been fit well (e.g. including all neuron-neuron coupling terms). We therefore also compared the change in log likelihood to that from 1000 randomly shuffled spike trains, giving an empirical null-distribution and results were similar to the Chi-Square approach. Example spike trains for each model were generated by evaluating lambda for each behavioral time point (‘glmeval’ in MATLAB) and using this as the input to a random Poisson Generator (‘poissrnd’ in MATLAB).
Rat-to-target ratemaps and quantification
To visualize and characterize the receptive fields of neurons with significant tuning to the egocentric position of the target using the GLM we created rat-to-target ratemaps. Rat-to-target ratemaps were constructed by finding the egocentric distance and bearing to the target at the time of all spikes for a given neuron within the pursuit session (see section on egocentric target position above). These values were used to generate spike-target-occupancy maps which were normalized by the time the visual target spent in each egocentric distance by bearing bin to generate the rat-to-target ratemaps depicted in Figure 6. As target occupancy drastically dropped at 40 cm away from the animal, the radial axis on rat-to-target ratemaps was restricted to values below this distance. Rat-to-target ratemaps were smoothed with a Gaussian kernel with a 5 cm × 20 ° standard deviation.
Preferred bearing, tuning width, and preferred distance of individual neurons that were determined to have significant sensitivity to the egocentric position of the visual target using the generalized linear model were quantified in a similar fashion to the target occupancy maps, again using parameters of GML fits. We examined these characteristics for all neurons determined to possess sensitivity to the egocentric position of the target using the generalized linear model as well as the distributions for neurons that were significantly sensitive and possessed reliability in the strength (mean resultant length, MRL) and direction of their visual target related tuning across non-overlapping halves of the pursuit session (blue distributions in Figure 6E).
Egocentric boundary ratemaps and 2D spatial ratemaps
Egocentric boundary ratemaps (EBRs) were constructed as previously described using previously published code (https://github.com/hasselmonians/EgocentricBoundaryCells; Hinman et al., 2019; Alexander et al., 2020). In brief, the egocentric bearing and distance to all boundaries are calculated for all behavioral position samples and spike times for a given neuron. These values are utilized to create boundary and spike-boundary occupancy maps which reflect the position of the boundaries (<62.5 cm from the animal) relative to all animal position samples within a session and relative to all times in which a spike occurred for a given neuron. Egocentric bearing is anchored to the allocentric head direction of the animal at every behavioral sample such that the animal is facing upwards in the polar matrices containing this occupancy information. EBRs are constructed for each cell by normalizing the spike-boundary occupancy map by the amount of time each egocentric boundary distance by bearing bin was occupied as shown in Figure S7. Ratemaps were smoothed by convolving EBRs with a 2.5 cm × 3° Gaussian kernel.
2D spatial ratemaps were constructed in a similar manner as above but using the x- and y-position of the rat in centimeters relative to the external environment. Rat position was discretized into 3 × 3 cm bins. For a given neuron, the rat position at the time of all spikes was determined to generate a spike occupancy map which was normalized by the total time each spatial position was occupied to generate a 2D spatial ratemap. Raw ratemaps were smoothed by convolving with a Gaussian kernel with a 6 cm2 standard deviation.
QUANTIFICATION AND STATISTICAL ANALYSIS
Unless otherwise stated, nonparametric tests with a p value threshold at 0.05 were used for all statistical comparisons. Median and IQR are provided for all distributions in which comparisons were made.
Supplementary Material
KEY RESOURCES TABLE
| REAGENT or RESOURCE | SOURCE | IDENTIFIER |
|---|---|---|
| Chemicals, peptides, and recombinant proteins | ||
| Isoflurane | MWI | Cat #: NDC 13985-528-60 |
| Buprenorphine | MWI | Cat #: 29308 |
| Gold plating solution | Sifco | Cat #: 80535500 |
| Paraformaldehyde | Fisher | 30525-89-4 |
| Experimental models: Organisms/strains | ||
| Male Long Evans rats | Charles River Labs | |
| Software and algorithms | ||
| OfflineSorter | Plexon | |
| MATLAB v2016b | MathWorks | |
| Plexon SortClient | Plexon | |
| Other | ||
| Microdrives | Custom built | |
| 17 μm Platinum-Iridium tetrode wire | California fine wire co. | Cat #: CFW0011873 |
| 12 μm Tungsten wire | California fine wire co. | Cat #: 100211 |
Highlights.
Rats pursue moving visual targets and make predictions about their paths
Pursuit behavior enhances self-motion coding in parietal cortex via gain modulation
Pursuit increases timescale of instantaneous trajectory mappings in parietal cortex
Parietal cortex neurons conjunctively code self-motion and egocentric target position
ACKNOWLEDGMENTS
The authors thank C. Cummins and A. Birger for technical assistance and D. Tingley, H. Dannenberg, and N. Kinsky for providing comments on the manuscript. We thank Wenbo Tang and scidraw.io for illustrations used in the graphical abstract. A.S.A. was supported by National Science Foundation Graduate Research Fellowship DGE-1144086 and National Institutes of Health grants F32 NS101836 and K99 NS119665. A.S.A. and M.E.H. were supported by Office of Naval Research MURI N00014-19-1-2571. A.S.A. and D.A.N. were supported by Kavli Institute for Brain and Mind Innovative Research Grant 2014-004. D.A.N. was supported by Air Force Office of Scientific Research FA9550-19-9306 and National Institutes of Health BRAIN Initiative NS104897.
Footnotes
SUPPLEMENTAL INFORMATION
Supplemental information can be found online at https://doi.org/10.1016/j.celrep.2022.110504.
DECLARATION OF INTERESTS
The authors declare no competing interests.
REFERENCES
- Akrami A, Kopec CD, Diamond ME, and Brody CD (2018). Posterior parietal cortex represents sensory history and mediates its effects on behaviour. Nature 554, 368–372. 10.1038/nature25510. [DOI] [PubMed] [Google Scholar]
- Alexander AS, Carstensen LC, Hinman JR, Raudies F, Chapman GW, and Hasselmo ME (2020). Egocentric boundary vector tuning of the retrosplenial cortex. Sci. Adv 6, eaaz2322. 10.1126/sciadv.aaz2322. [DOI] [PMC free article] [PubMed] [Google Scholar]
- Andersen RA, and Cui H (2009). Intention, action planning, and decision making in parietal-frontal circuits. Neuron 63, 568–583. 10.1016/j.neuron.2009.08.028. [DOI] [PubMed] [Google Scholar]
- Andersen RA, and Mountcastle VB (1983). The influence of the angle of gaze upon the excitability of the light- sensitive neurons of the posterior parietal cortex. J. Neurosci 3, 532–548. [DOI] [PMC free article] [PubMed] [Google Scholar]
- Angelaki DE, and Cullen KE (2008). Vestibular system: the many facets of a multimodal sense. Annu. Rev. Neurosci 31, 125–150. 10.1146/annurev.neuro.31.060407.125555. [DOI] [PubMed] [Google Scholar]
- Barnes GR, Barnes DM, and Chakraborti SR (2000). Ocular pursuit responses to repeated, single-cycle sinusoids reveal behavior compatible with predictive pursuit. J. Neurophysiol 84, 2340–2355. 10.1152/jn.2000.84.5.2340. [DOI] [PubMed] [Google Scholar]
- Behrmann M, Watt S, Black SE, and Barton JJS (1997). Impaired visual search in patients with unilateral neglect: an oculographic analysis. Neuropsychologia 35, 1445–1458. 10.1016/S0028-3932(97)00058-4. [DOI] [PubMed] [Google Scholar]
- Bicanski A, and Burgess N (2018). A neural-level model of spatial memory and imagery. Elife 7. 10.7554/eLife.33752. [DOI] [PMC free article] [PubMed] [Google Scholar]
- Bisiach E, and Luzzatti C (1978). Unilateral neglect of representational space. Cortex 14, 129–133. 10.1016/S0010-9452(78)80016-1. [DOI] [PubMed] [Google Scholar]
- Bouvier G, Senzai Y, and Scanziani M (2020). Head movements control the activity of primary visual cortex in a luminance-dependent manner. Neuron 108, 500–511.e5. 10.1016/j.neuron.2020.07.004. [DOI] [PMC free article] [PubMed] [Google Scholar]
- Bucci DJ, Holland PC, and Gallagher M (1998). Removal of cholinergic input to rat posterior parietal cortex disrupts incremental processing of conditioned stimuli. J. Neurosci 18, 8038–8046. [DOI] [PMC free article] [PubMed] [Google Scholar]
- Calhoun JB (1963). The Ecology and Sociology of the Norway Rat (U.S. Department of Health, Education, and Welfare, Public Health Service; ). [Google Scholar]
- Chen LL, Lin LH, Barnes CA, and McNaughton BL (1994). Head-direction cells in the rat posterior cortex. II. Contributions of visual and ideothetic information to the directional firing. Exp. Brain Res 101, 24–34. [DOI] [PubMed] [Google Scholar]
- Cohen YE, and Andersen RA (2002). A common reference frame for movement plans in the posterior parietal cortex. Nat. Rev. Neurosci 3, 553–562. 10.1038/nrn873. [DOI] [PubMed] [Google Scholar]
- Colby CL, and Goldberg ME (1999). Space and attention in parietal cortex. Annu. Rev. Neurosci 22, 319–349. 10.1146/annurev.neuro.22.1.319. [DOI] [PubMed] [Google Scholar]
- Cooper BG, Miya DY, and Mizumori SJY (1998). Superior colliculus and active navigation: role of visual and non-visual cues in controlling cellular representations of space. Hippocampus 8, 340–372. . [DOI] [PubMed] [Google Scholar]
- Dannenberg H, Kelley C, Hoyland A, Monaghan CK, and Hasselmo ME (2019). The firing rate speed code of entorhinal speed cells differs across behaviorally relevant time scales and does not depend on medial septum inputs. J. Neurosci 39, 3434–3453. 10.1523/JNEUROSCI.1450-18.2019. [DOI] [PMC free article] [PubMed] [Google Scholar]
- Disney AA, Aoki C, and Hawken MJ (2007). Gain modulation by nicotine in macaque V1. Neuron 56, 701–713. 10.1016/j.neuron.2007.09.034. [DOI] [PMC free article] [PubMed] [Google Scholar]
- Eisenberg JF, and Leyhausen P (1972). The phylogenesis of predatory behavior in mammals. Z. Tierpsychol 30, 59–93. 10.1111/j.1439-0310.1972.tb00844.x. [DOI] [PubMed] [Google Scholar]
- Ferguson KA, and Cardin JA (2020). Mechanisms underlying gain modulation in the cortex. Nat. Rev. Neurosci 21, 80–92. 10.1038/s41583-019-0253-y. [DOI] [PMC free article] [PubMed] [Google Scholar]
- Fischer LF, Mojica Soto-Albors R, Buck F, and Harnett MT (2020). Representation of visual landmarks in retrosplenial cortex. Elife 9, e51458. 10.7554/eLife.51458. [DOI] [PMC free article] [PubMed] [Google Scholar]
- Fu Y, Tucciarone JM, Espinosa JS, Sheng N, Darcy DP, Nicoll RA, Huang ZJ, and Stryker MP (2014).A cortical circuit for gain control by behavioral state. Cell 156, 1139–1152. 10.1016/j.cell.2014.01.050. [DOI] [PMC free article] [PubMed] [Google Scholar]
- Gilissen SRJ, Farrow K, Bonin V, and Arckens L (2021). Reconsidering the border between the visual and posterior parietal cortex of mice. Cereb. Cortex 10.1093/cercor/bhaa318. [DOI] [PubMed] [Google Scholar]
- Glickfeld LL, and Olsen SR (2017). Higher-order areas of the mouse visual cortex. Annu. Rev. Vis. Sci 3, 251–273. 10.1146/annurev-vision-102016-061331. [DOI] [PubMed] [Google Scholar]
- Goard M, and Dan Y (2009). Basal forebrain activation enhances cortical coding of natural scenes. Nat. Neurosci 12, 1444–1449. 10.1038/nn.2402. [DOI] [PMC free article] [PubMed] [Google Scholar]
- Goard MJ, Pho GN, Woodson J, and Sur M (2016). Distinct roles of visual, parietal, and frontal motor cortices in memory-guided sensorimotor decisions. Elife 5, e13764. 10.7554/eLife.13764. [DOI] [PMC free article] [PubMed] [Google Scholar]
- Gofman X, Tocker G, Weiss S, Boccara CN, Lu L, Moser M-B, Moser EI, Morris G, and Derdikman D (2019). Dissociation between postrhinal cortex and downstream parahippocampal regions in the representation of egocentric boundaries. Curr. Biol 29, 2751–2757.e4. 10.1016/j.cub.2019.07.007. [DOI] [PubMed] [Google Scholar]
- Guitchounts G, Masís J, Wolff SBE, and Cox D (2020). Encoding of 3D head orienting movements in the primary visual cortex. Neuron 108, 512–525.e4. 10.1016/j.neuron.2020.07.014. [DOI] [PubMed] [Google Scholar]
- Harvey CD, Coen P, and Tank DW (2012). Choice-specific sequences in parietal cortex during a virtual-navigation decision task. Nature 484, 62–68. 10.1038/nature10918. [DOI] [PMC free article] [PubMed] [Google Scholar]
- Hinman JR, Brandon MP, Climer JR, Chapman GW, and Hasselmo ME (2016). Multiple running speed signals in medial entorhinal cortex. Neuron 91, 666–679. 10.1016/j.neuron.2016.06.027. [DOI] [PMC free article] [PubMed] [Google Scholar]
- Hinman JR, Chapman GW, and Hasselmo ME (2019). Neuronal representation of environmental boundaries in egocentric coordinates. Nat. Commun 10, 2772. 10.1038/s41467-019-10722-y. [DOI] [PMC free article] [PubMed] [Google Scholar]
- Hovde K, Gianatti M, Witter MP, and Whitlock JR (2019). Architecture and organization of mouse posterior parietal cortex relative to extrastriate areas. Eur. J. Neurosci 49, 1313–1329. 10.1111/ejn.14280. [DOI] [PubMed] [Google Scholar]
- Hoy JL, Bishop HI, and Niell CM (2019). Defined cell types in superior colliculus make distinct contributions to prey capture behavior in the mouse. Curr. Biol 29, 4130–138.e5. 10.1016/j.cub.2019.10.017. [DOI] [PMC free article] [PubMed] [Google Scholar]
- Hoy JL, Yavorska I, Wehr M, and Niell CM (2016). Vision drives accurate approach behavior during prey capture in laboratory mice. Curr. Biol 26, 3046–3052. 10.1016/j.cub.2016.09.009. [DOI] [PMC free article] [PubMed] [Google Scholar]
- Hwang EJ, Dahlen JE, Mukundan M, and Komiyama T (2017). History-based action selection bias in posterior parietal cortex. Nat. Commun 8, 1242. 10.1038/s41467-017-01356-z. [DOI] [PMC free article] [PubMed] [Google Scholar]
- Kawano K, Sasaki M, and Yamashita M (1980). Vestibular input to visual tracking neurons in the posterior parietal association cortex of the monkey. Neurosci. Lett 17, 55–60. 10.1016/0304-3940(80)90061-0. [DOI] [PubMed] [Google Scholar]
- Keshavarzi S, Bracey EF, Faville RA, Campagner D, Tyson AL, Lenzi SC, Branco T, and Margrie TW (2022). Multisensory coding of angular head velocity in the retrosplenial cortex. Neuron 110, 532–543.e9. 10.1016/j.neuron.2021.10.031. [DOI] [PMC free article] [PubMed] [Google Scholar]
- Kim N, Li HE, Hughes RN, Watson GDR, Gallegos D, West AE, Kim IH, and Yin HH (2019).A striatal interneuron circuit for continuous target pursuit. Nat. Commun 10, 2715. 10.1038/s41467-019-10716-w. [DOI] [PMC free article] [PubMed] [Google Scholar]
- Krumin M, Lee JJ, Harris KD, and Carandini M (2018). Decision and navigation in mouse parietal cortex. Elife 7, e42583. 10.7554/eLife.42583. [DOI] [PMC free article] [PubMed] [Google Scholar]
- Kurtz RG, and Adler NT (1973). Electrophysiological correlates of copulatory behavior in the male rat: evidence for a sexual inhibitory process. J. Comp. Physiol. Psychol 84, 225–239. 10.1037/h0035265. [DOI] [PubMed] [Google Scholar]
- Mao D, Molina LA, Bonin V, and McNaughton BL (2020). Vision and locomotion combine to drive path integration sequences in mouse retrosplenial cortex. Curr. Biol 30, 1680–1688.e4. 10.1016/j.cub.2020.02.070. [DOI] [PubMed] [Google Scholar]
- Meyers E (2013). The neural decoding toolbox. Front. Neuroinform 7. 10.3389/fninf.2013.00008. [DOI] [PMC free article] [PubMed] [Google Scholar]
- Mimica B, Dunn BA, Tombaz T, Bojja VPT, and Whitlock JR (2018). Efficient cortical coding of 3D posture in freely behaving rats. Science 362, 584–589. 10.1126/science.aau2013. [DOI] [PubMed] [Google Scholar]
- Minces V, Pinto L, Dan Y, and Chiba AA (2017). Cholinergic shaping of neural correlations. Proc. Natl. Acad. Sci. U S A 114, 5725–5730. 10.1073/pnas.1621493114. [DOI] [PMC free article] [PubMed] [Google Scholar]
- Minderer M, Brown KD, and Harvey CD (2019). The spatial structure of neural encoding in mouse posterior cortex during navigation. Neuron 102, 232–248.e11. 10.1016/j.neuron.2019.01.029. [DOI] [PMC free article] [PubMed] [Google Scholar]
- Moore JJ, Ravassard PM, Ho D, Acharya L, Kees AL, Vuong C, and Mehta MR (2017). Dynamics of cortical dendritic membrane potential and spikes in freely behaving rats. Science 355. 10.1126/science.aaj1497. [DOI] [PubMed] [Google Scholar]
- Morcos AS, and Harvey CD (2016). History-dependent variability in population dynamics during evidence accumulation in cortex. Nat. Neurosci 19, 1672–1681. 10.1038/nn.4403. [DOI] [PMC free article] [PubMed] [Google Scholar]
- Niell CM, and Stryker MP (2010). Modulation of visual responses by behavioral state in mouse visual cortex. Neuron 65, 472–479. 10.1016/j.neuron.2010.01.033. [DOI] [PMC free article] [PubMed] [Google Scholar]
- Nitz D (2009). Parietal cortex, navigation, and the construction of arbitrary reference frames for spatial information. Neurobiol. Learn Mem 91, 179–185. 10.1016/j.nlm.2008.08.007. [DOI] [PubMed] [Google Scholar]
- Nitz DA (2012). Spaces within spaces: rat parietal cortex neurons register position across three reference frames. Nat. Neurosci 15, 1365–1367. 10.1038/nn.3213. [DOI] [PubMed] [Google Scholar]
- Nitz DA (2006). Tracking route progression in the posterior parietal cortex. Neuron 49, 747–756. 10.1016/j.neuron.2006.01.037. [DOI] [PubMed] [Google Scholar]
- Olsen GM, Ohara S, Iijima T, and Witter MP (2017). Parahippocampal and retrosplenial connections of rat posterior parietal cortex. Hippocampus 27, 335–358. 10.1002/hipo.22701. [DOI] [PubMed] [Google Scholar]
- Olsen GM, and Witter MP (2016). Posterior parietal cortex of the rat: architectural delineation and thalamic differentiation. J. Comp. Neurol 524, 3774–3809. 10.1002/cne.24032. [DOI] [PubMed] [Google Scholar]
- Paxinos G, and Watson C (2006). The Rat Brain in Stereotaxic Coordinates: Hard Cover Edition (Elsevier; ). [Google Scholar]
- Pho GN, Goard MJ, Woodson J, Crawford B, and Sur M (2018). Task-dependent representations of stimulus and choice in mouse parietal cortex. Nat. Commun 9, 2596. 10.1038/s41467-018-05012-y. [DOI] [PMC free article] [PubMed] [Google Scholar]
- Powell A, Connelly WM, Vasalauskaite A, Nelson AJD, Vann SD, Aggleton JP, Sengpiel F, and Ranson A (2020). Stable encoding of visual cues in the mouse retrosplenial cortex. Cereb. Cortex 30, 4424–4437. 10.1093/cercor/bhaa030. [DOI] [PMC free article] [PubMed] [Google Scholar]
- Rancz EA, Moya J, Drawitsch F, Brichta AM, Canals S, and Margrie TW (2015). Widespread vestibular activation of the rodent cortex. J. Neurosci 35, 5926–5934. 10.1523/JNEUROSCI.1869-14.2015. [DOI] [PMC free article] [PubMed] [Google Scholar]
- Reep RL, Chandler HC, King V, and Corwin JV (1994). Rat posterior parietal cortex: topography of corticocortical and thalamic connections. Exp. Brain Res 100, 67–84. [DOI] [PubMed] [Google Scholar]
- Reynolds JH, Pasternak T, and Desimone R (2000). Attention increases sensitivity of V4 neurons. Neuron 26, 703–714. 10.1016/S0896-6273(00)81206-4. [DOI] [PubMed] [Google Scholar]
- Runyan CA, Piasini E, Panzeri S, and Harvey CD (2017). Distinct timescales of population coding across cortex. Nature 548, 92–96. 10.1038/nature23020. [DOI] [PMC free article] [PubMed] [Google Scholar]
- Salinas E, and Thier P (2000). Gain modulation: a major computational principle of the central nervous system. Neuron 27, 15–21. 10.1016/S0896-6273(00)00004-0. [DOI] [PubMed] [Google Scholar]
- Sasaki R, Anzai A, Angelaki DE, and DeAngelis GC (2020). Flexible coding of object motion in multiple reference frames by parietal cortex neurons. Nat. Neurosci 23, 1004–1015. 10.1038/s41593-020-0656-0. [DOI] [PMC free article] [PubMed] [Google Scholar]
- Save E, and Poucet B (2000). Involvement of the hippocampus and associative parietal cortex in the use of proximal and distal landmarks for navigation. Behav. Brain Res 109, 195–206. [DOI] [PubMed] [Google Scholar]
- Schiller PH, and Stryker M (1972). Single-unit recording and stimulation in superior colliculus of the alert rhesus monkey. J. Neurophysiol 35, 915–924. 10.1152/jn.1972.35.6.915. [DOI] [PubMed] [Google Scholar]
- Scott BB, Constantinople CM, Akrami A, Hanks TD, Brody CD, and Tank DW (2017). Fronto-parietal cortical circuits encode accumulated evidence with a diversity of timescales. Neuron 95, 385–398.e5. 10.1016/j.neuron.2017.06.013. [DOI] [PMC free article] [PubMed] [Google Scholar]
- Shang C, Liu A, Li D, Xie Z, Chen Z, Huang M, Li Y, Wang Y, Shen WL, and Cao P (2019). A subcortical excitatory circuit for sensory-triggered predatory hunting in mice. Nat. Neurosci 22, 909–920. 10.1038/s41593-019-0405-4. [DOI] [PubMed] [Google Scholar]
- Stitt I, Zhou ZC, Radtke-Schuller S, and Fröhlich F (2018). Arousal dependent modulation of thalamo-cortical functional interaction. Nat. Commun 9, 2455. 10.1038/s41467-018-04785-6. [DOI] [PMC free article] [PubMed] [Google Scholar]
- Tingley D, Alexander AS, Kolbu S, de Sa VR, Chiba AA, and Nitz DA (2014). Task-phase-specific dynamics of basal forebrain neuronal ensembles. Front. Syst. Neurosci 8. 10.3389/fnsys.2014.00174. [DOI] [PMC free article] [PubMed] [Google Scholar]
- Vinck M, Batista-Brito R, Knoblich U, and Cardin JA (2015). Arousal and locomotion make distinct contributions to cortical activity patterns and visual encoding. Neuron 86, 740–754. 10.1016/j.neuron.2015.03.028. [DOI] [PMC free article] [PubMed] [Google Scholar]
- Whitlock JR, Pfuhl G, Dagslott N, Moser M-B, and Moser EI (2012). Functional split between parietal and entorhinal cortices in the rat. Neuron 73, 789–802. 10.1016/j.neuron.2011.12.028. [DOI] [PubMed] [Google Scholar]
- Wilber AA, Clark BJ, Demecha AJ, Mesina L, Vos JM, and McNaughton BL (2015). Cortical connectivity maps reveal anatomically distinct areas in the parietal cortex of the rat. Front. Neural Circuits 8. 10.3389/fncir.2014.00146. [DOI] [PMC free article] [PubMed] [Google Scholar]
- Wilber AA, Clark BJ, Forster TC, Tatsuno M, and McNaughton BL (2014). Interaction of egocentric and world-centered reference frames in the rat posterior parietal cortex. J. Neurosci 34, 5431–5446. 10.1523/JNEUROSCI.0511-14.2014. [DOI] [PMC free article] [PubMed] [Google Scholar]
- Wilber AA, Skelin I, Wu W, and McNaughton BL (2017). Laminar organization of encoding and memory reactivation in the parietal cortex. Neuron 95, 1406–1419.e5. 10.1016/j.neuron.2017.08.033. [DOI] [PMC free article] [PubMed] [Google Scholar]
- Yoo SBM, Tu JC, Piantadosi ST, and Hayden BY (2020). The neural basis of predictive pursuit. Nat. Neurosci 23, 252–259. 10.1038/s41593-019-0561-6. [DOI] [PMC free article] [PubMed] [Google Scholar]
- Záborszky L, Gombkoto P, Varsanyi P, Gielow MR, Poe G, Role LW, Ananth M, Rajebhosale P, Talmage DA, Hasselmo ME, et al. (2018). Specific basal forebrain–cortical cholinergic circuits coordinate cognitive operations. J. Neurosci 38, 9446–9458. 10.1523/JNEUROSCI.1676-18.2018. [DOI] [PMC free article] [PubMed] [Google Scholar]
- Zhao Z, Chen Z, Xiang X, Hu M, Xie H, Jia X, Cai F, Cui Y, Chen Z, Qian L, et al. (2019). Zona incerta GABAergic neurons integrate prey-related sensory signals and induce an appetitive drive to promote hunting. Nat. Neurosci 22, 921–932. 10.1038/s41593-019-0404-5. [DOI] [PubMed] [Google Scholar]
- Zhuang J, Ng L, Williams D, Valley M, Li Y, Garrett M, and Waters J (2017). An extended retinotopic map of mouse cortex. Elife 6. 10.7554/eLife.18372. [DOI] [PMC free article] [PubMed] [Google Scholar]
- Zilles K (2012). The Cortex of the Rat: A Stereotaxic Atlas (Springer Science & Business Media; ). [Google Scholar]
Associated Data
This section collects any data citations, data availability statements, or supplementary materials included in this article.
Supplementary Materials
Data Availability Statement
Datasets supporting the current study will be shared by the lead contact upon request.
Original code has been deposited at Zenodo (https://doi.org/10.5281/zenodo.6081293).
Any additional information required to reanalyze the data reported in this paper is available from the lead contact upon request.