

Abstract
Background
Respiratory syncytial virus (RSV) is the predominant cause of clinical pneumonia among infants and young children, often peaking during the winter months in temperate regions.
Aim
To describe RSV seasonality in 13 European countries and examine its association with meteorological factors.
Methods
We included weekly RSV seasonality data from 13 European countries between week 40 2010 and week 39 2019. Using local weighted regression method, we modelled weekly RSV activity with meteorological factors using data from the 2010/11 to the 2017/18 season. We predicted the weekly RSV activity of the 2018/19 season across 41 European countries and validated our prediction using empirical data.
Results
All countries had annual wintertime RSV seasons with a longitudinal gradient in RSV onset (Pearson’s correlation coefficient, r = 0.71, 95% CI: 0.60 to 0.80). The RSV season started 3.8 weeks later (95% CI: −0.5 to 8.0) in countries in the eastern vs western parts of Europe, and the duration ranged from 8–18 weeks across seasons and countries. Lower temperature and higher relative humidity were associated with higher RSV activity, with a 14-day lag time. Through external validation, the prediction error in RSV season onset was −2.4 ± 3.2 weeks. Similar longitudinal gradients in RSV onset were predicted by our model for the 2018/19 season (r = 0.45, 95% CI: 0.16 to 0.66).
Conclusion
Meteorological factors, such as temperature and relative humidity, could be used for early warning of RSV season onset. Our findings may inform healthcare services planning and optimisation of RSV immunisation strategies in Europe.
Keywords: Respiratory syncytial virus, Europe, seasonality, temperature, humidity
Introduction
Respiratory syncytial virus (RSV) represents a substantial burden of disease globally among young children [1] and older adults [2]. A recent study among seven European countries suggests that 57–72% of respiratory tract infection-associated hospitalisations in children under 5 years of age were due to RSV and the proportion was even higher (62–87%) in children under 1 year [3]. Despite the substantial burden of RSV in children, there is no licensed vaccine for RSV. Currently, the only licensed RSV prevention product is palivizumab, a short-acting monoclonal antibody (mAb), which needs to be administered to infants every month for a total of 5 months from the onset of the RSV season. Palivizumab is very expensive (EUR 3,400–5,600 per child [4]) and hence is administered mainly to high-risk infants and mostly in high-income countries. Nonetheless, there are over 40 candidate RSV prophylactic products at different phases of clinical trials up to March 2020 [5]. Recent results from clinical trials of a long-acting mAb, nirsevimab [6], and a maternal vaccine, ResVax (Novavax) [7], supported these passive immunisation strategies for preventing RSV disease in young infants. However, the duration of protection conferred by these prophylactics is limited (up to 5 months) and thus the seasonality of RSV needs to be accounted for when planning RSV immunisation strategies.
Globally, RSV causes annual seasonal epidemics in most areas, including both temperate and tropical regions [8,9] and meteorological factors including temperature and humidity have been reported to be associated with RSV activity [8]. A study of 15 European countries showed that RSV season started at around week 49 (early December) and lasted 8 to 24 weeks; RSV detections peaked later (r = 0.56; p = 0.04) and seasons lasted longer with increasing latitude (r = 0.57; p = 0.03) [10]. However, there is a lack of studies that report on the association between RSV seasonality and meteorological factors in Europe. In the present study, we aimed to model the RSV seasonality in 13 European countries with various meteorological factors using multi-season surveillance data.
Methods
Data sources
We defined the start of a season as the week 40 of a given year and the end of that season as the week 39 of the next year. We included country-specific data on laboratory-confirmed RSV cases between the 2010/11 season and the 2018/19 season from the RSV surveillance dataset by the European Centre for Disease Prevention and Control (ECDC). These data were reported weekly to ECDC through the European Influenza Surveillance Network (EISN), as detailed elsewhere [10,11]. There was no specific testing eligibility for RSV and the criteria for RSV testing could vary substantially by country and by type of RSV surveillance [10,11]. Clinicians either tested patients with influenza-like illness or acute respiratory infection, or ordered testing based on their own clinical judgement.
Sentinel surveillance used random or systematic sampling approaches whereas non-sentinel surveillance was mostly based on clinician’s judgement. Data from different surveillance systems, i.e. sentinel surveillance and non-sentinel surveillance, of the same country were regarded as separate data sources because of the heterogeneity in the population and testing criteria. For the present study, we considered eligibility for inclusion of RSV data on a surveillance season basis. For each season per surveillance system data source, we included RSV data if more than 25 RSV-positive samples were reported and the number of weeks with missing data was no more than five, i.e. ≤ 10% of the season.
Country-specific meteorological data from the same study period were extracted from the Global Surface Summary of the Day dataset provided by the US National Centers for Environmental Information (NCEI), via the R package ‘GSODR: Global Surface Summary of the Day Weather Data Client’ [12]. For each country, all weather stations available nationwide from the study period were included. The variables extracted included temperature, relative humidity, wind speed, precipitation and dew point, available as daily average values.
Description of respiratory syncytial virus seasonality
In order to account for delay in reporting, e.g. during national holidays, we calculated 3-week moving average of RSV-positive samples per week. Spline interpolation was used to impute missing numbers of RSV cases, where applicable, before applying the 3-week moving average. We then calculated annual percentages per week for each season and surveillance system data source, separately. The reported annual percentage represents the strength of RSV activity and annual percentages together added up to 100% per season and surveillance system data source.
We used the same approach as previously reported to define RSV ‘epidemic weeks’ [8]. This was done by identifying the minimum number of weeks with highest RSV activity required to jointly account for at least 75% of the annual RSV cases, with each of these weeks defined as an epidemic week; the epidemic weeks might be non-consecutive to allow for the occasional off-season small uptick in the RSV activity. The onset of an RSV season was defined as the first of the two consecutive epidemic weeks in each season. The offset of an RSV season was defined as the first epidemic week that was followed by three consecutive non-epidemic weeks in each season. The duration of an RSV season was defined as the interval between the onset and the offset of that RSV season. The coordinates, i.e. longitude and latitude, of country’s centroid were used for assessing the correlation between longitude/latitude and RSV seasonality. A country is defined as being in the eastern part of Europe if the longitude of the country’s centroid is > 20° and in the western part if the centroid longitude is ≤ 20°.
Seasonality model
We developed a local weighted regression model with data-driven selection of model predictors, i.e. meteorological factors, and model parameters (for degree of smoothness). Details of the seasonality model are in Supplement S1. Briefly, we considered different combinations of meteorological parameters and different time lags (0, 7, 14, 21, 35 and 42 days). Through a modelling selection process, we selected the model of mean-centred temperature and relative humidity with a time lag of 14 days as the main model (detailed model selection results are in Supplementary Tables S1–S3). The RSV seasonality data from the season 2010/11 to the season 2017/18 were used as the training and internal validation dataset for building the model. Considering the heterogeneity of criteria of RSV testing in different surveillance systems, we repeated the same modelling exercise excluding those surveillances that relied on clinicians’ judgement for RSV testing as sensitivity analysis.
Using our main model, we predicted the weekly activity of RSV in 41 European countries for the season 2018/19 with country-specific meteorological data as the input and we determined the critical values of temperature and relative humidity that indicated RSV onset for each country. We further validated our prediction using the observed data from the 2018/19 season (which were not used for modelling) by comparing the predicted RSV onset season with the observed RSV onset season.
All data analyses and visualisation were conducted using the R software (version 3.6.1) [13].
Results
Respiratory syncytial virus seasonality
We included 100 seasons from 21 surveillance systems of 13 countries. The number of RSV-positive samples per season and surveillance system ranged between 27 and 15,315 (Table). All the countries included had annual RSV seasons with a longitudinal gradient observed in RSV onset (Pearson’s correlation coefficient, r = 0.71, 95% confidence interval (CI): 0.60 to 0.80; Figure 1); the average RSV onset of countries in the east of Europe (defined by longitude > 20° of country’s centroid) was 3.8 weeks later (95% CI: −0.5 to 8.0) than those in the western part of Europe. No correlation was observed between RSV onset and latitude (r = −0.06, 95% CI: –0.25 to 0.14; Supplementary Figure S1). A year-on-year variation of ± 4 weeks in the RSV onset was observed in most countries, with the exception of Slovenia, Estonia and Denmark that showed higher variations; similar variation (± 4 weeks) was observed in the RSV offset (Figure 1). Duration of RSV season ranged between 8 and 18 weeks across seasons and countries.
Table. Case definitions, number of RSV seasons and RSV-positive samples by country and surveillance system in 13 European countries, week 40 2010–week 39 2019.
| Country | Surveillance systema | Case definition for sampling | Number of seasons | RSV-positive samples per season | |
|---|---|---|---|---|---|
| Median | Range | ||||
| Austria | Non-sentinel | ILI | 1 | 861 | NA |
| Denmark | Non-sentinel | 2012–15: ARI/ILIb
2015–19: clinical judgementc |
7 | 2,619 | 45–4,507 |
| Estonia | Non-sentinel | ARI/ILI | 4 | 484 | 177–644 |
| Estonia | Sentinel | ILI | 1 | 52 | NA |
| France | Non-sentinel | Clinical judgement | 1 | 9,074 | NA |
| France | Sentinel | ILI | 1 | 382 | NA |
| Germany | Non-sentinel | ARI | 6 | 132 | 56–285 |
| Germany | Sentinel | ARI | 6 | 295 | 220–430 |
| Greece | Non-sentinel | ILI | 1 | 36 | NA |
| Ireland | Non-sentinel | Clinical judgement | 6 | 965 | 684–1,572 |
| Ireland | Sentinel | ILI | 4 | 30 | 27–32 |
| Netherlands | Non-sentinel | Clinical judgement | 9 | 1,889 | 1,390–2,729 |
| Netherlands | Sentinel | ARI/ILI | 6 | 47 | 32–104 |
| Poland | Non-sentinel | ILI | 7 | 135 | 35–464 |
| Portugal | Non-sentinel | ARI/ILI/clinical judgement | 3 | 630 | 79–665 |
| Portugal | Sentinel | Influenza-negative cases | 1 | 38 | NA |
| Slovenia | Non-sentinel | Clinical judgement | 9 | 1,379 | 666–1,538 |
| Slovenia | Sentinel | ILI | 7 | 49 | 31–60 |
| Spain | Non-sentinel | Clinical judgement | 6 | 3,262 | 1,747–4,350 |
| United Kingdom | Non-sentinel | ARI/ILI | 7 | 11,014 | 4,744–15,315 |
| United Kingdom | Sentinel | ILI | 7 | 211 | 162–327 |
ARI: acute respiratory infection; ILI: influenza-like illness; NA: not applicable; RSV: respiratory syncytial virus.
a Sentinel surveillance is defined by a system that is set up for surveillance as a primary goal; non-sentinel surveillance is defined by a system that is not set up for surveillance.
b Data from the national laboratory at Statens Serum Institut, Denmark.
c Data from all clinical microbiological laboratories in Denmark.
Figure 1.
Respiratory syncytial virus seasonality in 13 European countries, week 40 2010–week 39 2019
AP: annual percentage; RSV: respiratory syncytial virus; UK: United Kingdom.
Sentinel surveillance is defined by a system that is set up for surveillance as a primary goal; non-sentinel surveillance is defined by a system that is not set up for surveillance. Annual percentage was calculated to represent strength of RSV activity; annual percentages together added up to 100% for each season. The value next to each country denotes the longitude of each country’s centroid.

Association between respiratory syncytial virus activity and meteorological factors
In the main model with a 14-day lag time, we found that lower temperature and higher relative humidity (vs the corresponding annual average value) were associated with higher RSV activity (Figure 2). A sensitivity analysis that excluded those surveillance systems that relied on clinicians’ judgement for RSV testing had consistent findings (Supplementary Figure S2: Association between meteorological factors and respiratory syncytial virus activity from sensitivity analysis). The Pearson’s correlation coefficient was –0.61 (95% CI: –0.63 to –0.59) between temperature and RSV activity, and was 0.40 (95% CI: 0.37 to 0.42) between relative humidity and RSV activity. The critical values of temperature and relative humidity that indicated RSV onset differed by country, ranging from –19°C to 14°C and from 67% to 96%, respectively. Supplementary Table S4 shows the critical values of temperature and relative humidity. When comparing the externally predicted activity of RSV with the observed activity across eight countries that had available data in the 2018/19 season, we found that the prediction error in the RSV season onset was –2.4 ± 3.2 weeks and that the model prediction was more conservative than the observed data regarding the amplitude of peak RSV activity (Figure 3).
Figure 2.
Association between meteorological factors and respiratory syncytial virus activity from 13 European countries, week 40 2010–week 39 2019
AP: annual percentage.
The colour scale refers to the predicted weekly percentage of respiratory syncytial virus cases in annual cases.
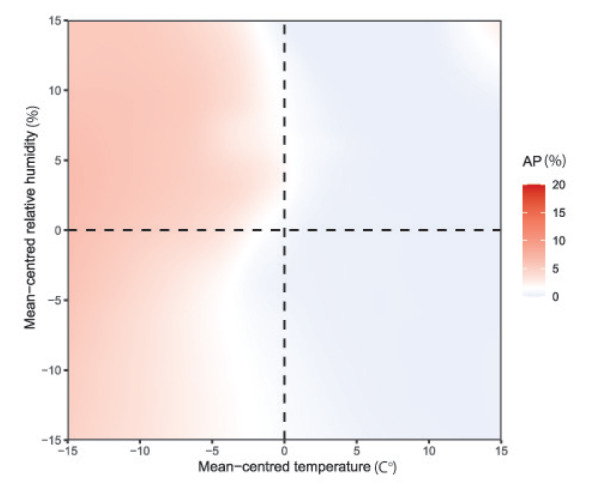
Figure 3.
Comparison of respiratory syncytial virus activity between model prediction and observation in 8 European countries, 2018/19 season
AP: annual percentage; UK: United Kingdom.
Sentinel surveillance is defined by a system that is set up for surveillance as a primary goal; non-sentinel surveillance is defined by system that is not set up for surveillance. The observed respiratory syncytial virus activity is presented in blue and the predicted respiratory syncytial virus activity is presented in red. Arrows denote the respiratory syncytial virus season onset.

In the model-predicted weekly RSV activity for the 2018/19 season across 41 European countries, available in Figure 4, a similar longitudinal gradient was observed in the RSV onset (r = 0.45, 95% CI: 0.16 to 0.66).
Figure 4.
Model-predicted weekly percentage of respiratory syncytial virus cases of all annual cases in 41 European countries, 2018/19 season
AP: annual percentage.
The colour scale refers to the predicted weekly percentage of respiratory syncytial virus cases of all annual cases. The number in each map panel denotes the year and week number.

Discussion
To the best of our knowledge, this is the first study that has modelled RSV seasonality with meteorological factors using multi-season data across Europe. All 13 European countries in our study showed clear annual wintertime RSV seasons with a west-to-east gradient observed in the RSV onset; countries in the eastern part of Europe had a later RSV season (ca 4 weeks) than those in the western part of Europe. We found that lower temperature and higher relative humidity were associated with higher RSV activity, with a time lag of 14 days. Through external validation, the prediction error in the RSV season onset of our model was –2.4 ± 3.2 weeks. A delayed RSV onset in the east of Europe was also seen in our model predictions for RSV seasonality in 41 European countries for the 2018/19 season.
Our findings on the RSV seasonality in European countries were broadly similar to those reported earlier by Broberg et al. [10] that included RSV data from 2010–16 with less strict criteria and different definitions for RSV season, although they report different findings in the latitudinal/longitudinal patterns of the RSV onset. In their study [10], both latitudinal and longitudinal gradients in the RSV onset were identified; in contrast, our study identified a longitudinal but not a latitudinal gradient in the RSV onset. The absence of a latitudinal gradient in Europe observed in our study was different to our previous findings from a global perspective; a consistently clear latitudinal gradient in the global RSV onset was reported in studies using different data sources [8,14,15]. Nonetheless, one of these global studies [8] found that within Europe, only a longitudinal gradient was observed in the RSV onset (r = 0.46) and the average difference in the onset between the western and eastern parts of Europe was 0.8 months, which was very similar to our findings (r = 0.71 and the difference in the onset = 3.8 weeks). The longitudinal and non-latitudinal gradient in the RSV onset observed in our study highlights the unique pattern of RSV timing in Europe (vs globally). Similarly, only a significant longitudinal gradient was observed for influenza [16]. One possible explanation for the different longitudinal/latitudinal gradients observed in Europe from that observed globally is that, within Europe, the climate – as measured by meteorological metrics, e.g. temperature and humidity – varied more by longitude than latitude. This explanation was supported by our model predictions among 41 European countries, which replicated the longitudinal gradients using temperature and humidity information. The observed longitudinal gradient in RSV onset could be relevant to countries with a large longitudinal span such as Russia, since a single immunisation programme for the whole country might not be optimal.
Based on the data-driven model selection process, we found that the model of temperature and relative humidity with a lag of 14 days (approximately two times the serial interval of RSV [17]) had the best external predictability. This potentially has important implications for early warning of RSV seasons for countries in Europe. For example, upon observations that temperature and/or relative humidity are reaching the critical values (in Supplementary Table S4: Critical values of temperature and relative humidity), countries could prepare for a possible surge in the hospital beds needs – especially for paediatric wards – in the coming 2 weeks. RSV transmission in the community is likely to happen earlier than that after accounting for the lags in attainment of healthcare and subsequent confirmation of infection. Our model results are also relevant to the RSV immunisation strategies, including both maternal vaccines and passive monoclonal antibody immunisation for infants. A recent modelling study across 52 low- and middle-income countries reported that a seasonal schedule for passive RSV immunisations could be substantially more efficient than a year-round approach without losing much effectiveness [18]. However, our model prediction was overall more conservative with milder peak RSV activity being predicted than the observed RSV peak; one of the possible reasons for this was increased indoor crowding during the peak season, which was not accounted for by the model due to the scarcity of relevant data.
Our study is not without limitations. Firstly, there was high heterogeneity among different surveillance systems of the included countries in terms of population (age), setting (primary care vs secondary care), sampling strategy, eligibility for testing and testing method. Secondly, all of the 13 included countries were European Union/European Economic Area members and might not fully represent all countries in Europe. Only 1 year of data was available for four included countries and thus we were not able to describe the year-on-year variation in RSV season for these countries. Thirdly, we lacked the data granularity to explore RSV seasonality on a sub-country level or by age group, e.g. paediatric vs elderly populations. Fourthly, our model only accounted for meteorological factors; other factors including human behaviours could also drive viral transmission although some of these were associated with meteorological factors, e.g. more indoor crowding in cold weather. Since the beginning of the COVID-19 pandemic, a near cessation of RSV transmission during periods of movement restrictions and physical distancing has been observed. However, there have been reports on out-of-season RSV activity in several countries, possibly driven by the relaxation of non-pharmaceutical interventions as well as the growing population susceptibility [19,20]. Our current modelling framework was not designed to account for these factors as our data were all collected before the COVID-19 pandemic. Finally, we lacked the data to be able to explore the role of virus-virus interaction in shaping RSV seasonality; a recent modelling study in Scotland supported positive interactions between RSV and human metapneumovirus [21].
Conclusions
Results from our study provide a baseline picture of RSV seasonality and its association with meteorological factors in the pre-RSV-vaccination and pre-COVID-19 era in Europe. With a few RSV prophylactic vaccine candidates on the horizon, our findings on RSV seasonality in Europe along with the prediction model may inform the timing of RSV immunisations as well as seasonal healthcare services planning.
Statements
Ethical statement: Ethical approval was not required because this study used aggregate routine surveillance data.
Funding statement: You Li, Xin Wang, Harry Campbell and Harish Nair are members of the Respiratory Syncytial Virus Consortium in Europe (RESCEU). RESCEU has received funding from the Innovative Medicines Initiative (IMI) 2 Joint Undertaking under grant agreement number 116019. This Joint Undertaking receives support from the EU's Horizon 2020 Research and Innovation programme and the European Federation of Pharmaceutical Industries and Associations.
Acknowledgements
RSV tests results were obtained from the Danish Microbiology Database (MiBa, http://miba.ssi.dk), which contains all electronic reports from departments of clinical microbiology in Denmark since 2010, and we acknowledge the collaboration with the MiBa Board of Representatives. We thank Joan O’Donnell from Health Protection Surveillance Centre, Ireland. We thank Maria Zambon, Tiina Talts, Mary Sinnathamby and Praveen Sebastian Pillai from Public Health England, UK. We thank Marit de Lange, Daphne Reukers, and Rianne van Gageldonk from RIVM-EPI, Pieter Overduin, Mariam Bagheri, Gabriel Goderski, Lisa Wijsman, Sharon van den Brink, and Anne-Marie van den Brandt from RIVM-IDS, and Mariette Hooiveld and Janneke Hendriksen from Netherlands Institute for Health Services Research (Nivel), Netherlands. We thank the Dutch Working Group for Clinical Virology (NWKV) for the use of virology diagnostic reports (non-sentinel data). Anne Teirlinck, Adam Meijer, Hanne-Dorthe Emborg and Ramona Trebbien receive grants from IMI outside this work. We acknowledge the General Practitioner Sentinel Network (Rede Médicos Sentinela), Emergency Room and obstetric network for influenza surveillance and to the Portuguese Laboratory Network for the influenza diagnosis. We acknowledge all colleagues of the laboratory and epidemiology team for influenza and other respiratory viruses surveillance of the National Institute of Health Doutor. Ricardo Jorge, Lisbon, Portugal. We thank all the participants in the Spanish Influenza Surveillance System. We thank Mrs Jana Zitha and Mr Richard Lewis from the Public Health Wales and Welsh NHS laboratory network.
Supplementary Data
European RSV Surveillance Network
Monika Redlberger-Fritz (Center for Virology, Medical University Vienna, Austria), Hanne-Dorthe Emborg and Ramona Trebbien (Statens Serum Institut, Denmark), Joanna Ellis and Jamie Lopez Bernal (Public Health England, England, UK), Olga Sadikova and Liidia Dotsenko (Estonian Health Board, Estonia), Kostas Danis and Sophie Vaux (Santé publique France, National public health institute, France), Silke Buda and Janine Reiche (Robert Koch Institute, Germany), Anna Papa (University of Thessaloniki, Greece), Lisa Domegan (Health Protection Surveillance Centre, Ireland), Linda Dunford (University College Dublin, Ireland), Adam Meijer and Anne C Teirlinck (National Institute for Public Health and the Environment [RIVM], Netherlands), Karol Szymański (National Institute of Public Health - National Institute of Hygiene, Poland), Lidia B Brydak (National Influenza Centre, Poland), Ana Paula Rodrigues and Raquel Guiomar (National Institute of Health Doutor Ricardo Jorge, Portugal), Jim McMenamin and Louise Shaw Primrose (National Health Service National Services Scotland, Scotland, UK), Maja Sočan (National Institute of Public Health, Slovenia), Katarina Prosenc (National Institute for Health, Environment and Food, Slovenia), Jesús Oliva and Inmaculada Casas (Instituto de Salud Carlos III, Spain), and Simon Cottrell and Catherine Moore (Public Health Wales, Wales, UK).
Conflict of interest: YL reports grants from World Health Organization (WHO) and Wellcome Trust, outside the submitted work. HC reports grants from IMI, grants from National Institute of Health Research (NIHR), grants and personal fees from WHO, grants and personal fees from Sanofi, and grants from Bill and Melinda Gates Foundation (BMGF), outside the submitted work. HN reports grants from IMI, grants from WHO, personal fees from BMGF, grants and personal fees from Sanofi, grants from NIHR, personal fees from Janssen, personal fees from AbbVie, and grants and personal fees from Foundation for Influenza Epidemiology, outside the submitted work. XW and EB have nothing to declare.
Authors’ contributions: YL conceptualised the study. EB, YL, XW, and all authors in the European RSV Surveillance Network contributed to data collection. YL led data analysis with contribution from XW. YL led data visualisation with contribution from XW. YL, XW, EB, HC and HN contributed to interpretation of the results. YL wrote the first draft of the report. All authors reviewed the draft for intellectual contents and approved the final version of the report.
References
- 1. Shi T, McAllister DA, O’Brien KL, Simoes EAF, Madhi SA, Gessner BD, et al. Global, regional, and national disease burden estimates of acute lower respiratory infections due to respiratory syncytial virus in young children in 2015: a systematic review and modelling study. Lancet. 2017;390(10098):946-58. 10.1016/S0140-6736(17)30938-8 [DOI] [PMC free article] [PubMed] [Google Scholar]
- 2. Shi T, Denouel A, Tietjen AK, Campbell I, Moran E, Li X, et al. Global Disease burden estimates of respiratory syncytial virus–associated acute respiratory infection in older adults in 2015: a systematic review and meta-analysis. J Infect Dis. 2020;222(Suppl 7):S577-83. 10.1093/infdis/jiz059 [DOI] [PubMed] [Google Scholar]
- 3. Reeves RM, van Wijhe M, Tong S, Lehtonen T, Stona L, Teirlinck AC, et al. Respiratory syncytial virus-associated hospital admissions in children younger than 5 years in 7 European countries using routinely collected datasets. J Infect Dis. 2020;222(Suppl 7):S599-605. 10.1093/infdis/jiaa360 [DOI] [PubMed] [Google Scholar]
- 4. Teale A, Deshpande S, Burls A. Palivizumab and the importance of cost effectiveness. BMJ. 2009;338:b1935. 10.1136/bmj.b1935 [DOI] [Google Scholar]
- 5.PATH. RSV Vaccine and mAb Snapshot. 2020. Available from: https://www.path.org/resources/rsv-vaccine-and-mab-snapshot
- 6. Griffin MP, Yuan Y, Takas T, Domachowske JB, Madhi SA, Manzoni P, et al. Single-dose nirsevimab for prevention of RSV in preterm infants. N Engl J Med. 2020;383(5):415-25. 10.1056/NEJMoa1913556 [DOI] [PubMed] [Google Scholar]
- 7. Madhi SA, Polack FP, Piedra PA, Munoz FM, Trenholme AA, Simões EAF, et al. Respiratory Syncytial Virus Vaccination during Pregnancy and Effects in Infants. N Engl J Med. 2020;383(5):426-39. 10.1056/NEJMoa1908380 [DOI] [PMC free article] [PubMed] [Google Scholar]
- 8. Li Y, Reeves RM, Wang X, Bassat Q, Brooks WA, Cohen C, et al. Global patterns in monthly activity of influenza virus, respiratory syncytial virus, parainfluenza virus, and metapneumovirus: a systematic analysis. Lancet Glob Health. 2019;7(8):e1031-45. 10.1016/S2214-109X(19)30264-5 [DOI] [PubMed] [Google Scholar]
- 9. Chadha M, Hirve S, Bancej C, Barr I, Baumeister E, Caetano B, et al. WHO RSV Surveillance Group . Human respiratory syncytial virus and influenza seasonality patterns-Early findings from the WHO global respiratory syncytial virus surveillance. Influenza Other Respir Viruses. 2020;14(6):638-46. 10.1111/irv.12726 [DOI] [PMC free article] [PubMed] [Google Scholar]
- 10. Broberg EK, Waris M, Johansen K, Snacken R, Penttinen P, Network EIS, et al. Seasonality and geographical spread of respiratory syncytial virus epidemics in 15 European countries, 2010 to 2016. Euro Surveill. 2018;23(5):17-00284. 10.2807/1560-7917.ES.2018.23.5.17-00284 [DOI] [PMC free article] [PubMed] [Google Scholar]
- 11. Mollers M, Barnadas C, Broberg EK, Penttinen P, Teirlinck AC, Fischer TK, European Influenza Surveillance Network . Current practices for respiratory syncytial virus surveillance across the EU/EEA Member States, 2017. Euro Surveill. 2019;24(40):1900157. 10.2807/1560-7917.ES.2019.24.40.1900157 [DOI] [PMC free article] [PubMed] [Google Scholar]
- 12. Sparks AH, Hengl T, Nelson A. GSODR: Global Summary Daily Weather Data in R. J Open Source Softw. 2017;2(10):177. 10.21105/joss.00177 [DOI] [Google Scholar]
- 13.R Core Team. R: A Language and Environment for Statistical Computing. 3.6.1. Vienna: R Foundation for Statistical Computing; 2020. Available from: https://www.R-project.org
- 14. Bloom-Feshbach K, Alonso WJ, Charu V, Tamerius J, Simonsen L, Miller MA, et al. Latitudinal variations in seasonal activity of influenza and respiratory syncytial virus (RSV): a global comparative review. PLoS One. 2013;8(2):e54445. 10.1371/journal.pone.0054445 [DOI] [PMC free article] [PubMed] [Google Scholar]
- 15. Obando-Pacheco P, Justicia-Grande AJ, Rivero-Calle I, Rodríguez-Tenreiro C, Sly P, Ramilo O, et al. Respiratory Syncytial Virus Seasonality: A Global Overview. J Infect Dis. 2018;217(9):1356-64. 10.1093/infdis/jiy056 [DOI] [PubMed] [Google Scholar]
- 16. Caini S, Alonso WJ, Séblain CE-G, Schellevis F, Paget J. The spatiotemporal characteristics of influenza A and B in the WHO European Region: can one define influenza transmission zones in Europe? Euro Surveill. 2017;22(35):30606. 10.2807/1560-7917.ES.2017.22.35.30606 [DOI] [PMC free article] [PubMed] [Google Scholar]
- 17. Vink MA, Bootsma MCJ, Wallinga J. Serial intervals of respiratory infectious diseases: a systematic review and analysis. Am J Epidemiol. 2014;180(9):865-75. 10.1093/aje/kwu209 [DOI] [PubMed] [Google Scholar]
- 18. Li Y, Hodgson D, Wang X, Atkins KE, Feikin DR, Nair H. Respiratory syncytial virus seasonality and prevention strategy planning for passive immunisation of infants in low-income and middle-income countries: a modelling study. Lancet Infect Dis. 2021;21(9):1303-12. 10.1016/S1473-3099(20)30703-9 [DOI] [PMC free article] [PubMed] [Google Scholar]
- 19. Foley DA, Yeoh DK, Minney-Smith CA, Martin AC, Mace AO, Sikazwe CT, et al. The Interseasonal Resurgence of Respiratory Syncytial Virus in Australian Children Following the Reduction of Coronavirus Disease 2019-Related Public Health Measures. Clin Infect Dis. 2021;73(9):e2829-30. 10.1093/cid/ciaa1906 [DOI] [PMC free article] [PubMed] [Google Scholar]
- 20. Casalegno JS, Ploin D, Cantais A, Masson E, Bard E, Valette M, et al. VRS study group in Lyon . Characteristics of the delayed respiratory syncytial virus epidemic, 2020/2021, Rhône Loire, France. Euro Surveill. 2021;26(29):2100630. 10.2807/1560-7917.ES.2021.26.29.2100630 [DOI] [PMC free article] [PubMed] [Google Scholar]
- 21. Nickbakhsh S, Mair C, Matthews L, Reeve R, Johnson PCD, Thorburn F, et al. Virus-virus interactions impact the population dynamics of influenza and the common cold. Proc Natl Acad Sci USA. 2019;116(52):27142-50. 10.1073/pnas.1911083116 [DOI] [PMC free article] [PubMed] [Google Scholar]
Associated Data
This section collects any data citations, data availability statements, or supplementary materials included in this article.