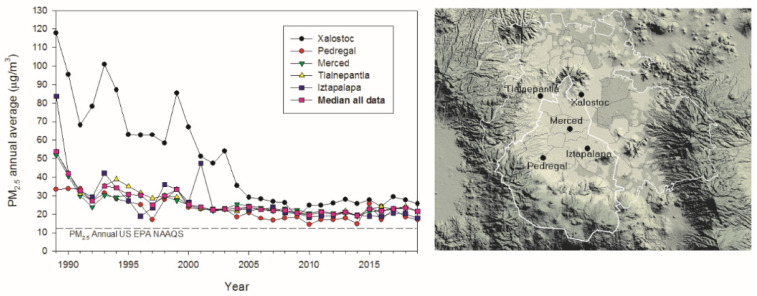
Figure 1.
Time series trend of annual mean 24-h PM2.5 concentrations, averaged over 3 years, as well as the trend of the median for all data for five representative monitoring stations of the MMC from 1990 to April 2020 and their comparison with the US EPA NAAQS, and the map showing the location of the monitoring stations. Data were evaluated from measurements reported by the manual PM network of the Secretaría del Medio Ambiente del Gobierno de la Ciudad de México (SEDEMA) under a 6-day sampling schedule. The central white contour represents the limits of Mexico City and the secondary contour shows the MMC boundary. Source of data and figures: http://www.aire.cdmx.gob.mx/default.php# accessed on 13 January 2022 http://www.aire.cdmx.gob.mx/images/monitoreo/mapa-parametros/Mapa_relieve.jpg accessed on 14 January 2022.

