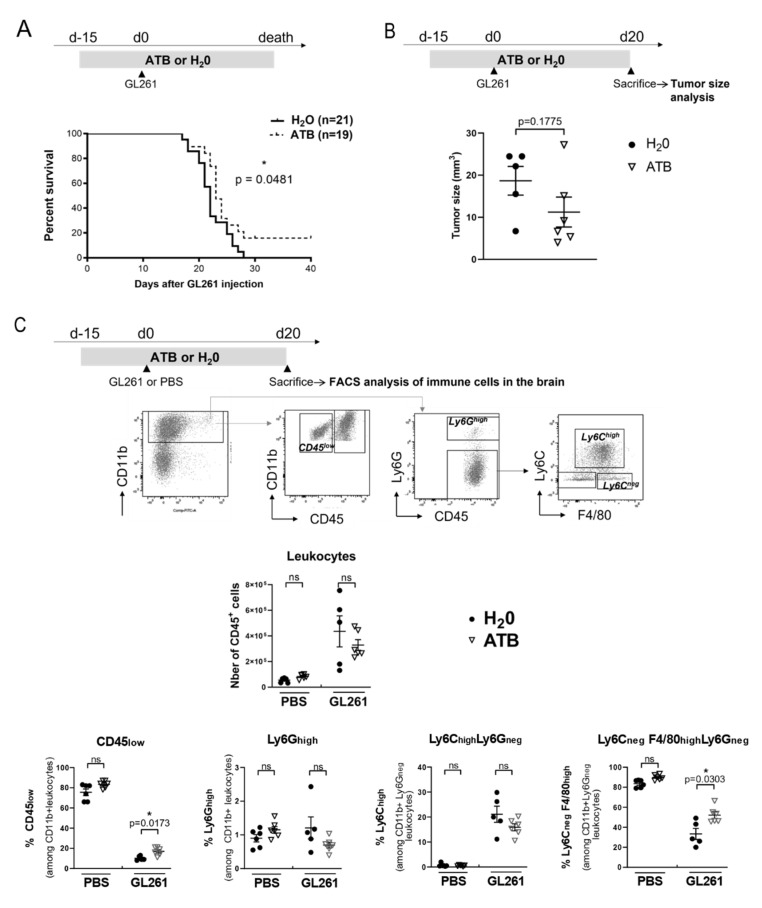
Figure 3.
Antibiotic treatment delays mice death and changes the proportion of different myeloid cells in the brain (A) Survival curves of mice injected with GL261 and treated daily with antibiotics (ATB) (n = 19) or H2O (n = 21) by oral gavage 15 days before the surgery and until sacrifice. Log-rank test compared with control: see the indicated p-value (B) Tumor size of mice injected with GL261 (n = 6) or PBS (n = 5), 20 days after the surgery. (C) Absolute number and proportion of different immune cells (CD45+) in the brain of tumor-bearing (GL261; H2O n = 5; ATB n = 6) and healthy mice (PBS; H2O n = 6; ATB n = 6), by flow cytometry (FACS). A representative gating strategy is depicted. Mann–Whitney test compared ATB and H2O treated mice, * p < 0.05.

