Abstract
The COVID-19 crisis has produced worldwide changes from people’s lifestyles to travel restrictions imposed by world’s nations aiming to keep the virus out. Several countries have created digital information applications to help control and manage the COVID-19 crisis, such as the creation of contact tracing apps. The Peruvian government in collaboration with several institutions developed PerúEnTusManos, an epidemiological tracing application. The application uses georeferencing to study users’ movements and creates individual mobility patterns from the Peruvian citizens as well as detects crowds. In this article, we present a process to detect possible infected individuals based on probabilities assigned to people that had contact with someone who tested positive for COVID-19, using data collected from PerúEnTusManos. The preliminary evaluation shows promising results when detecting probabilities of possible infected individuals as well as the most infected districts in Peru. The ultimate goal of the application in Peru is to provide reliable information to health authorities to make informed decisions about the assignations of the available clinical tests and the economic re-activation.
Index Terms—: COVID-19, contact tracer, mobility markov chains, mobility model, PerúEnTusManos
I. Introduction
The COVID-19 crisis has produced worldwide changes from people’s lifestyles to travel restrictions imposed by world’s nations aiming to keep the virus out. As November 19, 2020, Peru reported1 over 939, 931 infected people and 35, 317 deceased2. To prevent the collapse of fragile Peruvian health system, a state of emergency was established, that included economic, health, and social isolation measures. However, the number of positive cases of COVID-19 dramatically increased. Two main reasons why social isolation did not have the expected results are 1) the continuous operation of informal businesses despite the interdiction issued by the government, and 2) more recently several protests caused by a political crisis. Mostly young protesters participated in these events which might increased home transmissions of COVID-19 as suggested in several works [1]. Moreover, activities resumed in several essential productive sectors after the lockdown, however, the minimum human interaction density was not respected.
Therefore, it is essential to develop systems to understand how citizens move and spread the disease in this scenario. Thus, several countries have created digital information applications to help control, monitor, and manage the COVID-19 crisis, such as the creation of contact tracing apps. The Peruvian government in collaboration with several universities and private companies designed, implemented, and deployed the application PerúEnTusManos [2]3, an epidemiological digital contact tracing application. An important process of PerúEnTusManos is the estimation of the contagion probability of a person with COVID-19 based on their contact with infected people. In this paper, we present the process to detect the list of possible infected users based on probabilities. This workflow takes as input geo-positions (GPS) from users, which have previously been anonymized and sanitized. Subsequently, our proposal returns a list of users and their probability of being positive for COVID-19 as well as a list of the most infected districts in Peru. The results are displayed on a dashboard to help government entities in their decision-making process.
II. State-of-the-Art
Several efforts have been made to understand the dynamic of COVID-19 based on tracers that use mobile phones, such as BlueTrace [3] developed by the government of Singapore which records encounters using bluetooth; where the infected users are requested to share their encounters recorded by BlueTrace to filter out close contacts and potentially infected contacts. Another similar work is the French application Stop Covid [4] that records an encounter when people cross paths for a certain time at a certain distance, then if a positive case is confirmed, those who have encounters with this person are notified. Stop Covid complies with the European law of personal data protection (GDPR) and uses bluetooth only. Collecting personal data could raise distrust on the population, therefore, the challenge is to develop an application that respects users’ privacy and is not intrusive.
Israel launched a mobile application too called Maguen [5] that sends a warning when an user is close to a zone with a high number of COVID-19 cases. If an infected person does not have the application installed, the authorities use the intelligence services to track the cell phone and record all its two last weeks historical movements. Likewise, South Korea developed an application called Self-quarantine safety protection [6], where the user is requested to give their data and answer a questionnaire. Health authorities evaluate this information and the possible health risks in order to make a remote diagnosis to suggest whether the person should confine. This application also allows citizens to be monitored while they are in quarantine period using geo-location. The MIT Media Lab with other universities also created an application named COVID Safe Paths [7], which allows citizens to know if they have had contact with someone infected with COVID-19. Moreover, the app allows the health authorities to know the movements of infected people and detect areas with a high concentration of positive cases.
III. Methods
Figure 1 shows the overview of the PerúEnTusManos process to detect possible new infections due to contacts with people already infected with COVID-19. The process consists of three main steps.
Step 1 - Data Gathering: Using cellphones data, we collect pseudonymous identifiers, latitudes, longitudes and timestamps of PerúEnTusManos users.
-
Step 2 - Infection Probability Calculation: Based on the data collected, we then calculate the probability of COVID-19 infection. Step 2 is dived in three stages. Stage (a) records encounters with infected people based on time and distance. Note that different parameters for distance and time are tested, distance ranges from 10m to 300m and time from 5 to 15 minutes. Stage (b) calculates probabilities of infection using Formula 1, which is based on an existing contagion probability model [8]. Where τ is exposure time, r is inactivity, s is susceptibility, and ρ is transmissibility.
(1) Moreover, the probability over time when a person has different encounters with COVID-19 infected is calculated using Formula 2, previously proposed in [9].(2) We also follow the configuration of parameters proposed and described in [10], [11]. Finally, stage (c) which builds and provides a geolocated list containing people associated with a probability of infection.
Step 3 - Points of Interest Identification: Builds an individual mobility Markov chain (MMC) [12] per user to identify point of interests (POI) like home or work. The use of MMC models provides several advantages associated with mobility properties such as predictability, entropy, and average distance traveled per day, which is used to estimate the probability of infection.
Fig. 1:
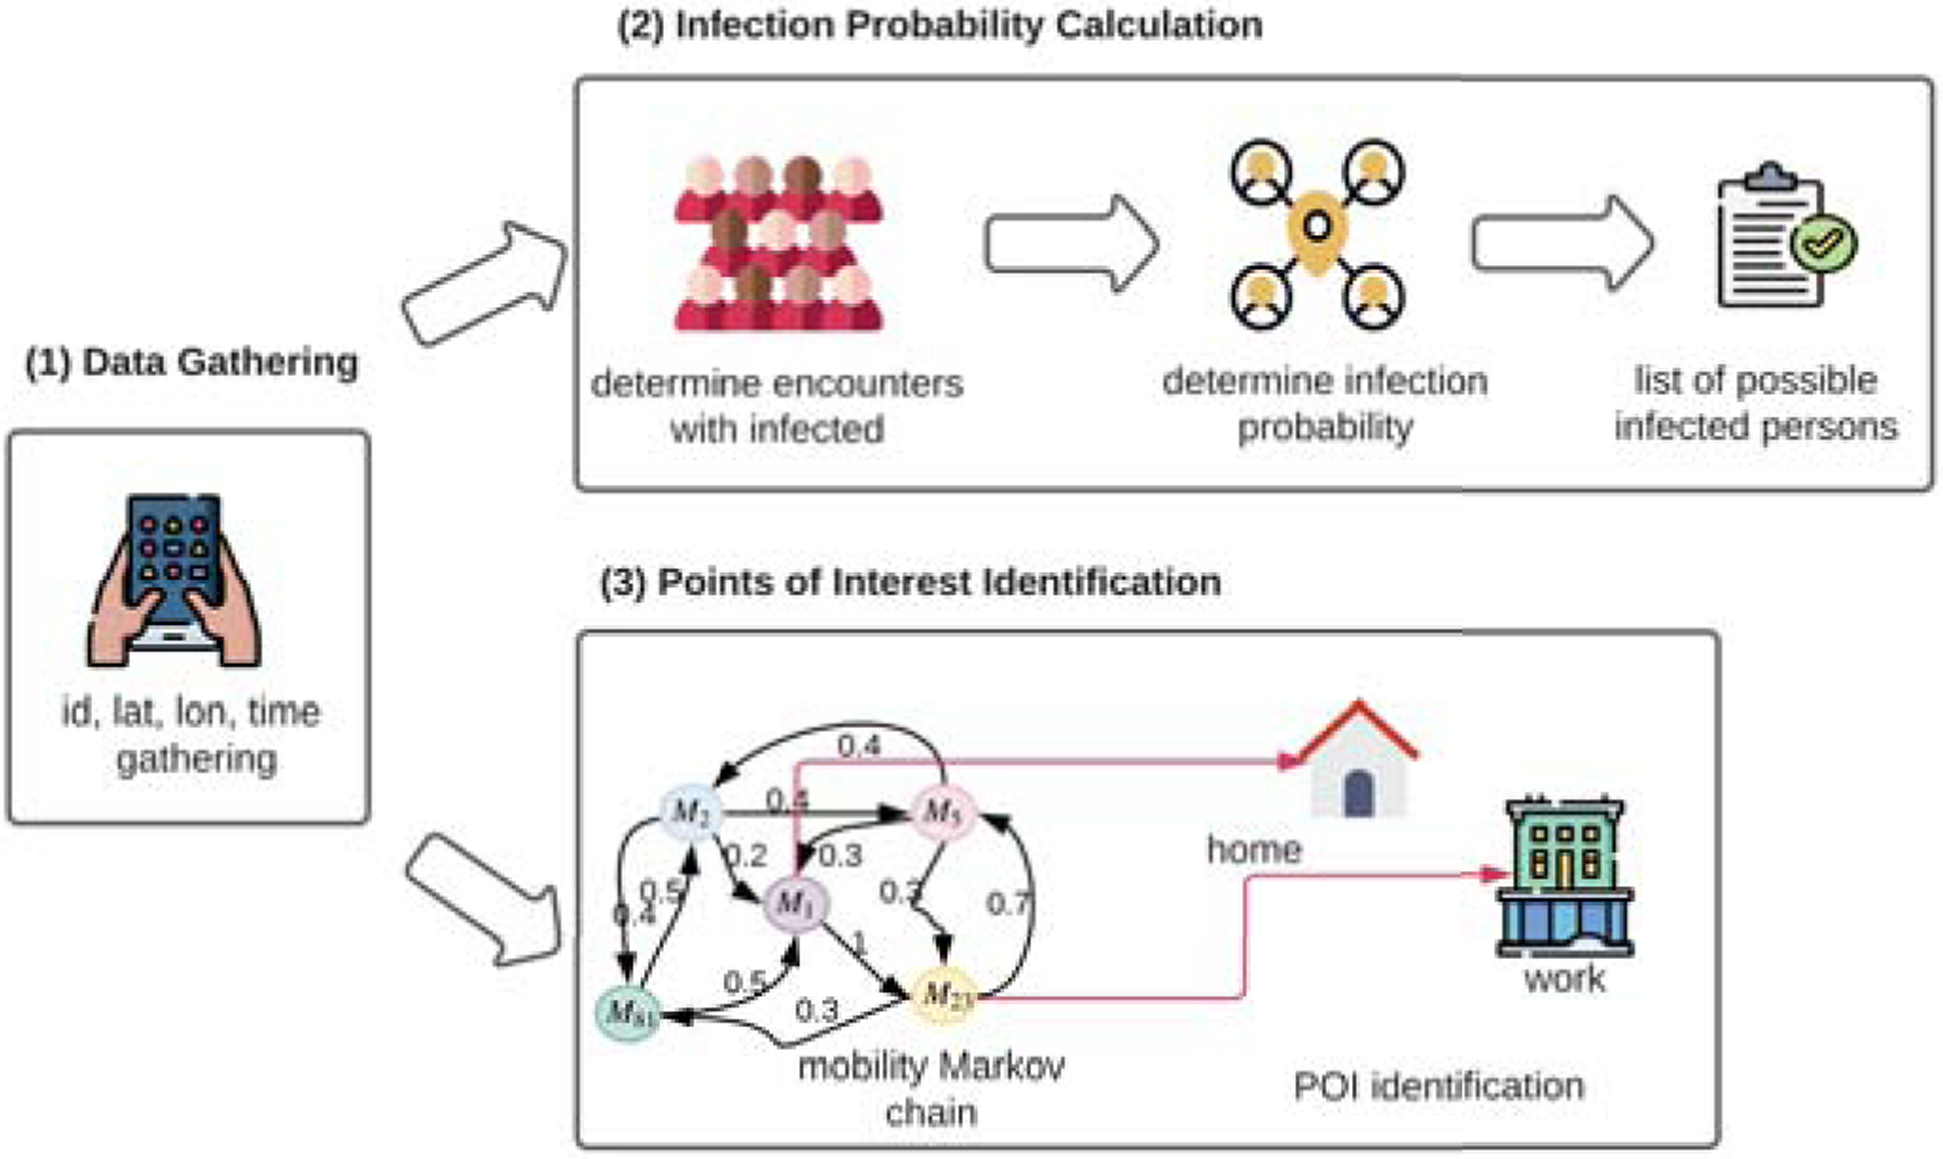
Workflow to detect a list of people possibly infected with COVID-19 based on three steps: (1) Data Gathering, (2) Infection Probability Calculation, and (3) Points of Interest Identification.
IV. Experiments and results
In this section we describe the experiments of the model and the inference of contagion probability. As previously mentioned, we parameterize the model of Formula 1 with the parameters’ values suggested in [8], [10], [11], where the exposure time τ has a random value of a gamma distribution [13], the infectivity r = 0.025, and the transmissibility ρ = 2.2. For the susceptibility s, we test three different properties of the MMC model: predictability, entropy, and average distance traveled per day as susceptibility values. Therefore, we test with 238 465 users to verify the contagion probability distribution.
We observe in Figure 2 the contagion probability has a normal distribution centered in 0.1 when using the predictability as susceptibility value. The principle of the predictability is that the more POIs someone visits the less predictable is.
Fig. 2:
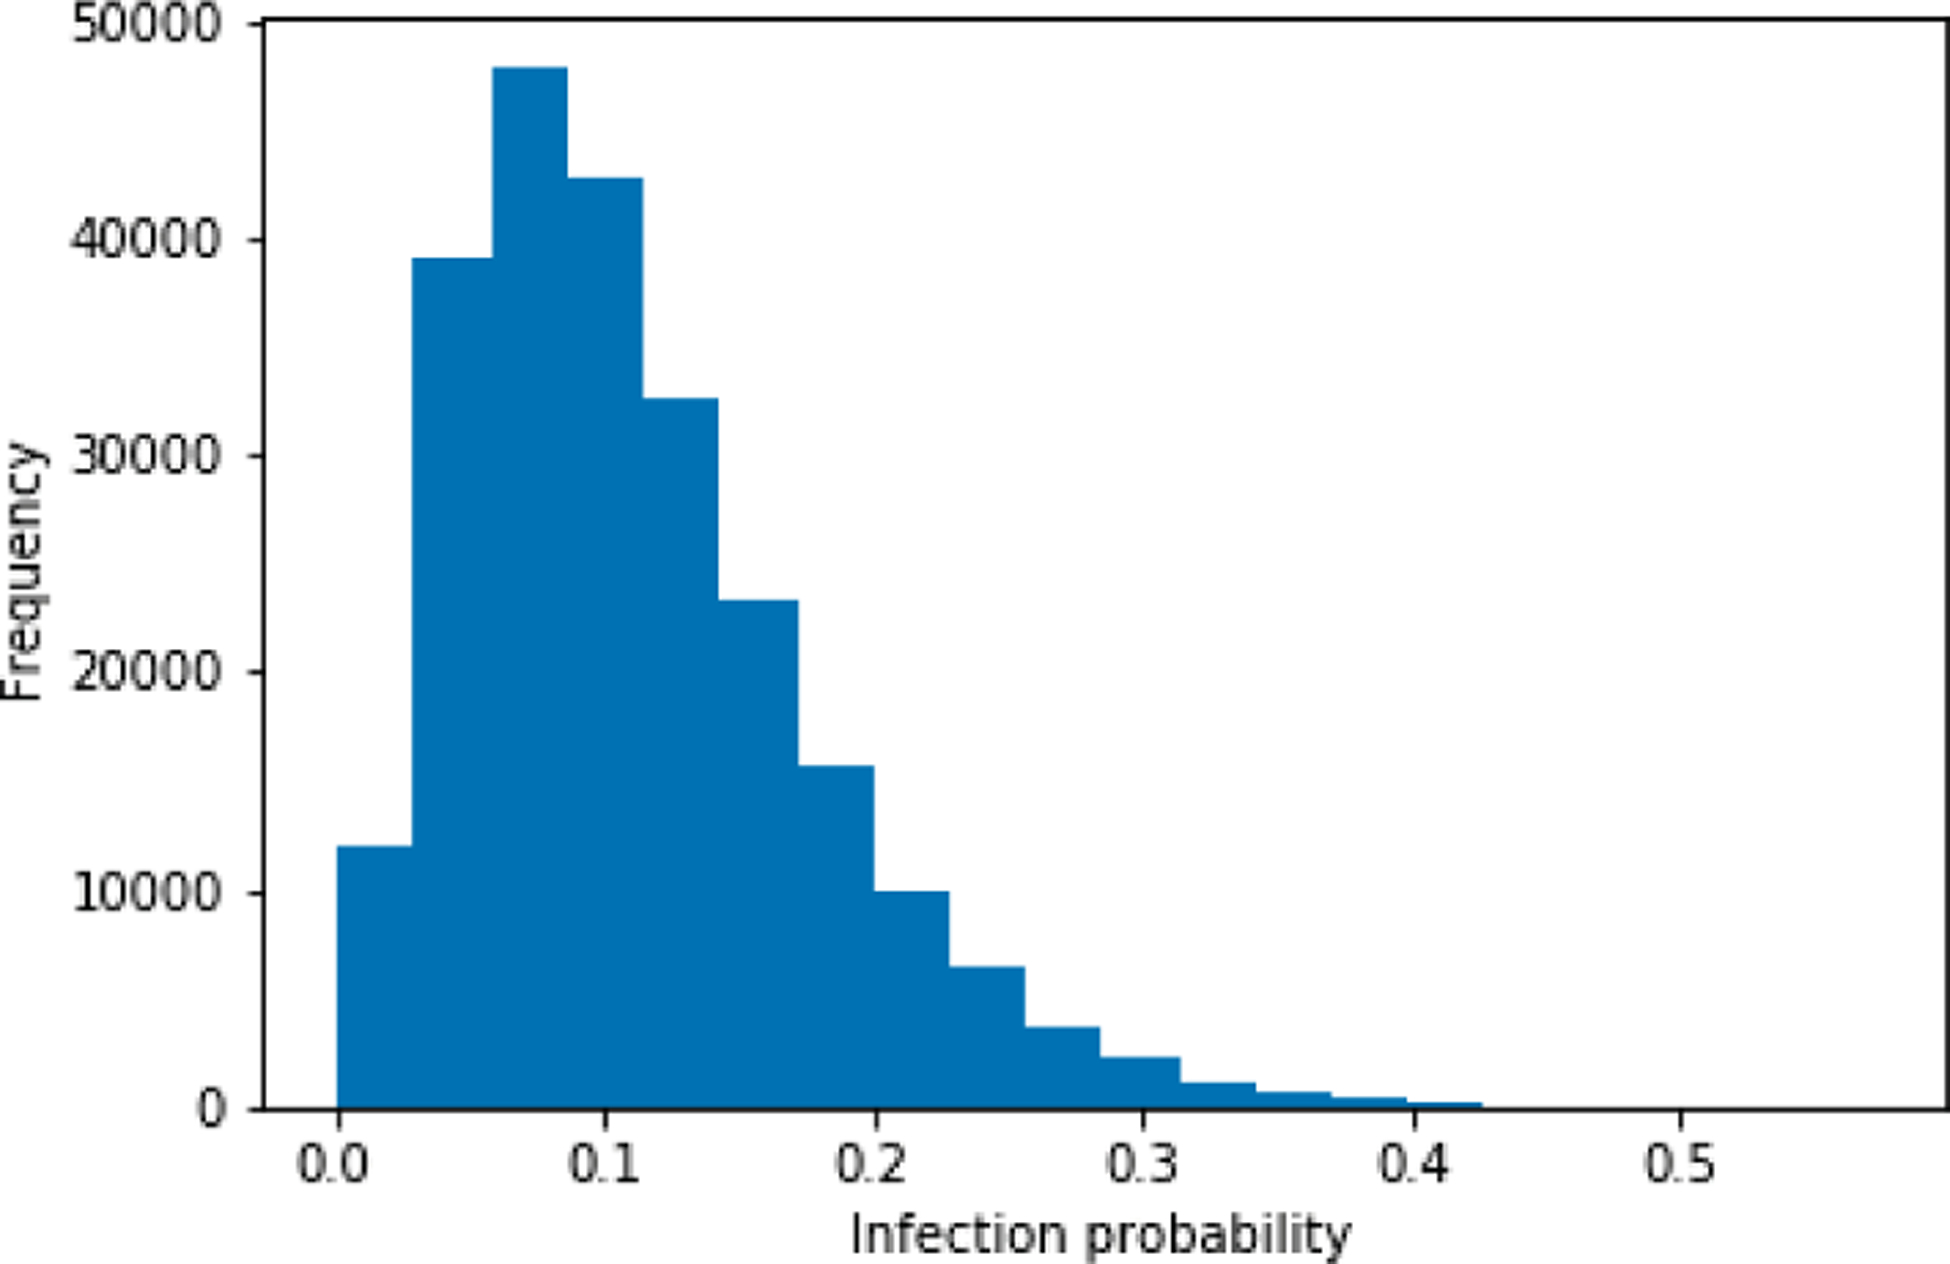
Contagion probability using Formula 1 with r = 0.025, ρ = 2.2 and s as the predictability.
Figure 3 depicts the contagion probability when using the entropy as susceptibility. We observe a normal distribution centered in 0.2, where the entropy measures the diversity of POIs. Thus, an individual moving a lot will have a high entropy value. Figure 4 illustrates the contagion probability while using the average distance traveled per day. We observe an uniform distribution with two picks: the first between 0 and 0.1 and the second between 0.9 and 1.
Fig. 3:
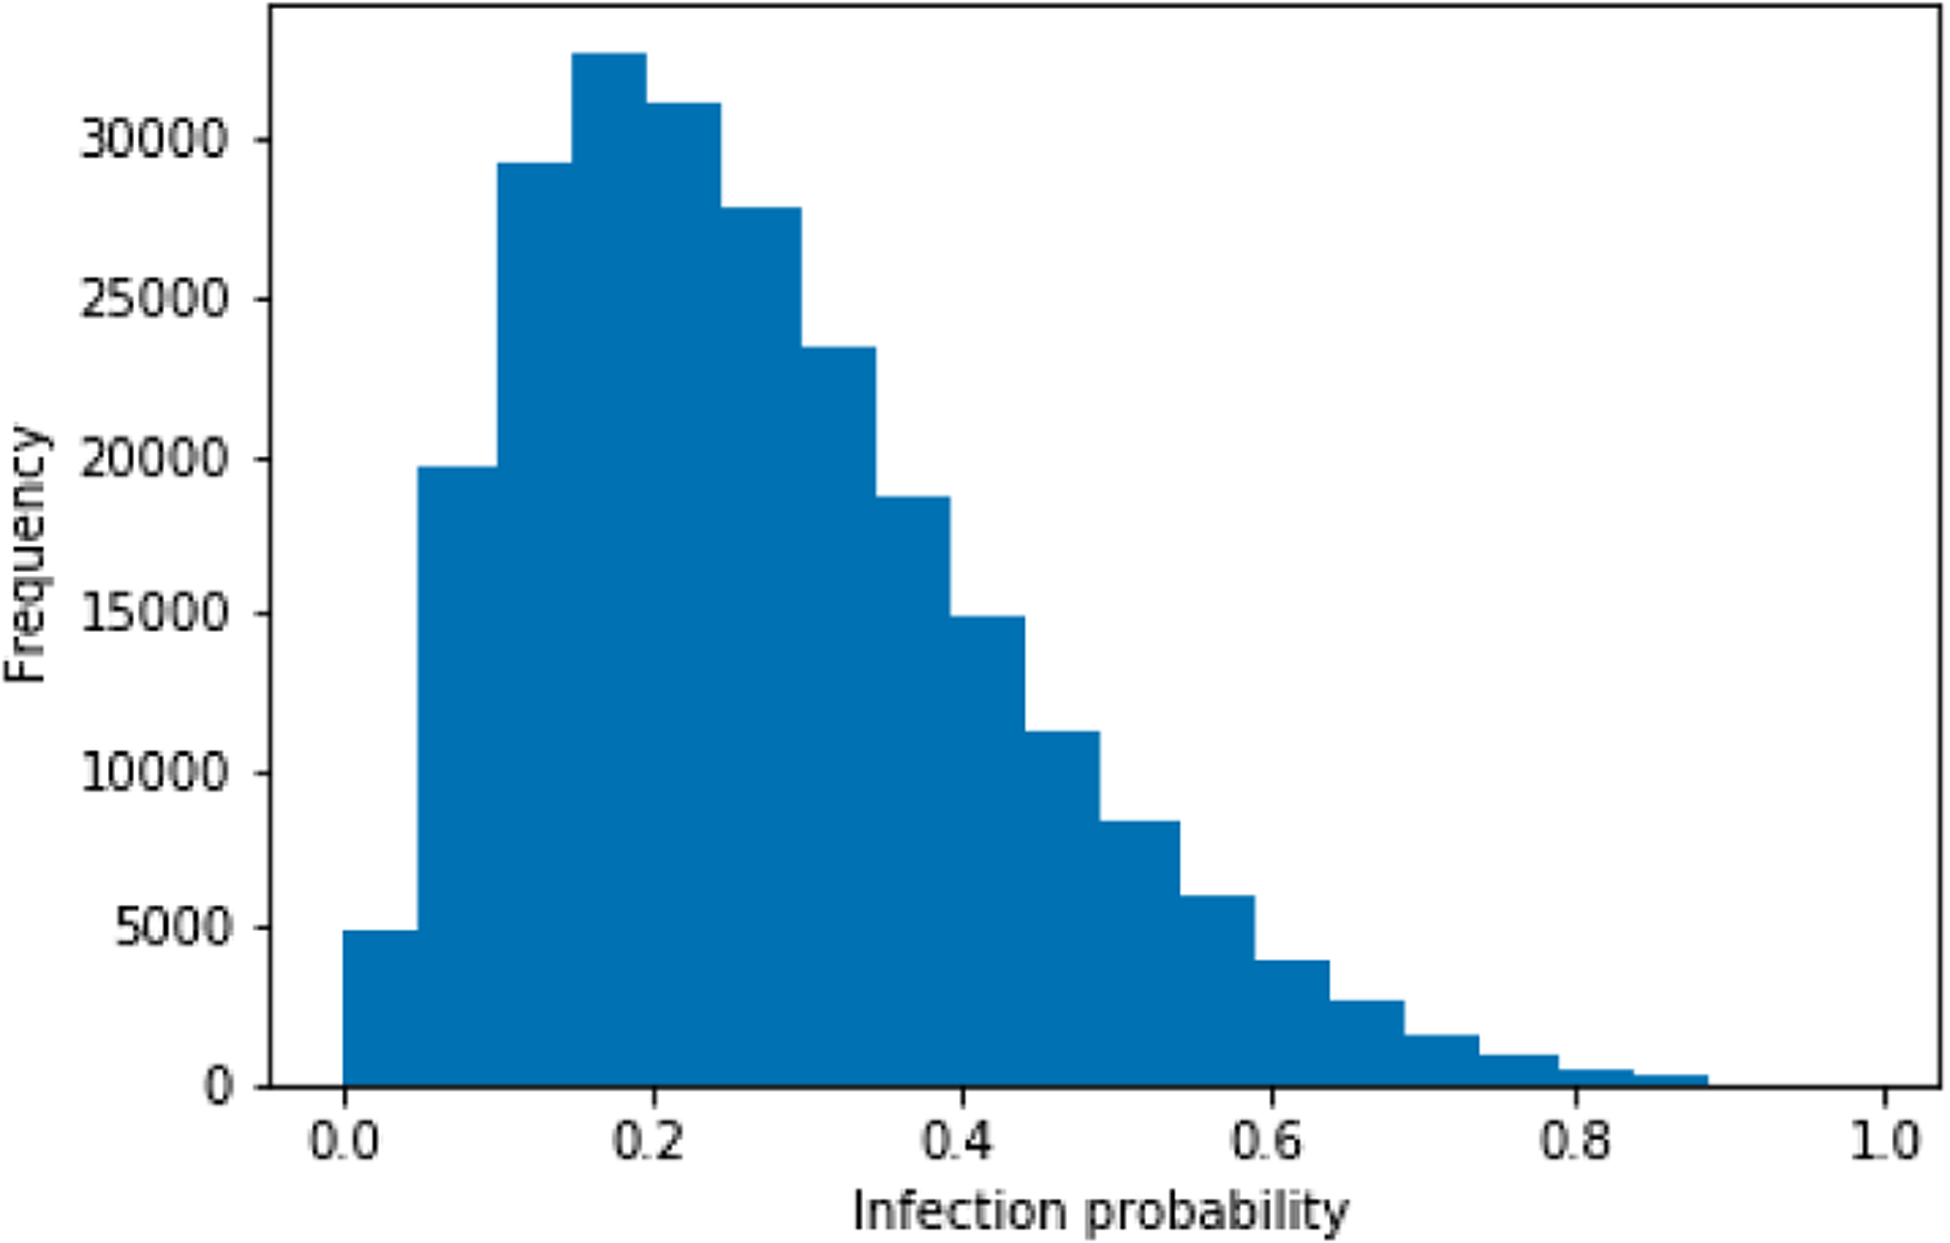
Contagion probability using Formula 1 with r = 0.025, ρ = 2.2, and s as the entropy.
Fig. 4:
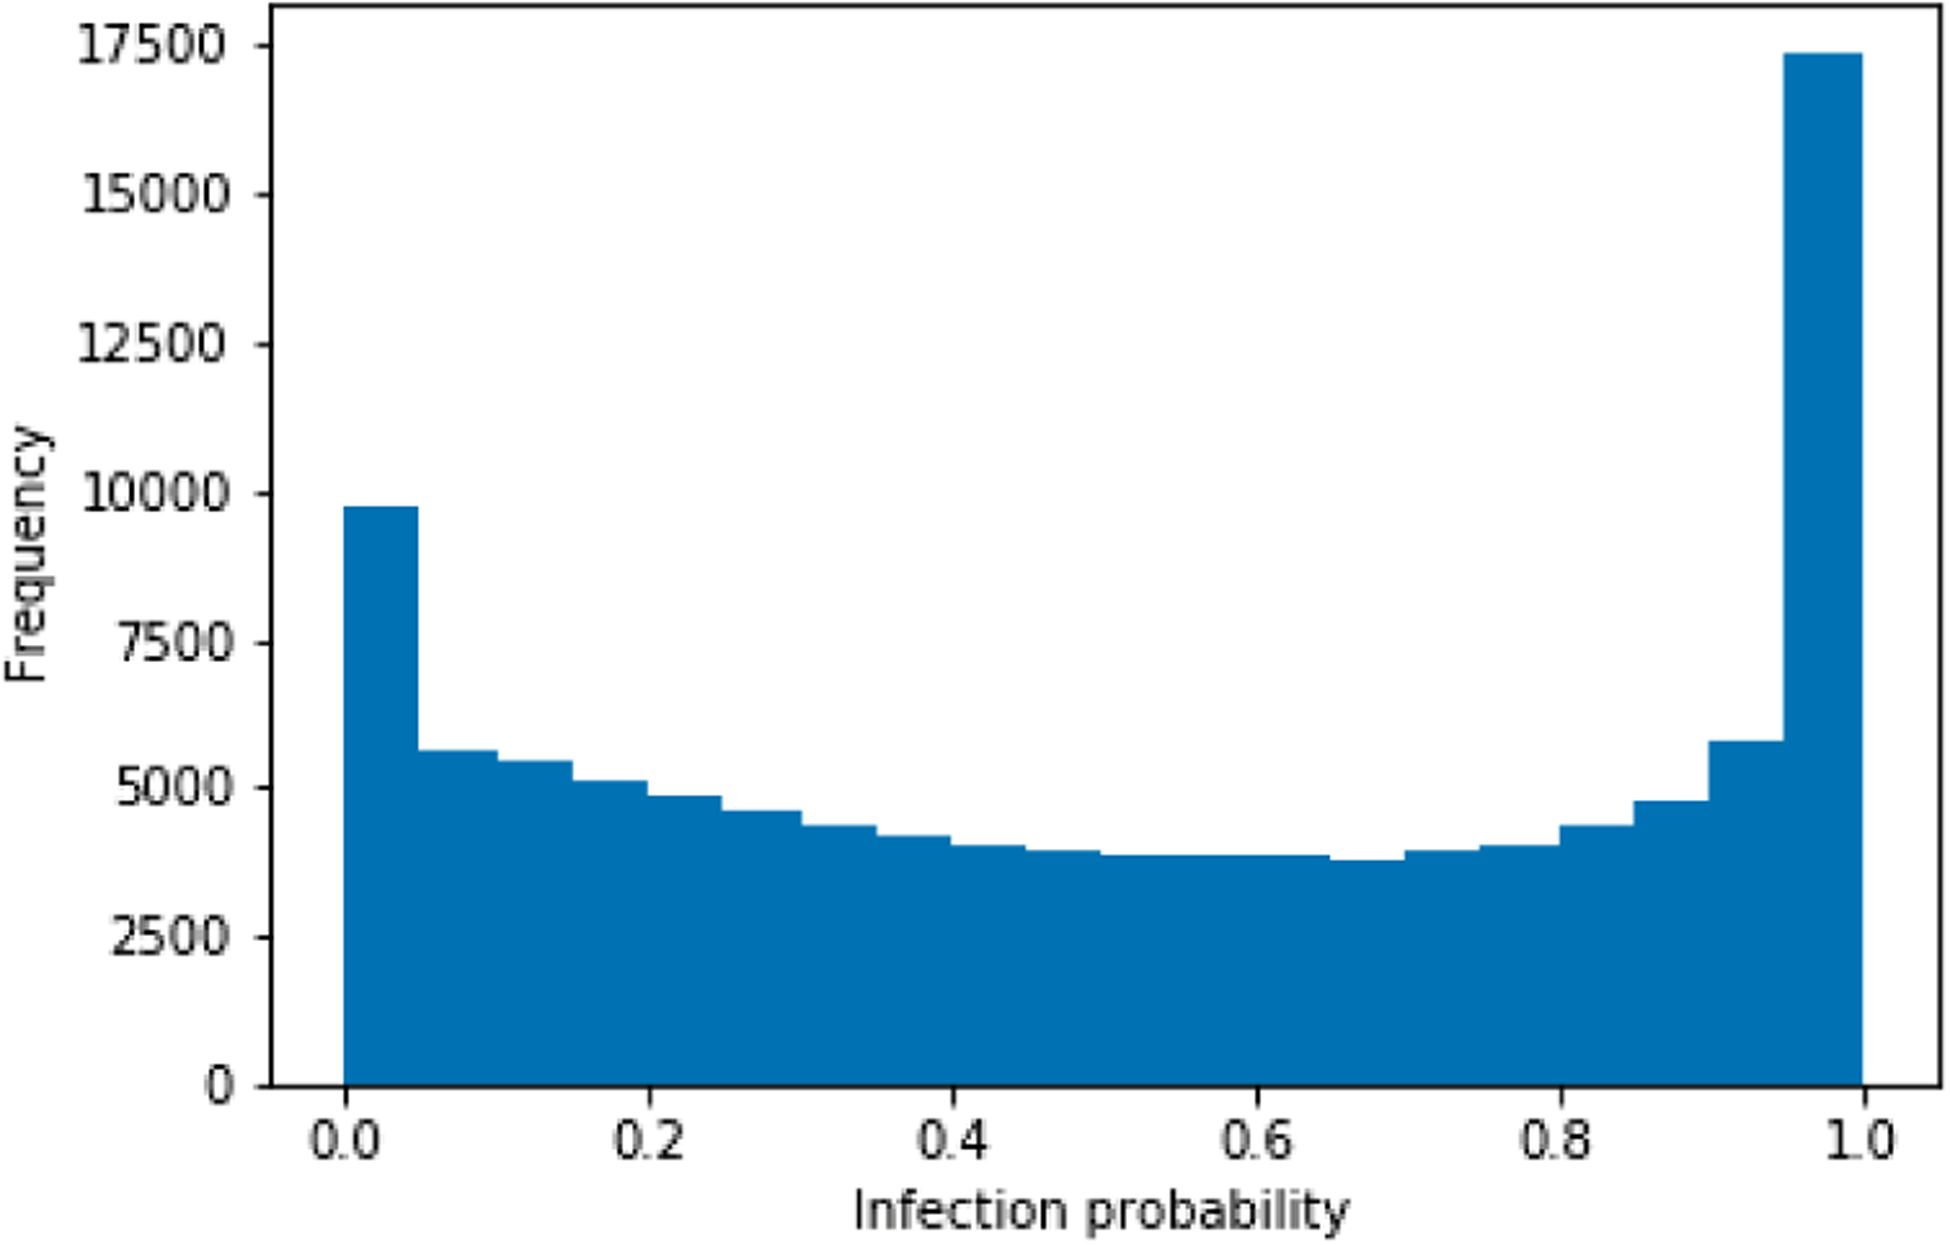
Contagion probability using Formula 1 with r = 0.025, ρ = 2.2 and s as the average distance traveled per day.
Also, to validate the most suitable distribution, we compare our distributions against those reported in a study of 40 patients in Whuan China (see Fig. 1 in [14]) and distributions build from GPS data gathered from different mobile application in Latin America (see Fig. 11(a) in [9]). We observed the distribution based on the average distance traveled per day follows the best COVID-19 probability distribution contagion. Once the model of Formula 1 is empirically parameterized, we use a spatio-temporal windows of 10 meters and 5 minutes to compute the contagion probability for each encounter. Then, we generate a sorted list of contagion probability which is provided to public health authorities to make a decision on sending alert SMS messages.
For the inference of contagion probability, Table I presents the top ten districts with the highest number of positive cases of COVID-19 recovered by our proposal from March to October 2020. These districts are shown graphically in Figure 5. In general, the application could identify most of the highest infected districts in Peru. We also observed that the model could identify more accurately the highest districts when the application had more users. Also, note that Table I shows a difference between the values and the number of cases registered by our application and those sensed by official sources. This difference is caused since we use citizens’ geo-positions, while in the official data, citizens’ legal addresses are used.
Table I:
Top 10 Lima districts with the highest number of positive COVID-19 cases
| District | No. of cases Our application |
No. of cases Official Sources |
|---|---|---|
| Santiago de Surco | 568 | 4,223 |
| San Martín de Porres | 522 | 10,851 |
| San Juan de Lurigancho | 467 | 14,466 |
| Los Olivos | 350 | 4,885 |
| Ate | 328 | 7,900 |
| Lima | 325 | 4,563 |
| San Miguel | 293 | 2,629 |
| Chorrillos | 266 | 175 |
| Comas | 256 | 8,687 |
| San Borja | 253 | 1,992 |
Fig. 5:
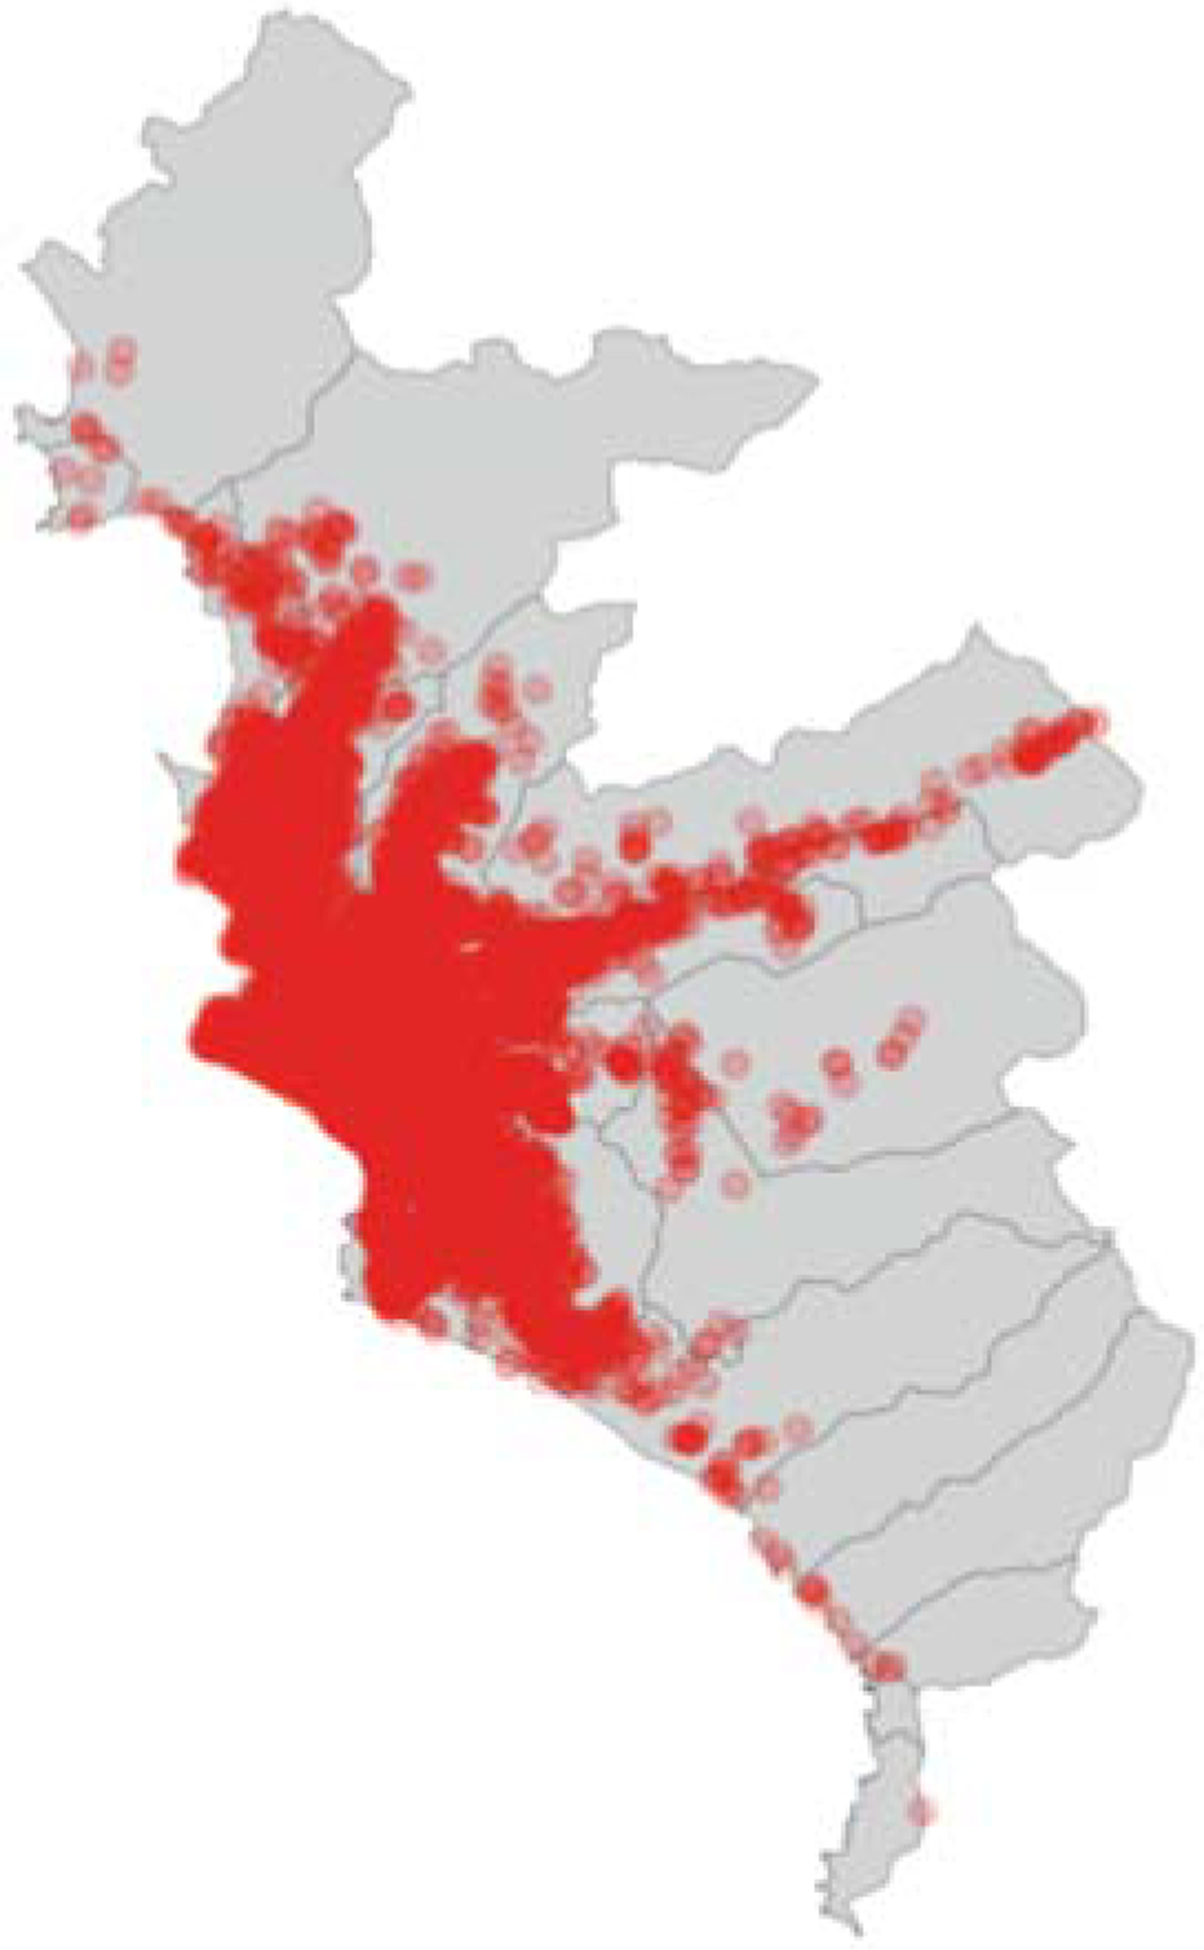
Lima infection map.
There are several limitations associated with tracer applications. In our case, we noticed a bias due to districts having more users than others, since there were several districts that organized ad campaigns to recommend the application use. Another main reason for the bias was the number of active users the application had during the time (days, weeks, months). Finally, a significant part of the population do not want to use the application because of privacy issues fear. However, the application does anonymize all users’ data.
V. Conclusions
In this work, we presented a process of PerúEnTusManos, the Peruvian contact tracing app, to detect a list of people possibly infected with COVID-19. This process enables to understand how people with high probability to be COVID-19 positive commute in the city. The results showed to be accurate when detecting possible infected people. Also, the contacts found will allow to tweak our epidemiological model to understand how the virus spreads.
Moreover, we are currently assessing the results in detail, where detailed time windows (days, weeks, and months) are considered. Finally, we are also creating a new process for the application, which uses machine learning models to perform a pre-diagnoses based on the symptoms of the people previously detected by the app as high probability of contagion.
Acknowledgment
Research reported in this publication was partially supported by the National Council of Science and Technology CONCYTEC “Special Projects: Response to COVID-19”, through project No 70744: “COVID: COntrol de VIrus Dinamico”. Researchers from Stanford University were supported by the NIH (grants DP2CA225433 and K24AR075060). Authors thank to the colleagues from the Cabinet of Peru and UTEC for the discussions about contact tracing.
Footnotes
References
- [1].Park YJ, Choe YJ, Park O, Park SY, Kim Y-M, Kim J, Kweon S, Woo Y, Gwack J, Kim SS et al. , “Contact tracing during coronavirus disease outbreak, south korea, 2020,” Emerging infectious diseases, vol. 26, no. 10, pp. 2465–2468, 2020. [DOI] [PMC free article] [PubMed] [Google Scholar]
- [2].Presidencia del Consejo de Ministros, “Gobierno implementa aplicativo para identificar situaciones de riesgo y detener cadena de contagio por COVID19,” https://www.gob.pe/institucion/pcm/noticias/111820-gobierno-implementa-aplicativo-para-identificar-situaciones-de-riesgo-y-detener-cadena-de-contagio-por-covid19, 2020, online; accessed 11 May 2020.
- [3].Bay J, Kek J, Tan A, Hau CS, Yongquan L, Tan J, and Quy TA, “Bluetrace: A privacy-preserving protocol for community-driven contact tracing across borders,” 2020. [Google Scholar]
- [4].Sportisse Bruno, “Contact tracing: an overview of the challenges,” https://www.inria.fr/en/contact-tracing-overview-challenges-bruno-sportisse-inria-ceo, 2020, online; accessed 13 May 2020.
- [5].Winer Stuart, “Health ministry launches phone app to help prevent spread of coronavirus,” https://www.timesofisrael.com/health-ministry-launches-phone-app-to-help-prevent-spread-of-coronavirus/, 2020, online; accessed 13 May 2020.
- [6].Central Disaster and Safety Countermeasures Headquarters, “Guide on the Installation of“Self-quarantine Safety Protection App”,” http://ncov.mohw.go.kr/upload/ncov/file/202004/1585732793827_20200401181953.pdf, 2020, online; accessed 13 May 2020.
- [7].Raskar R, Schunemann I, Barbar R, Vilcans K, Gray J, Vepakomma P, Kapa S, Nuzzo A, Gupta R, Berke A et al. , “Apps gone rogue: Maintaining personal privacy in an epidemic,” arXiv preprint arXiv:2003.08567, 2020. [Google Scholar]
- [8].Frias-Martinez E, Williamson G, and Frias-Martinez V, “An agent-based model of epidemic spread using human mobility and social network information,” in 2011 IEEE third international conference on privacy, security, risk and trust and 2011 IEEE third international conference on social computing. IEEE, 2011, pp. 57–64. [Google Scholar]
- [9].Serafino M, Monteiro HS, Luo S, Reis SD, Igual C, Neto ASL, Travizano M, Andrade JS, and Makse HA, “Superspreading k-cores at the center of covid-19 pandemic persistence,” medRxiv, 2020. [Google Scholar]
- [10].Wölfel R, Corman VM, Guggemos W, Seilmaier M, Zange S, Müller MA, Niemeyer D, Jones TC, Vollmar P, Rothe C et al. , “Virological assessment of hospitalized patients with covid-2019,” Nature, vol. 581, no. 7809, pp. 465–469, 2020. [DOI] [PubMed] [Google Scholar]
- [11].Kucharski AJ, Russell TW, Diamond C, Liu Y, Edmunds J, Funk S, Eggo RM, Sun F, Jit M, Munday JD et al. , “Early dynamics of transmission and control of covid-19: a mathematical modelling study,” The lancet infectious diseases, 2020. [DOI] [PMC free article] [PubMed] [Google Scholar]
- [12].Gambs S, Killijian M-O, and del Prado Cortez MN, “Show me how you move and i will tell you who you are,” in Proceedings of the 3rd ACM SIGSPATIAL International Workshop on Security and Privacy in GIS and LBS, 2010, pp. 34–41. [Google Scholar]
- [13].Beyer WH, “Crc standard mathematical tables and formulae,” csmt, 1991. [Google Scholar]
- [14].Ferretti L, Wymant C, Kendall M, Zhao L, Nurtay A, Abeler-Dörner L, Parker M, Bonsall D, and Fraser C, “Quantifying sars-cov-2 transmission suggests epidemic control with digital contact tracing,” Science, vol. 368, no. 6491, 2020. [DOI] [PMC free article] [PubMed] [Google Scholar]


