

Graphical Abstract
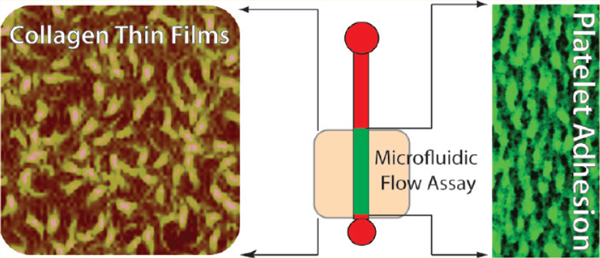
Von Willebrand factor (VWF) binding and platelet adhesion to subendothelial collagens are initial events in thrombus formation at sites of vascular injury. These events are often studied in vitro using flow assays designed to mimic vascular hemodynamics. Flow assays commonly employ collagen-functionalized substrates, but a lack of standardized methods of surface ligation limits their widespread use as a clinical diagnostic. Here, we report the use of collagen thin films (CTF) in flow assays. Thin films were grown on hydrophobic substrates from type I collagen solutions of increasing concentration (10, 100, and 1000 μg/mL). We found that the corresponding increase in fiber surface area determined the amount of VWF binding and platelet adhesion. The association rate constant (ka) of plasma VWF binding at a wall shear stress of 45 dyn/cm2 was 0.3 × 10⁵, 1.8 × 10⁵, and 1.6 × 10⁵ M−1 s−1 for CTF grown from 10, 100, and 1000 μg/mL solutions, respectively. We observed a 5-fold increase in VWF binding capacity with each 10-fold increase in collagen solution concentration. The association rates of Ser1731Thr and His1786Asp VWF mutants with collagen binding deficiencies were 9% and 22%, respectively, of wild-type rates. Using microfluidic devices for blood flow assays, we observed that CTF supported platelet adhesion at a wall shear rate of 1000 s−1. CTF grown from 10 and 100 μg/mL solutions had variable levels of platelet surface coverage between multiple normal donors. However, CTF substrates grown from 1000 μg/mL solutions had reproducible surface coverage levels (74 ± 17%) between normal donors, and there was significantly diminished surface coverage from two type 1 von Willebrand disease patients (8.0% and 24%). These results demonstrate that collagen thin films are homogeneous and reproducible substrates that can measure dysfunctions in VWF binding and platelet adhesion under flow in a clinical microfluidic assay format.
INTRODUCTION
Following a vascular injury, bleeding is arrested by platelets that first adhere to the exposed subendothelial matrix and then aggregate to form a hemostatic plug. It is well-recognized that shear stress plays a critical role in this process.1 As such, in vitro methods of characterizing platelet function under physiological shear stress offer potential in improving the diagnoses and treatment of platelet adhesion disorders such as von Willebrand disease (VWD), which is often difficult to categorize into clinically relevant phenotypes.2 Over the past 30 years, flow assays to measure platelet function have been developed toward this application in the format of annular or parallel plate flow chambers,3–7 or more recently, microfluidic formats that minimize volume and increase throughput.8,9 Common to all flow assays is the necessity of functionalizing a substrate with adhesive proteins capable of capturing and activating platelets under flow. However, a repeatable, standardized adhesive substrate remains poorly defined, limiting interpretation of data between laboratories and adoption into the clinical setting.10
The most common adhesive proteins used in flow assays are extracellular matrix (ECM) proteins such as types I, III, and VI collagens and laminin, and plasma proteins such as fibrinogen, fibronectin, and von Willebrand factor (VWF).11,12 At low shear stresses (<15 dyn/cm2), platelets can interact directly with collagens through two receptors, glycoprotein VI and the integrin α2β1.13,14 At high shear stresses (>15 dyn/cm2), such as those encountered in the major arteries, plasma derived VWF assembles on collagens at the site of a vascular injury, allowing platelets to first roll over VWF before firmly adhering to collagen.15 The source and the preparation of collagens in flow assays has long been a cause of controversy in the hemostasis field.16,17 The most widely used substrates are types I and III insoluble fibrillar collagen. These insoluble collagens are potent platelet agonists and considered the most physiological in terms of their macromolecular structure.16 Drawbacks of insoluble collagens include heterogeneity in the size and type of fibers,1 impurities within the solution (including VWF),18 and difficulty in defining a repeatable surface at the submillimeter scale, which limits its use, especially in microfluidic assays.8
There have been recent efforts to improve the reproducibility of collagen preparations for a variety of biological assays while achieving control over surface features, ligand densities, and molecular composition. One such approach is the use of reconstituted collagen fibers.19,20 This material can be deposited onto both hydrophobic and hydrophilic surfaces through the self-assembly of collagen monomers into fibers at the solid–liquid interface.20,21 This process is initiated by neutralizing a solution of acid-solublized or pepsin-digested collagen monomers. The resulting collagen thin films (CTF) have been applied in investigations of adhesion and spreading of vascular smooth muscle cells,22 endothelial cells,23 and fibroblasts.24
In this study, we report the application of CTF for measuring VWF–collagen binding and platelet–collagen adhesion under arterial shear stresses. We examined the role of pH and collagen concentration on thin film properties and function. Surface features of thin films were determined by atomic force microscopy (AFM), profilometry, and surface plasmon resonance (SPR). Our results show that collagen thin films are a homogeneous substrate at the micrometer length scale and can support VWF binding and platelet adhesion under physiologically relevant shear stress. We found that VWF association rates and binding levels, and platelet adhesion levels, can be manipulated by altering the thin film properties. Finally, as a demonstration of the potential clinical utility of these substrates, we were able to detect collagen-binding deficiencies in VWF and platelet adhesion deficiencies in flow assays using blood from type 1 VWD patients. Taken together, these studies move toward a standardized approach of substrate preparations for flow assays measuring hemostatic function.
EXPERIMENTAL SECTION
Materials.
Type I equine tendon insoluble collagen was obtained from Chrono-log Corporation. Acid-solubilized type I bovine collagen and all chemicals were purchased from Sigma-Aldrich unless noted otherwise. Antihuman CD41a – PE/Cy5 antibody was obtained from BD Pharminogen and used to label platelets in whole blood. Abciximab, an αIIbβ3 antagonist (ReoPro, Eli Lilly), was obtained from University of Colorado Hospital pharmacy and used in whole blood. Prostacyclin was obtained from Cayman Chemical Co. Human plasma VWF was obtained from Haematologic Technologies Inc. Recombinant VWF samples expressed in human embryonic kidney (HEK) 293T cells following site-directed mutagenesis using the Stratagene QuikChange kit (Stratagene, La Jolla, CA, USA) were received from Dr. Veronica Flood at the BloodCenter of Wisconsin. Recombinant VWF samples included wild type (wt) VWF, French Ser1731Thr, and His1786Asp VWF constructs.25 Recombinant VWF samples were concentrated using ultrafiltration devices with a 100 kDa nominal molecular weight limit (Millipore) and then quantified with an ELISA. All VWF samples were stored at −80 °C until use. Purified mouse antihuman-VWF (BD Pharminogen) and Alexa Fluor 488 conjugated goat antimouse IgG (Invitrogen) were used for immunofluorescence VWF studies. Phosphate buffered saline (PBS, pH 7.4), HEPES buffered saline (HBS, pH 7.2), and Tyrode’s buffer (pH 7.3) were made in-house.
Preparation of Collagen Surfaces.
Collagen preparations were performed on hydrophobic glass surfaces because these surfaces best promote rapid fiber polymerization.26 A few preparations were performed on clean glass as a comparison. Standard glass slides (25 mm × 75 mm, Fisher) or circular coverslips (22 mm, Fisher) were made hydrophobic by treatments with octadecyltrichlorosilane (OTS) according to established protocols.27 Briefly, slides were cleaned in solution of 1:1 methanol/hydrochloric acid (37 N) for 1 h, incubated in 1 mM OTS in anhydrous toluene for 45 min, rinsed and sonicated in toluene, and dried. AFM and X-ray photoelectron spectroscopy were used to verify the presence of a uniform 3–4 nm monolayer of OTS. Hydrophobic SPR sensor surfaces were prepared by stripping unfunctionalized gold sensor surfaces (GE Healthcare Lifesciences) with piranha solution (3:1 H2SO4/H2O2) for 1 h and then functionalizing with a 1-octadecane thiol monolayer according to an established protocol.28
Five different collagen surface preparations were included in these studies: collagen thin films (CTF) deposited at collagen solution concentrations of 10, 100, and 1000 μg/mL, monomeric collagen (MC), and insoluble collagen (IC). Table 1 lists the notation and experimental conditions of each of the five preparations. CTFs were obtained by neutralizing acid soluble collagen with 0.1 M NaOH and then dilution into 1× PBS, followed by incubation on OTS functionalized substrates for 1 h, rinsed five times in 1× PBS, rinsed thoroughly in deionized water, and quickly dried. We used compressed air to rapidly remove any water and dry the surface in less than one minute. MC and IC surfaces were obtained by dilution of acid-solubilized collagen or type I equine tendon insoluble collagen, respectively, into 5% glucose solution, pH 2.7, using identical surface incubation conditions. IC surfaces were used to draw comparisons to CTFs, as typical flow assays use type I equine tendon insoluble collagen to clean glass substrates at 100 μg/mL concentrations.29
Table 1.
Notation and Experimental Conditions of Collagen Surface Preparationsa
| notation | collagen | incubation concentration (μg/mL) | dilution buffer |
|---|---|---|---|
| CTF10 | Type I bovine, acid soluble | 10 | 1× PBS, pH 7.4 |
| CTF100 | Type I bovine, acid soluble | 100 | 1× PBS, pH 7.4 |
| CTF1000 | Type I bovine, acid soluble | 1000 | 1× PBS, pH 7.4 |
| MC | Type I bovine, acid soluble | 1000 | 5% glucose, pH 2.7 |
| IC | Type I equine, insoluble | 100, 250, 500 | 5% glucose, pH 2.7 |
All surfaces were incubated at room temperature for 1 h, rinsed in dilution buffer, and dried.
Characterization of Collagen Surfaces.
A Nanoscope III AFM was used to image dehydrated collagen thin films. Silicon cantilevers with reflective Al coating and a resonance frequency of 320 kHz and 42 N/m spring constant (TESPA probes, Veeco) were used in tapping mode. Scan areas were varied between 1 and 144 μm2. All images were captured at a scan rate between 1 and 2.5 Hz. Fiber thicknesses, surface roughness, and fiber surface area were analyzed with Veeco software. All images were normalized to account for sample tilt and baseline drift using the “Flatten” function in the Veeco software. Fiber thickness was determined by height profiles and measured for 25–50 fibers per image in three different areas on the film. A surface profilometer (Tencor P-10) was used to obtain film thicknesses of dehydrated collagen surfaces. Three to five separate preparations were used for each film thickness measurement. Stylus force was set at a minimum (1 mg) to minimize damage of collagen upon contact with the stylus tip. Collagen ligand density measurements were performed with SPR (BiaCore 3000 instrument). Alkane-thiol modified sensors were read in the SPR prior to thin film functionalization to determine background response units (RU) generated from each individual sensor in the BiaCore, and again measured after thin film deposition. An increase in 1000 RU corresponds to a 1 ng/mm2 ligand surface density,30 and each ligand was taken to be 310 kDa, the molecular weight of tropocollagen.31 Four separate measurements were taken for each thin film preparation.
Measurement of VWF Adsorption Kinetics to Collagen Surfaces.
The association and dissociation kinetics of VWF onto collagen thin films under flow was measured by SPR. All collagen-functionalized SPR surfaces were blocked with 5 mg/mL BSA for 45 min, loaded into the BiaCore instrument, and primed with degassed 1× PBS for 18 min to achieve a steady baseline signal. Serial dilutions of native plasma VWF were made in degassed 1× PBS to concentrations of 30, 40, 60, 120, and 240 nM, assuming VWF to be monomeric (Mr = 250 kDa), and the VWF solutions were perfused over the CTF substrates at a flow rate of 10 μL/min. This flow rate corresponds to a wall shear stress of 45 dyn/cm2 within the channel (inner channel dimensions: 20 μm × 500 μm × 2300 μm). Recombinant VWF solutions were diluted to 1 IU/mL in a 10 w/v % Ficoll (GE Biosciences) solution, allowing for a 5-fold increase in viscosity. Recombinant VWF solutions were then perfused over CTF substrates at a flow rate of 2 μL/min, corresponding to a wall shear stress of 45 dyn/cm2.
Analysis of association and dissociation rates was performed at each VWF concentration using BIAevaluation software version 4.1.1 to fit each kinetic curve. Prior to fitting, each curve was adjusted to account for baseline drift. Jumps in the signal associated with changes in buffer solutions were ignored in the analysis. Nonspecific binding of VWF to the surface was accounted for by running perfusions of VWF at each concentration over surfaces containing no collagen and then subtracting this signal from each perfusion plot in which collagen was present. Association and dissociation curves were fit separately using a 1:1 Langmuir binding model.
Blood Collection and Preparation of Washed Platelets.
Phlebotomy was conducted in accordance with the Declaration of Helsinki and under the University of Colorado, Boulder Institutional Review Board approval. Human blood was collected from healthy donors via venipuncture. Donors had not consumed alcohol within 48 h prior, nor had they taken any prescription or over-the-counter drugs within 10 days. For preparation of washed platelets, 40 mL of blood was drawn into sodium citrate and 1:10 v/v acid/citrate/dextrose (ACD) and centrifuged at 200 g for 20 min to obtain platelet rich plasma (PRP). To remove plasma components, 0.1 μg/mL prostacyclin was added to PRP followed by centrifugation at 1000 g for 10 min to obtain platelet pellets. Platelets were resuspended in Tyrode’s buffer with ACD and 0.1 μg/mL prostacyclin, centrifuged a second time, and finally resuspended in Tyrode’s buffer. Platelet counts were obtained with a hemocytometer. For use of whole blood in the microfluidic assay, the first 8 mL of blood was drawn into an empty vacutainer and discarded, the next 5 mL was drawn into vacutainers containing 75 mM of the thrombin inhibitor Phe-Pro-Arg-chloromethylketone (PPACK) (Haematologic Technologies, Inc.). A comparison of markers for platelet activation (P-selectin and PAC-1) by flow cytometry showed no difference between vacutainer and syringe withdrawal of blood (Supporting Information Table 1). The blood was then incubated for 10 min with a non-function-blocking antihuman CD41a–PE/Cy5 antibody (platelet labeling) in the absence or presence of abciximab (αIIbβ3 inhibitor), to a final concentration of 20 and 40 μg/mL, respectively.
Platelet Aggregometry.
Platelet aggregation was monitored in citrated whole blood using a Chrono-log whole blood aggregometer according to standardized protocols. Chrono-lume (Chrono-Log Corp., Havertown, PA, USA) was added to whole blood according to manufacturer’s instructions, to monitor ATP release due to platelet dense granule release. Platelet agonists included (1) acid-solubilized collagen after neutralization with 0.1 M NaOH and dilution to 1000 μg/mL in 1× PBS for 1 h to allow for bulk reconstitution of fibers [after 1 h, reconstituted fibers were further diluted to the desired concentrations (2 to 15 μg/mL) and used as an agonist], (2) monomeric collagen obtained by dilution of acid-solubilized collagen into glucose buffer (pH 2.7) to 15 μg/mL, and (3) Chono-log collagen (type I equine tendon insoluble collagen) diluted in glucose buffer (pH 2.7) to 5 μg/mL.
Static Platelet Adhesion to Collagen Surfaces.
OTS-modified 22-mm-diameter coverslips functionalized with CTFs were blocked with 5 mg/mL BSA for 1 h, followed by rinsing with 1× PBS. Washed platelets were diluted to 2 × 10⁷ platelets/mL in Tyrode’s buffer and incubated onto coverslips at 37 °C for 45 min. As a negative control, washed platelets treated with 20 μg/mL abciximab (αIIbβ3 inhibitor) were also incubated onto the CTFs, as αIIbβ3 integrin activation and signal transduction are required for platelet spreading.32 Surfaces were then rinsed in 1× PBS, fixed with 4% formaldehyde for 10 min, permeablized with 0.1% Triton-X 100 for 10 min, and stained with 0.1 μg/mL FITC-Phallodin overnight at 4 °C. Coverslips were imaged with a 60× oil objective with an inverted epifluorescence microscope (IX81, Olympus). Three separate experiments were performed for each condition.
Measurement of Platelet Adhesion Levels onto Collagen Surfaces.
Whole blood was perfused over collagen thin films at controlled wall shear rates through polydimethylsiloxane (PDMS) microfluidic devices. Each microfluidic device consisted of four channels (500 μm wide, 50 μm high) to allow for simultaneous perfusion of whole blood over four different collagen thin film preparations. PDMS microfluidic devices were fabricated using conventional soft lithography methods according to previous protocols.33 Prior to use, devices were cleaned with 1 N HCl, followed by sonication with acetone and ethanol, and then incubated in a 5 mg/mL BSA solution for 45 min to prevent nonspecific adsorption of blood components. Collagen solutions were incubated onto specific 7 mm × 7 mm regions of hydrophobic glass substrates using a multiwell incubation chamber (Cat# 10486001/10486081, Whatman Inc.). Following thin film deposition, the slide was removed from the incubation chamber and blocked in 5 mg/mL BSA solution for 45 min. Following thorough rinsing and drying of the slides, microfluidic devices were reversibly sealed to the slides using vacuum assisted bonding.8 A syringe pump (PHD 2000, Harvard Apparatus) was used with four 250 μL glass syringes (Hamilton) to pull fluid through the channels at a constant volumetric flow rate. Wall shear rate was related to volumetric flow rate through the following correlation:
| (1) |
| (2) |
where γwall is the wall shear rate, Q is the volumetric flow rate, A is the channel cross sectional area, f is the Fanning friction factor, Re is the Reynolds number, and ε is the channel aspect ratio (width/height). A schematic of the microfluidic setup is shown in Figure 1A.
Figure 1.
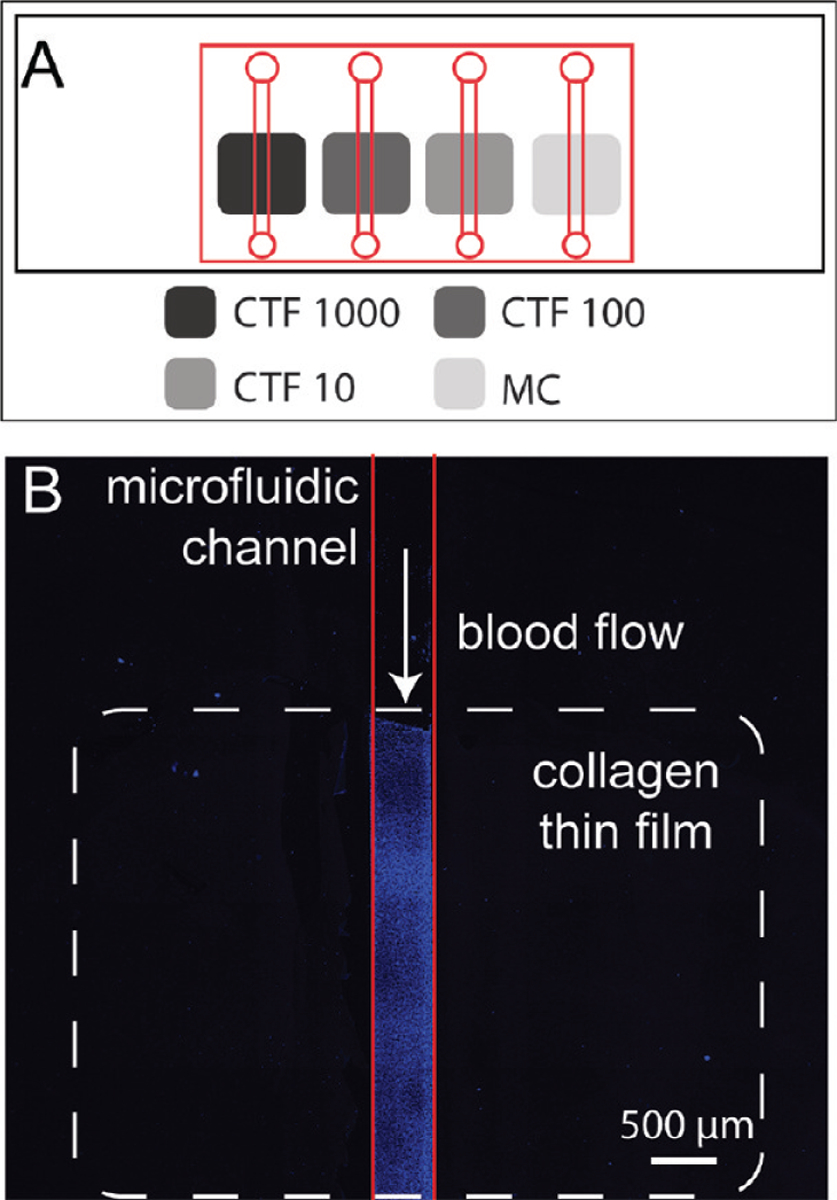
(A) Layout of microfluidic device (red lines) over substrates containing four patterned collagen preparations (gray boxes, see Table 1 for notation) on a glass slide (black rectangle). The device allows for simultaneous perfusions of plasma VWF or whole blood over each preparation. (B) Laser scanning confocal microscopy image of platelets (blue) adhered to CTF1000 (white dotted line) after a whole blood perfusion through a microfluidic device (red line).
Image Acquisition and Analysis.
Whole blood was perfused through each channel for 5 min, followed by a 2 min perfusion of HBS to remove the whole blood and then a 5 min perfusion of 2.5% gluteraldehyde in HBS for chemical fixation of platelets. The microfluidic devices were removed from the substrates and the surfaces were coverslipped using a 70% glycerol solution in water. Platelet accumulation on coverslipped slides was measured by confocal microscopy (Olympus Flouview FV1000) using a 647 nm laser excitation source (Figure 1B). Five separate areas (420 μm × 420 μm) positioned 1, 2, 3, 4, and 5 mm downstream of the edge of the collagen were imaged using 10× objective. Regions where whole blood contacted the surface upstream of the collagen films were also imaged to monitor for nonspecific platelet adhesion. Platelet surface coverage levels for each donor were calculated using a custom Matlab routine that thresholds each image using the triangle method.34
Statistical Analysis of Data.
CTF morphology measurements and platelet adhesion data are reported as the mean ± standard deviation from repeated measurements. Differences in platelet surface coverage between different collagen preparations was determined by the Mann–Whitney U-test with α = 0.01. Error in kinetic rate constants from SPR experiments is reported as standard error from nonlinear regression.
RESULTS
Surface Characterization of Collagen Thin Films on Microfluidic Substrates.
The following acronyms are used to refer to the five surfaces used in this study: CTF10, CTF100, and CTF1000 are collagen thin films (CTFs) grown from solutions of 10, 100, and 1000 μg/mL of type I bovine acid solubilized collagen at pH 7.4. MC is nonpolymerized or monomeric type I bovine acid solubilized collagen at pH 2.7; these substrates are used as a negative control for the role of supramolecular assembly of collagen fibers, which have been shown necessary to promote sufficient levels of platelet adhesion under flow.1,16 IC is insoluble type I equine collagen for comparison to a conventional flow assay substrate.
CTFs were grown and on hydrophobic glass substrates for 1 h at a pH of 7.4. These conditions promote rapid self-assembly of collagen fibers at the liquid–solid surface compared to bulk fiber formation and subsequent gelation.21,26,35 AFM images show a dense, homogeneous film of fibers at the length scale (∼1 μm) of a single platelet (Figure 2A). The surface consists of a dense bed of small fibers with diameters less than 30 nm. Larger fibers (200–250 nm diameter) reported in similar systems for polymerization times of 18 h remain largely absent on the surface due to the short polymerization time.22
Figure 2.
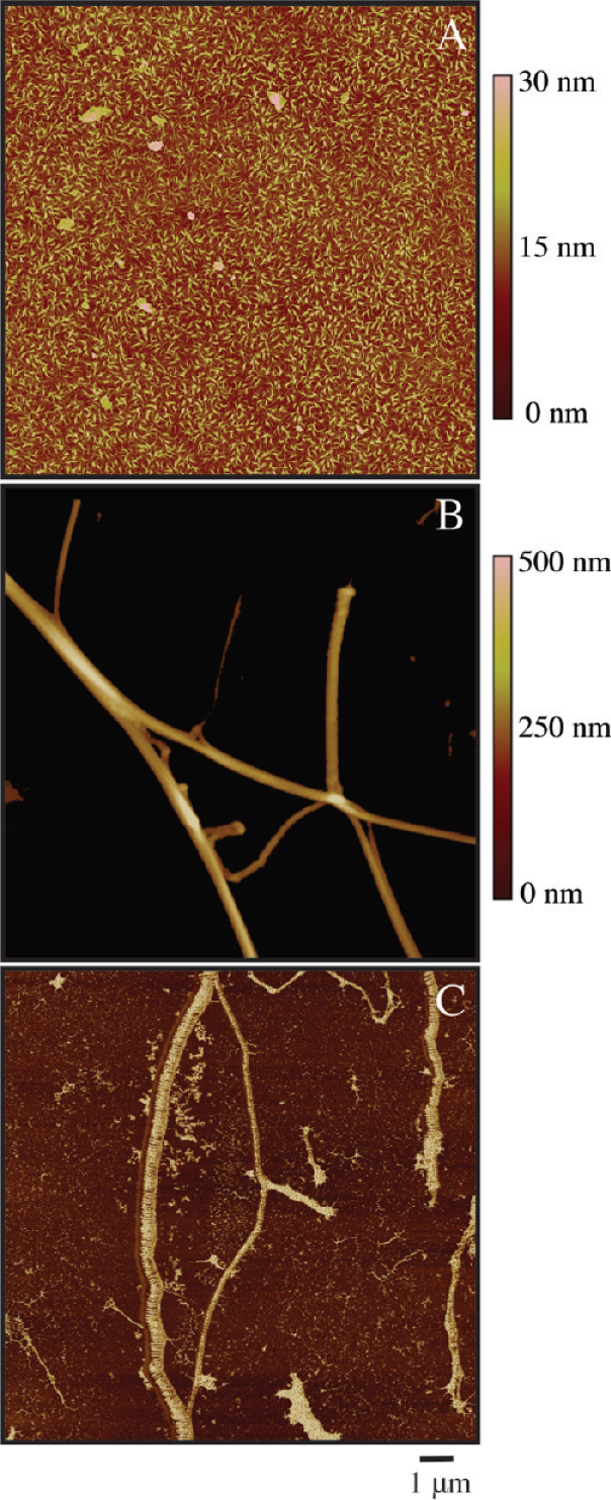
AFM images of (A) CTF 1000 substrate in tapping mode, (B) IC substrate in tapping mode, and (C) IC substrate in phase contrast mode. Surfaces were dried rapidly after deposition and washing and imaged in air.
For comparison to CTFs, IC substrates were used as a positive control because they are commonly used as an adhesive substrate for VWF binding and platelet adhesion flow assays.11,16,36,37 In contrast to CTFs, AFM images of IC substrates reveal a sparsely coated surface of discrete, banded fibers (Figure 2B). IC substrates coated with 100, 250, and 500 μg/mL IC solutions had varied and incomplete levels of fiber surface coverage across the area of the substrate (12 ± 7%, 18 ± 10%, and 64 ± 23%, respectively). Additionally, the surface appears heterogeneous at the micrometer length scale with respect to fiber diameter (260 ± 105 nm, n = 350 fibers) and surface coverage. A phase contrast image qualitatively shows the distribution in fiber sizes (Figure 2C).
The thin film properties of CTFs deposited onto surfaces at varied concentrations (10, 100, and 1000 μg/mL) were also measured. AFM images show that each CTF substrate yields a surface consisting of a bed of collagen ligands with fibrillar morphologies (Figure 3A,C,D). AFM images of MC substrates yield a surface of amorphous aggregates (∼50 nm) that lack a supramolecular fibrous structure, as expected since fibers do not self-assemble at low pH (Figure 3B). Table 2 summarizes the measured thin film properties of each preparation. Apparent in Table 2 is an increase in surface roughness, mean fiber diameter, and fiber surface area with concentration. Fiber surface area is reported from 2 μm × 2 μm AFM images identical to those displayed Figure 3. This parameter in particular is reflective of the available binding sites for VWF proteins and platelets in later studies. Film thickness and ligand densities for each preparation are also listed. It is important to note that film thickness and ligand density calculation include collagen fibers that are buried underneath the surface layer of fibers and thus inaccessible for binding in flow assays. As such, we use surface area as the primary descriptor of CTFs. Fiber properties are not reported for MC substrates since these surfaces consist only of aggregated collagen monomers. The density of collagen for MC substrates is diminished compared to its CTF counterparts due to the lack of fiber polymerization at low pH. It is also important to note that all CTF measurements in Table 2 were taken after dehydration, as this is required for substrate bonding to microfluidic devices. In similar systems, dehydration of thin films has caused increased fiber packing, resulting in a ∼60% decrease in film thickness and a ∼30% decrease in surface roughness.21,35,38
Figure 3.
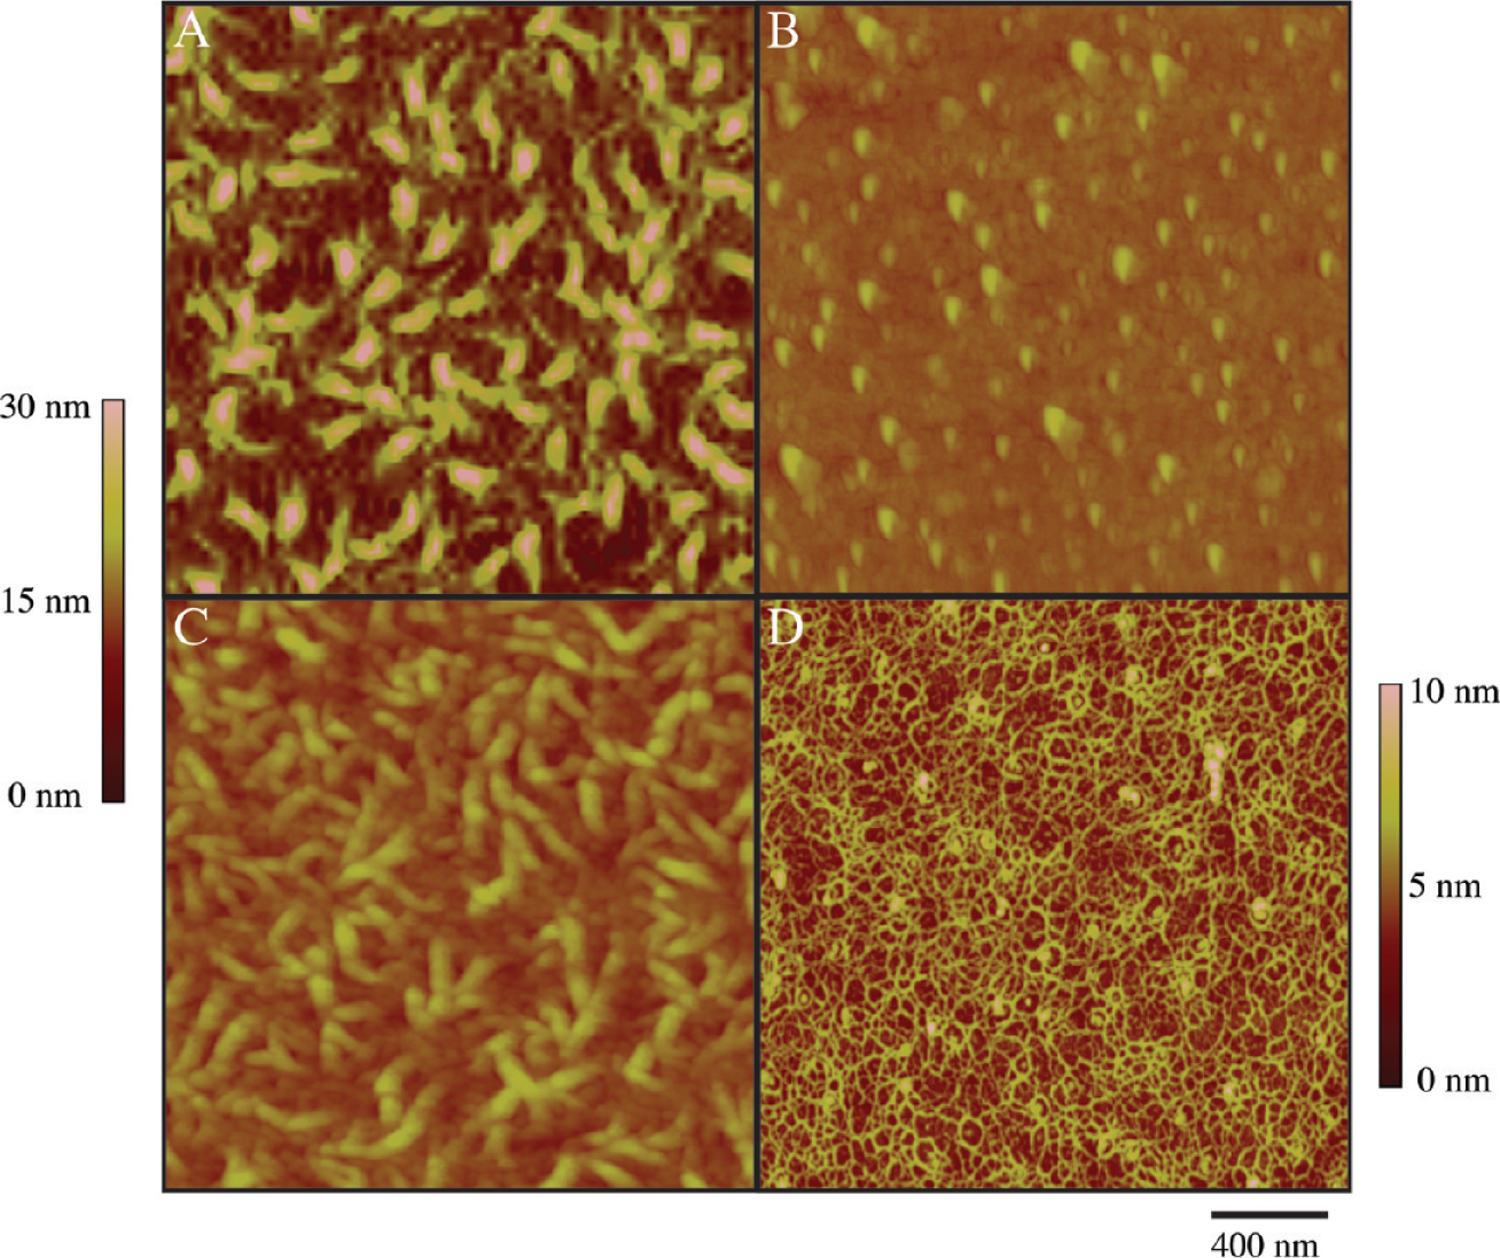
AFM images of collagen-functionalized substrates deposited on OTS-modified glass with a 1 h deposition time: (A) CTF1000 substrate, (B) MC substrate, (C) CTF100 substrate, and (D) CTF10 substrate. Scan sizes are 2 μm × 2 μm . Scale is adjusted to 0–10 nm in (D) for improved visualization of fibers of less than 10 nm.
Table 2.
Surface Characterizations of Collagen Thin Films Deposited onto Hydrophobic Substrates
| surface | mean roughness (nm) | mean fiber diameter (nm) | fiber surface area (nm2)a | film thickness (nm) | collagen density (ng/mm2) |
|---|---|---|---|---|---|
| CTF10 | 0.9 ± 0.1 | 3.9 ± 0.4 | 7600 ± 810 | 14 ± 2.4 | 4.2 ± 0.3 |
| CTF100 | 1.7 ± 0.1 | 7.6 ± 1.1 | 12400 ± 740 | 15 ± 6.6 | 4.0 ± 0.3 |
| CTF1000 | 2.8 ± 0.3 | 15.0 ± 2.0 | 42000 ± 10800 | 26 ± 7.7 | 7.1 ± 0.4 |
| MC | 1.6 ± 0.2 | - | - | - | 1.2 ± 0.1 |
Surface area of fibers contained from 2 μm × 2 μm AFM image.
CTF can be grown on clean hydrophilic glass as well. CTF grown from 100 μg/mL solutions on clean glass show a dense film of collagen with a fibrillar morphology (Supporting Information Figure 1). Fiber sizes were 4.2 ± 0.7 nm, which is 45% smaller in diameter compared to analogous CTF100 depositions on OTS substrates, an effect previously noted on hydrophilic surfaces.20
Plasma VWF Binding to Collagen Thin Films.
Prior to platelet adhesion at arterial shear stresses, VWF must be present on or bind to the subendothelial matrix. We measured the binding kinetics of plasma-derived VWF in buffer to each CTF and MC substrate listed in Table 1 at a wall shear rate of 5000 s−1 using SPR. Under these flow conditions, VWF has been demonstrated to be functionally active in hemostasis.39 As a control surface that accounts for nonspecific VWF adsorption to the surface, perfusion over BSA-passivated surfaces was also performed. VWF solutions were perfused at concentrations between 7.5 μg/mL and 60 μg/mL.
Figure 4A shows representative plots of VWF association and dissociation dynamics to each CTF and MC substrate at VWF plasma levels (10 μg/mL), and Table 3 displays the calculated association and disassociation rate constants and total VWF capture based on a 1:1 Langmuir model. This model has been widely used to fit plasma-derived VWF binding kinetics,30,40–42 and enabled us to achieve fits with low average squared residual values (χ2 < 15 in all cases). A two-bond model similar to that used by Li and colleagues30 gives similar trends in association rate constants as those in Table 3, but the model did not fit the data as well as the 1:1 Langmuir model as measured by the χ2 parameter. Association rate constants of VWF to CTF substrates were on the order of 104–105 M−1 s−1, significantly higher than reported values of 103 M−1 s−1 for VWF perfusion over insoluble type I bovine collagen.30 Dissociation rates for each preparation were on the order of 10−4 s−1, which is comparable to reported values for insoluble type I bovine fibrillar collagen.30 We could not detect any VWF binding to IC by SPR, possibly because insoluble collagens do not conformally adsorb to the surface, but rather protrude into the lumen 20–100 μm.29 One difference between our technique and the Li et al. study is that they covalently coupled the collagen to the SPR sensor, while we physically adsorbed the IC to a hydrophobic surface. Another VWF-collagen SPR study also found that measuring VWF binding to IC was not possible due to obstruction of the channel by collagen fibers.43 Immunofluorescence staining of CTF substrates after VWF perfusion revealed a VWF layer of ball-and-string morphology typical of VWF extension at this shear stress (Supporting Information Figure 2).44 No measurable VWF association was detected for collagen concentrations at 2 μg/mL or lower.
Figure 4.
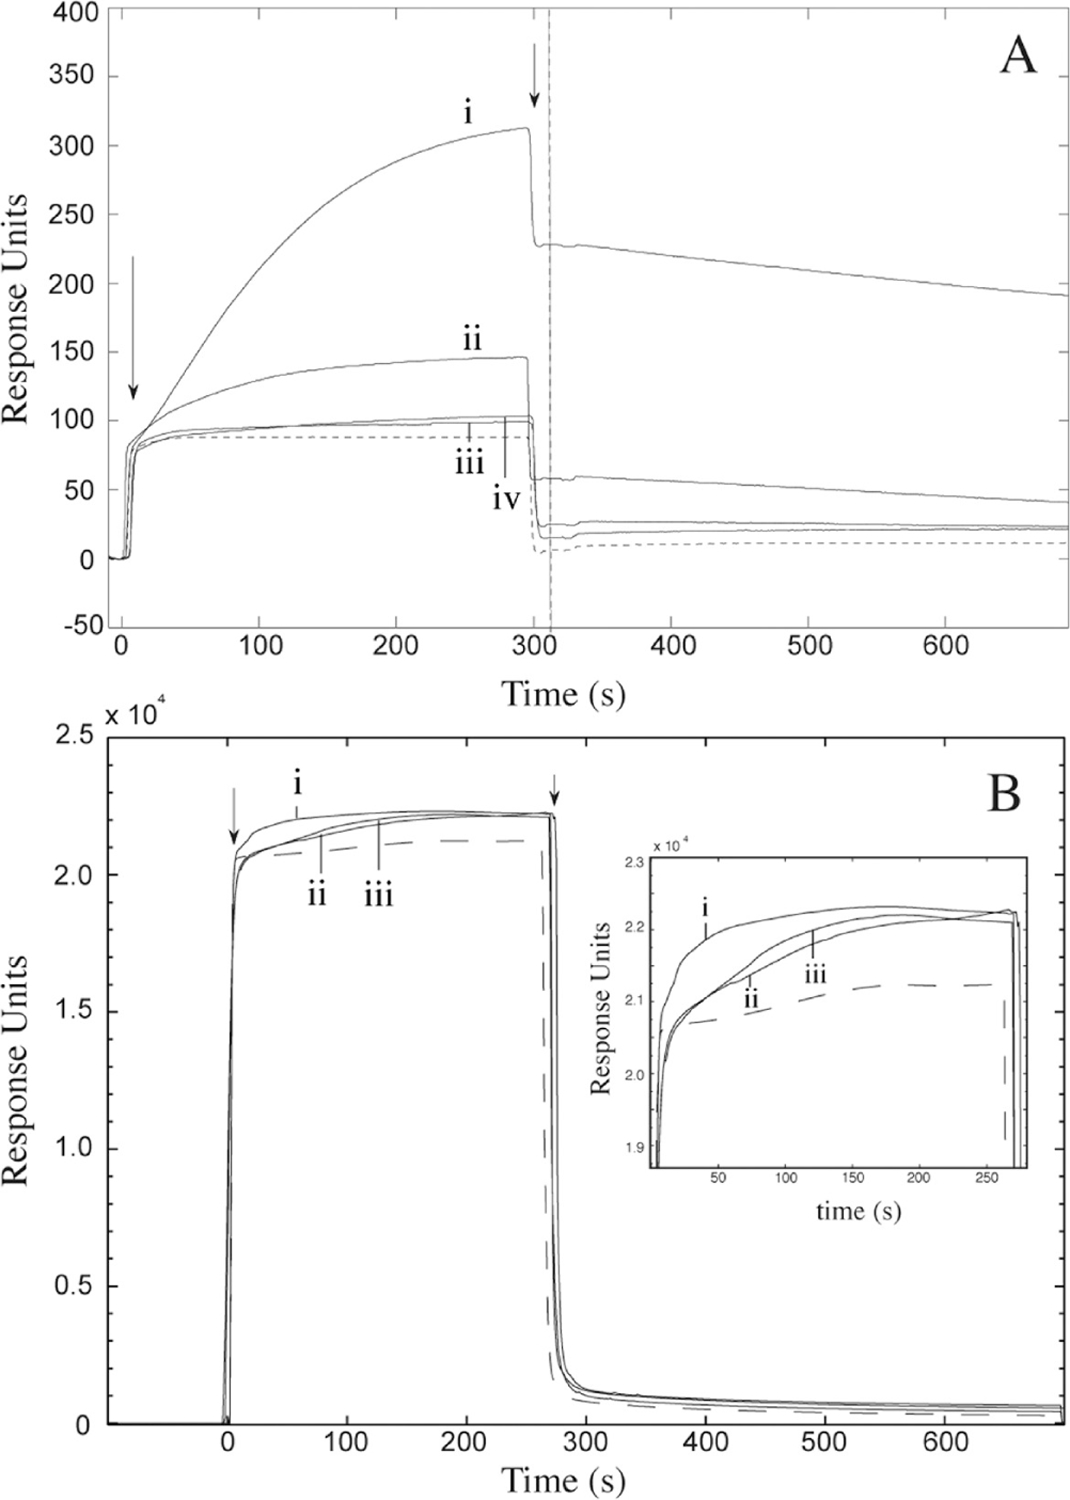
SPR analysis of VWF binding to collagen thin films. (A) 10 μg/mL plasma VWF binding with (i) CTF1000, (ii) CTF100, (iii) CTF10, and (iv) MC substrates. The negative control (dashed line) represents perfusion of VWF over unligated surfaces. The vertical line represents the end-point capture levels of VWF after 5 min perfusion for each preparation. (B) 10 μg/mL recombinant VWF binding with CTF1000 substrates. Recombinant VWF consisted of (i) wild type, (ii) Ser1731Thr mutant, and (iii) His1786Asp mutant. The negative control (dashed line) represents perfusion of cell culture media from a mock transfection containing no VWF. In both A and B, arrows represent the beginning and end of VWF perfusions. All surfaces were passivated with BSA after collagen depositions and all perfusions occurred for 5 min at a wall shear stress of 45 dyn/cm2.
Table 3.
SPR Analysis of 5000 s−1 VWF Perfusions over Collagen Thin Film Preparations
| surface type |
ka × 105 (M−1 s−1)a |
kd × 10−4 (s−1)a |
VWF capture levels (pg/mm2) b |
χ 2 |
|---|---|---|---|---|
| CTF10 | 0.3 ± 0.1 | 6.6 ± 2.0 | 23 ± 5 | 4.1 |
| CTF100 | 1.8 ± 0.6 | 2.0 ± 0.1 | 110 ± 16 | 0.8 |
| CTF1000 | 1.6 ± 0.3 | 2.8 ± 0.9 | 560 ± 42 | 13.1 |
| MC | 1.0 ± 0.2 | 7.3 ± 1.6 | 50 ± 4.5 | 0.1 |
ka/kd was measured by curve fitting using 1:1 Langmuir binding model after background subtraction of nonspecific VWF adsorption from binding curves.
Measured after 5 min perfusion of 10 μg/mL VWF.
Total VWF capture levels increased with increasing collagen solution concentrations. There was a 5-fold increase in VWF capture between CTF10 and CTF100 substrates, corresponding to the 60% increase in surface area from CTF10 to CTF100. Similarly, there was a 5-fold increase in VWF capture levels between CTF100 and CTF1000 substrates, corresponding to a 330% increase in surface area from CTF100 to CTF1000. This observation suggests that the increase in VWF association maybe due to the increase in the surface area of collagen ligands available for binding (Table 2). Initial binding rates were independent of VWF concentration, so it is unlikely that binding was transport limited even at high ligand densities.
VWF also appears to associate with MC substrates, although the association rate and VWF adsorption capacity are diminished compared to its CTF1000 counterpart. This observation is likely due to the lower collagen density because of the lack of fiber formation and to the fact that VWF may require a collagen fibrillar structure to optimally bind under flow.16
Detection of VWF-Collagen Binding Deficiencies on Collagen Thin Films.
To demonstrate the capacity of CTF substrates to discriminate against collagen-binding deficiencies in VWF, the binding kinetics of two recombinant VWF constructs, Ser1731Thr and His1786Asp, to CTF1000 substrates was monitored using SPR. Both constructs carry mutations in the A3 collagen-binding domain of VWF. In static collagen binding assays, Ser1731Thr constructs exhibit a 45% decrease in type I collagen binding affinity relative to wtVWF, while His1786Asp constructs exhibited <1% binding relative to wtVWF.25 Samples containing 10 μg/mL of recombinant wtVWF, Ser1731Thr, or His1786Asp constructs were perfused for5 min in the SPR at 45 dyn/cm2. As a negative control that accounts for nonspecific binding, cell media from a mock HEK293T transfection that contained no VWF was also perfused. Figure 4b shows the kinetics of VWF association and dissociation during perfusions from all samples. The magnitude of the resonance signal is higher in these mutant experiments (Figure 4B) compared to the plasma VWF (Figure 4A) because of the higher index of refraction of the cell media compared to PBS. The association and dissociation rates are summarized in Table 4. Relative to wtVWF, both Ser1731Thr and His1786Asp constructs show diminished association rates to the CTF substrate (ka,S1731T/ka,wt = 0.09, ka, H1786D/ka,wt = 0.22). The fact that His1786Asp constructs associate with the CTF substrates under flow but not in static assays is likely due to exposure of the A1 binding domain of VWF under critical shear stress, an effect that has been previously reported.25,40 These observations suggest that CTF preparations are sensitive to pathological collagen binding modifications in VWF, several of which are known to occur in qualitative defects of VWF such as VWD types 2A, 2B, and 2M.25,45,46
Table 4.
SPR Analysis Recombinant VWF Perfusions over CTF1000 at of 5000 s−1
| recombinant VWF | ka × 105 (M−1 s−1)a | kd × 10−4 (s−1)a | χ 2 |
|---|---|---|---|
| WT | 23.6 ± 0.6 | 9.32 ± 1.22 | 147 |
| S1713T | 2.1 ± 0.2 | 0.44 ± 0.06 | 75 |
| H1486D | 5.1 ± 0.1 | 0.15 ± 0.03 | 128 |
ka/kd was measured by curve fitting using 1:1 Langmuir binding model after background subtraction of nonspecific VWF adsorption from binding curves.
Platelet Aggregation and Spreading on Collagen Thin Films.
Platelet aggregometry was used to verify platelet activation by the collagen fibers present on CTF substrates. Aggregations were monitored in citrated whole blood using reconstituted collagen fibers as a platelet agonist. To prepare the agonist, type I bovine soluble collagen solutions were neutralized in 1× PBS for 1 h at 1000 μg/mL, allowing for fiber reconstitution to occur in bulk solution. These experimental conditions are identical to those used in CTF1000 substrate preparation. As a negative control, an acid-solublized collagen solution left in its monomeric form was also used as an agonist. This solution is identical to solutions used in MC substrate preparation. Finally, insoluble collagen used in IC substrates was used as a positive control agonist. Figure 5 shows the platelet aggregation response and the ATP generation due to dense granule release during platelet activation upon treatment with each agonist. Both plots show that platelets are activated and aggregate in a dose-dependent manner with the reconstituted fibers. Insoluble collagen induced a stronger response than the reconstituted fibers at equivalent concentrations. Collagen monomers were not capable of inducing aggregation due to their lack of a tertiary fibrillar structure required for engagement of platelet collagen receptors.47 These results verify the functionality of CTFs toward platelet activation, as CTF surfaces contain similar reconstituted fibers to those used as an agonist in this experiment.
Figure 5.
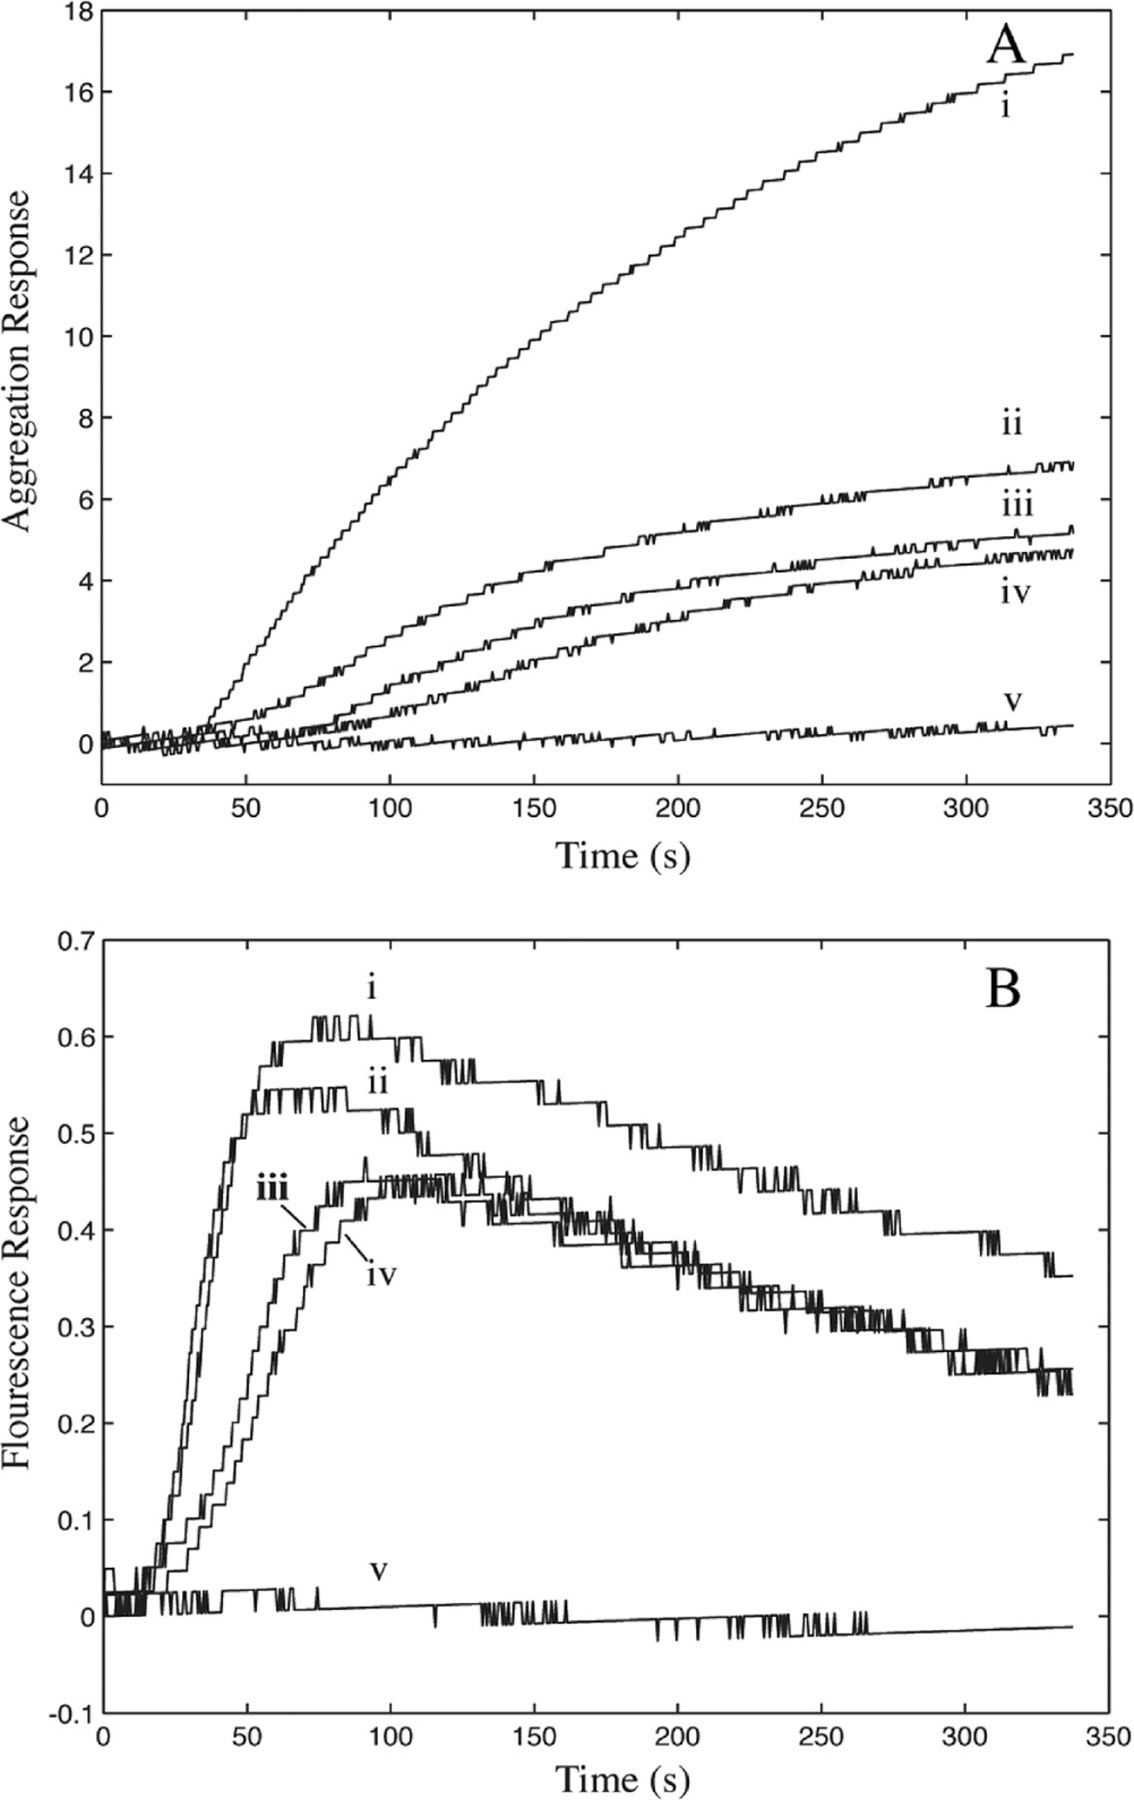
(A) Platelet aggregation and (B) platelet ATP release in citrated whole blood after addition of agonists: (i) 5 μg/mL fibrillar collagen, (ii) 15 μg/mL polymerized collagen, (iii) 5 μg/mL polymerized collagen, (iv) 2 μg/mL polymerized collagen, and (v) 15 μg/mL nonpolymerized collagen. Collagen solutions ii—iv were first polymerized for 1 h at 1000 μg/mL at room temperature, then diluted in 1× PBS to final concentration and added to whole blood.
To evaluate the ability of CTF substrates to support platelet adhesion and activation, washed platelets were statically incubated over each substrate in Table 1 for 45 min. Platelets have been shown to interact with collagen surfaces via GPVI and integrin α2β1. These receptors initiate platelet signaling downstream of collagen binding, eventually leading to activation of the integrin αIIbβ3. Sustained “outside-in” signaling via αIIbβ3 results in platelet spreading.48 As illustrated in Figure 6, platelet adhesion to and the degree of spreading on CTF surfaces was comparable to that observed on IC surfaces. Furthermore, inhibition of αIIbβ3 with abciximab abrogated platelet spreading on each surface. Minimal platelet adhesion was observed on control BSA surfaces. These results demonstrate the ability of CTF substrates to promote both platelet adhesion and activation under static conditions. The platelet adhesion and spreading observed on MC substrates are consistent with previous reports that collagen monomers support static, α2β1-mediated platelet adhesion and spreading.49,50
Figure 6.
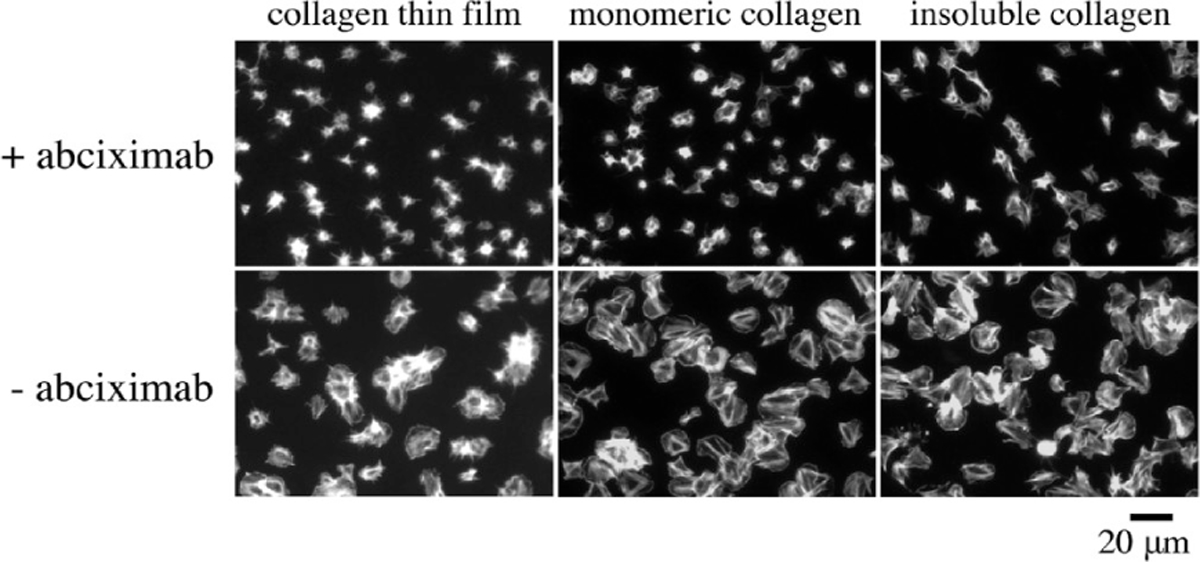
Representative images of platelet spreading on collagen surfaces. Washed human platelets (2 × 10⁷ mL) were incubated over each substrate for 45 min at 37 °C in the presence or absence of 20 μg/mL abciximab, fixed, permeabilized, and stained with phallodin-FITC.
Platelet Adhesion to Collagen Thin Films under Arterial Shear Stress.
The previous sections show that CTFs are a homogeneous substrate at the micrometer length scale and support VWF-collagen binding and platelet activation. In this section, we present data to show that CTFs can be used in flow assays (Figure 1) to support platelet adhesion under flow and to distinguish platelet adhesion between healthy controls and VWD patients. We measured platelet adhesion to CTF substrates following a 5 min perfusion at 1000 s−1 (32 dyn/cm2) for healthy donors and type 1 VWD patients. Experiments were performed at a shear stress that requires VWF for platelet adhesion to collagen. To isolate platelet adhesion from aggregation, we inhibited fibrinogen-mediated platelet–platelet binding with abciximab, an integrin αIIbβ3 antagonist. Whole blood perfusions over MC and IC substrates were performed as controls. Figure 7 shows representative end point images and surface coverage levels of platelets adhered to CTF1000 and IC substrates after whole blood perfusions from ten healthy donors (donors 1–10) and two type 1 VWD patients (donors 11–12) with plasma VWF levels of 3.83 μg/mL (donor 11) and 1.25 μg/mL (donor 12). A normal plasma VWF level is ∼10 μg/mL. There was a significant difference (p < 0.01) in platelet adhesion between CTF1000 and the other three substrates (CTF10, CTF100, and IC) among healthy donors. VWD patients had platelet surface coverages of 0.08 ± 0.05 (donor 11) and 0.24 ± (donor 12), which are almost 3 standard deviations outside the platelet surface coverage (0.74 ± 0.17) among the healthy donors. On IC substrates, platelets adhered directly to large (>100 nm) insoluble fibers and in the regions between fibers as well. However, there was a lack of discrimination between normal and VWD patients.
Figure 7.
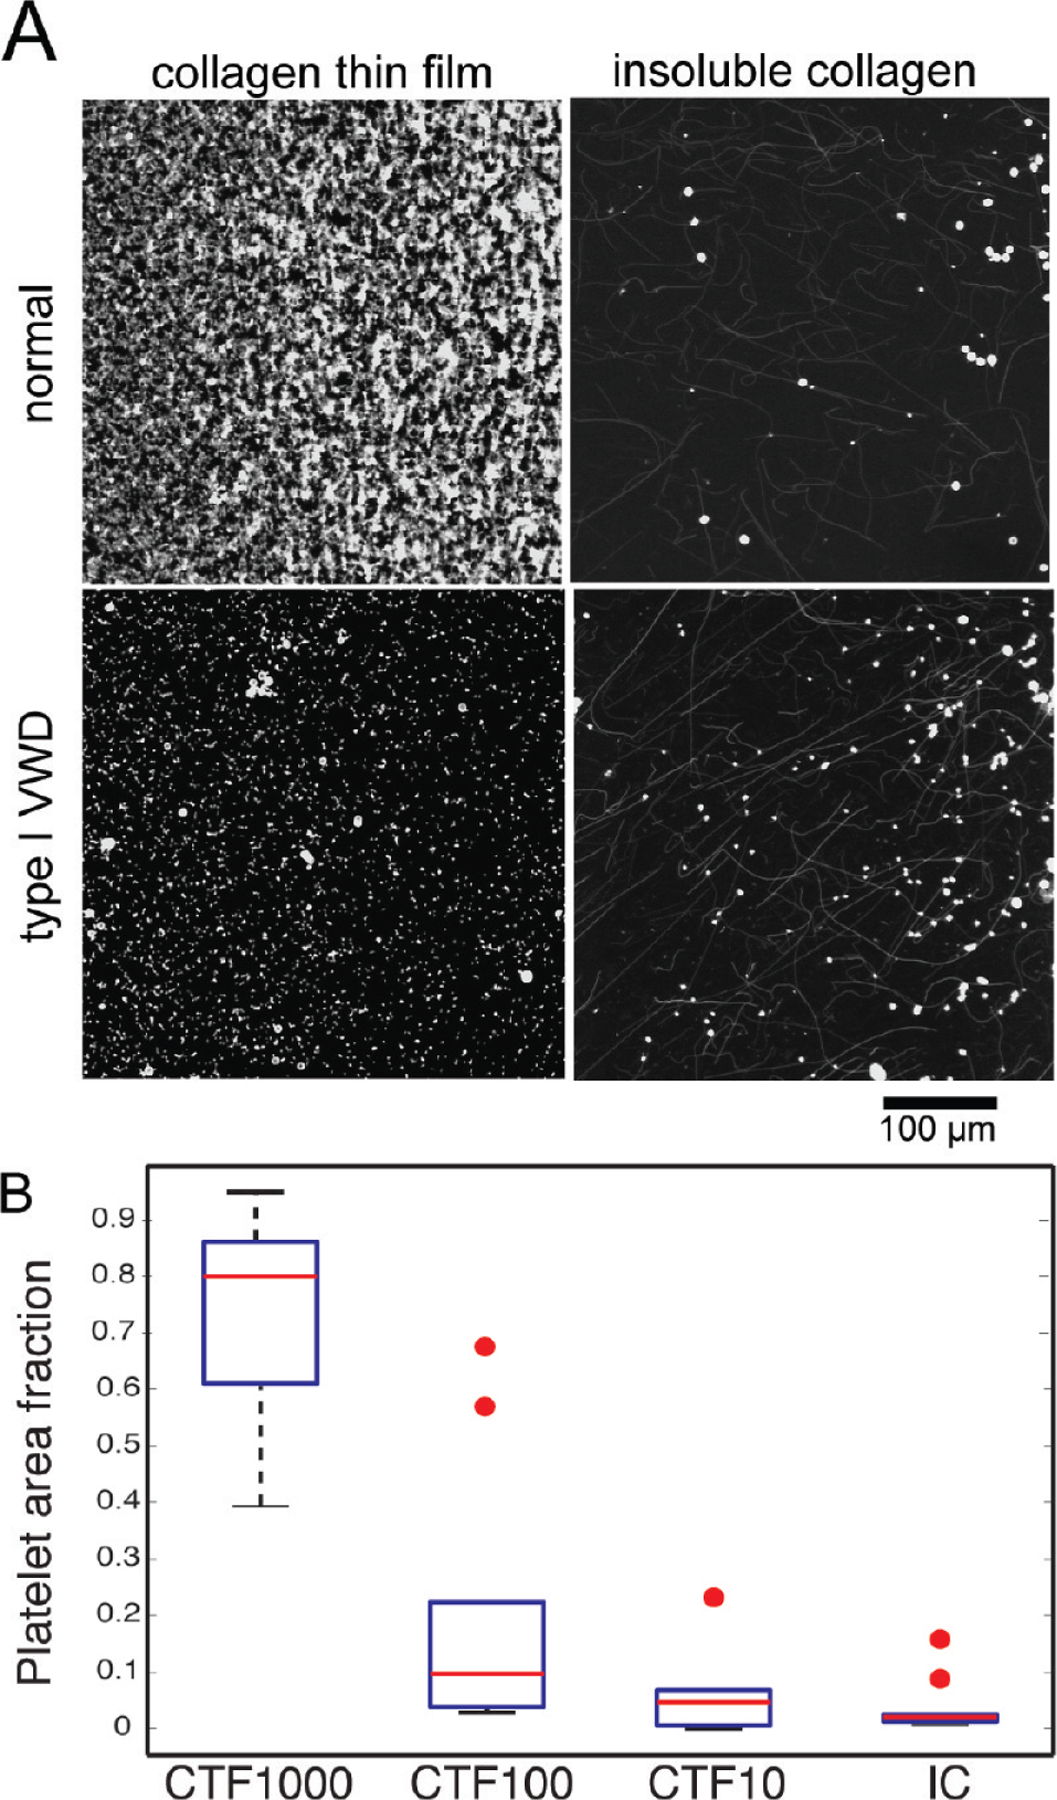
(A) Representative confocal microscope images of anti-CD41-Alexa Fluor 647 labeled platelets after 5 min of perfusion of whole blood taken from healthy donors or a type I VWD patient. Whole blood was perfused at a 1000 s−1 wall shear rate over CTF1000 or IC substrates . (B) Box plot of platelet area fraction on CTF1000, CTF100, CTF10, and IC for healthy donors (n = 10). Red circles represent outliers.
Table 5 gives a summary of fractional platelet surface coverage on all substrates. CTF100 and CTF10 substrates, which contained smaller fibers and lower surface areas, supported lower platelet surface coverage compared to CTF1000 substrates for each donor. Average fractional surface coverage on CTF100 and CTF10 across the ten healthy donors showed high levels of variance (0.20 ± 0.23 and 0.06 ± 0.07, respectively). Even if the outliers (Figure 7B) are ignored, the standard deviation in the data is comparable to the mean. MC substrates consistently showed fractional platelet coverage of less than 0.05 across healthy donors. This result verifies the requirement of collagen monomers to polymerize into a supramolecular structure for the formation of collagen epitopes specific to platelet integrin α2β1 (GFOGER) and glycoprotein VI (GPO) that allow for firm adhesion under flow.1,51,52 Although platelets can spread on MC substrates (Figure 6), MC substrates cannot support firm adhesion under flow, suggesting that the kinetics of binding to or signaling downstream of MC binding is slower than that for polymerized collagen.
Table 5.
Platelet Fractional Surface Coverage over Each Collagen Preparation Following 5 min Perfusions of Whole Blood at 1000 s−1
| donor | CTF 1000 |
CTF 100 |
CTF 10 |
MC | IC |
|---|---|---|---|---|---|
| 1a | 0.86 ± 0.04 | 0.68 ± 0.09 | 0.23 ± 0.05 | 0.03 ± 0.01 | -c |
| 2a | 0.81 ± 0.03 | 0.04 ± 0.006 | 0.03 ±0.007 | - | 0.01 ± 0.01 |
| 3a | 0.81 ± 0.08 | 0.03 ± 0.002 | 0.01 ± 0.003 | 0.03 ± 0.01 | 0.02 ± 0.01 |
| 4a | 0.51 ± 0.20 | 0.56 ± 0.12 | 0.06 ± 0.01 | 0.02 ± 0.01 | - |
| 5a | 0.79 ± 0.02 | 0.17 ± 0.04 | 0.06 ± 0.02 | - | 0.02 ± 0.02 |
| 6a | 0.39 ± 0.12 | 0.07 ± 0.04 | - | - | 0.02 ± 0.01 |
| 7a | 0.95 ± 0.03 | 0.22 ± 0.10 | 0.06 ± 0.03 | - | 0.16 ± 0.03 |
| 8a | 0.61 ± 0.06 | 0.03 ± 0.01 | 0.07 ± 0.03 | - | 0.02 ± 0.01 |
| 9a | 0.88 ± 0.05 | 0.12 ± 0.04 | - | - | 0.09 ± 0.04 |
| 10a | 0.77 ± 0.03 | 0.04 ± 0.02 | 0.02 ± 0.01 | - | 0.02 ± 0.01 |
| 11b | 0.08 ± 0.05 | 0.02 ±0.008 | - | - | 0.01 ± 0.01 |
| 12b | 0.24 ± 0.06 | 0.03 ± 0.006 | 0.03 ± 0.02 | - | 0.04 ± 0.03 |
Healthy donors.
Type I VWD patients.
Dash (−) means less than 0.01 fractional surface coverage.
DISCUSSION
The objective of this study was to characterize CTFs as substrates for measuring platelet recruitment under flow. The essential functions of collagen in thrombus formation are to bind VWF and act as an adhesive and signaling ligand for platelets. We found that CTFs can bind VWF at arterial shear stress and can distinguish between wild-type VWF and collagen binding-deficient VWF mutants. Platelet adhesion at arterial shear stress is also supported on CTFs in a surface ligand density-dependent manner. At high ligand densities, we observed diminished platelet adhesion with whole blood from VWD patients compared to healthy controls. These results suggest that CTF may be a good candidate substrate for diagnosing and quantifying platelet adhesion disorders.
The conventional collagen substrates for flow assays are types I and III insoluble native fibers from nonhuman sources. These insoluble collagens (IC) are potent platelet agonists that induce strong outside-in signaling through platelet collagen receptors. Reconstituted fibers from acid-solublized collagens, such as those used to make CTF substrates in this study, are not as strong of a platelet agonist.16,53 In aggregometry studies, we found that, at the same concentration (5 μg/mL), IC is approximately 50% more potent than CTF fibers in inducing platelet activation as measured by ATP release. Platelets adhered to and spread similarly on IC and CTF. These measurements suggest that CTF are capable of activating platelets, although perhaps not with the same potency of IC.
A direct comparison of surface-bound IC and CTF becomes more difficult because the surface density of fibers appears to be significantly different between the two preparations (Figure 2). The IC surfaces (Figure 2C) have both large fibers O(100 nm) and small fibers O(10 nm), and the relative density of these features varies between preparations. We observed that platelets adhere not only to large fibers that are optically visible, but also in the spaces between larger fibers, suggesting that these small fibers may promote platelet adhesion. Since the relative density of the large and small fibers varies between preparations in our hands, this makes this substrate nonideal for a clinical setting. In addition, there is evidence that IC contains significant amounts of endogenous VWF,18 which may block binding sites for human VWF during flow assays. Nevertheless, a comparison between platelet adhesion under flow on IC adsorbed from 100 μg/mL solutions and CTF grown from 100 μg/mL solutions (CTF100) shows inconsistent results. In five of the ten healthy donors, platelet surface coverage was more than 2-fold greater on CTF100 substrates. In the other five healthy donors and both VWD patients, the surface coverage levels were higher on CTF100 substrates, but the difference was statistically insignificant.
A distinct advantage of using the CTF preparation is the ability to tune the surface ligand density. This was demonstrated in both VWF and platelet adhesion studies. For VWF binding, data in Table 3 suggest that fiber surface area can be used to modulate the amount of VWF association. This feature may be particularly useful in further studies with samples from individuals with VWD. For example, some cases of type 2 VWD are characterized by decreases in high molecular weight multimers that are thought to play an essential role in VWF affinity to collagen.15 Such VWF mutants may not be detected by conventional, static clinical laboratory assays, but perhaps could be effectively identified by increasing the collagen surface area in a flow-based assay, adding sensitivity and specificity in characterizing the effect of these mutations on hemostatic function. In this report, we have demonstrated this strategy by using high surface area CTF1000 substrates to discriminate collagen-binding deficiencies in VWF.
Similarly for platelet adhesion studies, tuning the surface area was important to achieving reproducible results. The highest platelet adhesion and the lowest variability were observed on CTF1000. CTF1000 was the only surface without outliers (>2.7 standard deviations) among the healthy controls. More importantly for diagnostic applications, CTF1000 was the only surface on which platelet surface coverage levels were statistically different between healthy controls and VWD patients. It is not surprising that there is significant variation on CTFs and IC given the tremendous variability in hematocrit (0.35–0.50), platelet count (150 000–300 000/μL), VWF levels, and platelet collagen receptor expression between individuals. Plasma VWF levels and the density of the collagen receptor α2β1 correlate with platelet adhesion and aggregation on collagen.54–56 Our data suggest that some of this variability can be mitigated at high collagen densities in order to distinguish normal and VWD samples.
The relatively small fibers formed on hydrophilic substrates and CTF10 are similar to those seen in previous studies.38,57 It is possible that these fibers are not fibrillar at all given that the diameter of tropocollagen is 1.5 nm58 and the thickness of these fibers is ∼4 nm. This may explain why these substrates have different binding kinetics with VWF and lower platelet adhesion compared to CTF100 and CTF1000.
It is important to draw a distinction between the microfluidic channels used in this study and the larger and more widely used parallel plate flow assays. In parallel plate assays, the heterogeneity of adsorbed IC at the submicrometer scale may not be significant when averaged over a large area of ∼100 mm2. However, as the flow assay is scaled down to smaller microfluidic channels, the tolerance for heterogeneity in collagen fiber distribution decreases. In our experience with microfluidic flow assays using both human and murine blood, the heterogeneity in fiber size and density with IC adsorption confound data analysis.8 Regardless of channel size, there is growing appreciation for the need of a repeatable collagen substrate since there is already high variability in the endogenous properties of blood among individuals.10,17
An alternative strategy to reconstituted fibers that may lend itself to a microfluidic format is synthetic collagen related peptides. Pugh and colleagues showed that an ensemble of synthetic peptides can support platelet adhesion and aggregation over the range of physiological shear rates (100–3000 s−1).29 A critique of synthetic peptides, as well as the reconstituted fibers used in this study, is that they do not accurately represent the in vivo subendothelium, which is a milieu of extracellular matrix proteins and lipids. Mimicking the composition of the subendothelium may be important for investigating fundamental biological mechanisms, but for the development of a clinical assay, strict control over substrate properties is essential for eliminating additional confounding factors in the interpretation of the results.
CONCLUSIONS
There is an unmet need for a homogeneous, repeatable adhesive substrate for platelet adhesion flow assays, and considerable debate surrounds identifying the best candidate. In this report, we have demonstrated the utility and potential advantages of CTF substrates for application to platelet adhesion flow assays. This approach relies on the formation of reconstituted collagen fibers at the solid–liquid interface during thin film deposition. We have shown that the homogeneity in the resulting fiber size and surface coverage on a submicrometer scale compare favorably to traditional IC substrates, especially for applications in microfluidic formats. The functionality of CTF toward VWF and platelets during perfusions under high shear stresses found in the arterial system has been verified. Furthermore, we have demonstrated that thin film properties can be manipulated to influence the degree of VWF adsorption and platelet adhesion. In application of CTF implementation in a clinical diagnostic assay, we have shown that reproducible levels of platelet adhesion are achieved among normal donors when CTFs contain above a threshold collagen ligand density. Finally, CTF substrates are sensitive to dysfunctions in VWF-collagen binding and platelet–collagen adhesion that are characteristic of von Willebrand disease.
Supplementary Material
ACKNOWLEDGMENT
This work was supported by a Scientist Development Grant (K.B.N.) and a Postdoctoral Fellowship (R.R.H) from the American Heart Association, the National Heart, Lung, and Blood Institute (HL100333), the Colorado Office of Economic Development and International Trade, and the Boettcher Foundation’s Webb-Waring Biomedical Research Award. The authors would like to thank Dr. Veronica Flood of the BloodCenter of Wisconsin for providing recombinant VWF constructs and Megan Sumner for expert technical assistance during the platelet aggregometry studies.
Footnotes
ASSOCIATED CONTENT
Supporting Information. Additional figures of collagen thin films on clean glass and immunofluorescent images of VWF on collagen thin films. This material is available free of charge via the Internet at http://pubs.acs.org.
REFERENCES
- 1.Farndale RW; Sixma JJ; Barnes MJ; de Groot PG J. Thromb. Haemost 2004, 2, 561–73. [DOI] [PubMed] [Google Scholar]
- 2.Ginsburg D Haemophilia 1999, 5, 19–27. [DOI] [PubMed] [Google Scholar]
- 3.Sakariassen KS; Aarts PAMM; Degroot PG; Houdijk WPM; Sixma JJ J. Lab. Clin. Med 1983, 102, 522–535. [PubMed] [Google Scholar]
- 4.Turitto VT; Weiss HJ; Baumgartner HR J. Clin. Invest 1984, 74, 1730–41. [DOI] [PMC free article] [PubMed] [Google Scholar]
- 5.Fressinaud E; Sakariassen KS; Rothschild C; Baumgartner HR; Meyer D Blood 1992, 80, 988–994. [PubMed] [Google Scholar]
- 6.Usami S; Chen HH; Zhao YH; Chien S; Skalak R Ann. Biomed. Eng 1993, 21, 77–83. [DOI] [PubMed] [Google Scholar]
- 7.Barstad RM; Roald HE; Cui YW; Turitto VT;Sarariassen KS Arterioscler. Thromb 1994, 14, 1984–1991. [DOI] [PubMed] [Google Scholar]
- 8.Neeves KB; Maloney SF; Fong KP; Schmaier AA; Kahn ML; Brass LF; Diamond SL J. Thromb. Haemost 2008, 6, 2193–2201. [DOI] [PubMed] [Google Scholar]
- 9.Gutierrez E; Petrich BG; Shattil SJ; Ginsberg MH; Groisman A; Kasirer-Friede A Lab Chip 2008, 8, 1486. [DOI] [PMC free article] [PubMed] [Google Scholar]
- 10.Zwaginga JJ; Sakarjassen KS; King MR; Diacovo TG; Grabowski EF; Nash G; Hoylaerts M; Heemskerk JWM J. Thromb. Haemost 2007, 5, 2547–2549. [DOI] [PubMed] [Google Scholar]
- 11.Savage B; Almus-Jacobs F; Ruggeri ZM Cell 1998, 94, 657–66. [DOI] [PubMed] [Google Scholar]
- 12.White-Adams TC; Berny MA; Patel IA; Tucker EI; Gailani D; Gruber A; Mccarty OJT J. Thromb. Haemost 2010, 8, 1295–1301. [DOI] [PMC free article] [PubMed] [Google Scholar]
- 13.Kuijpers M; Schulte V; Bergmeier W; Lindhout T; Brakebusch C; Offermanns S; Fassler R; Heemskerk J; Nieswandt B FASEB J 2003, 17, 685–+. [DOI] [PubMed] [Google Scholar]
- 14.Sixma JJ; van Zanten GH; Huizinga EG; van der Plas RM; Verkley M; Wu YP; Gros P; de Groot PG Thromb. Haemost 1997, 78, 434–8. [PubMed] [Google Scholar]
- 15.Sadler J Annu. Rev. Biochem 1998, 67, 395–424. [DOI] [PubMed] [Google Scholar]
- 16.Savage B; Ginsberg M; Ruggeri Z Blood 1999, 94, 2704–2715. [PubMed] [Google Scholar]
- 17.Heemskerk JW; Sakariassen KS; Zwaginga JJ; Brass LF; Jackson SP J. Thromb. Haemost 2011. [DOI] [PubMed] [Google Scholar]
- 18.Bernardo A; Bergeron AL; Sun CW; Guchhait P; Cruz MA; López JA; Dong J-F J. Thromb. Haemost 2004, 2, 660–9. [DOI] [PubMed] [Google Scholar]
- 19.Dupont-Gillain C; Rouxhet P Langmuir 2001, 17, 7261–7266. [Google Scholar]
- 20.Elliott JT; Woodward JT; Umarji A; Mei Y; Tona A Biomaterials 2007, 28, 576–585. [DOI] [PubMed] [Google Scholar]
- 21.Dupont-Gillain C; Pamula E; Denis F; De Cupere V; Dufrene Y; Rouxhet P J. Mater. Sci.: Mater. Med 2004, 15, 347–353. [DOI] [PubMed] [Google Scholar]
- 22.Elliott JT; Tona A; Woodward JT; Jones PL; Plant AL Langmuir 2003, 19, 1506–1514. [Google Scholar]
- 23.Keresztes Z; Rouxhet PG; Remacle C; Dupont-Gillain C J. Biomed. Mater. Res. A 2006, 76, 223–33. [DOI] [PubMed] [Google Scholar]
- 24.Langenbach KJ; Elliott JT; Tona A; McDaniel D; Plant AL BMC Biotechnol 2006, 6, 14. [DOI] [PMC free article] [PubMed] [Google Scholar]
- 25.Flood VH; Lederman CA; Wren JS; Christopherson PA; Friedman KD; Hoffmann RG; Montgomery RR J. Thromb. Haemost 2010, 8, 1431–1433. [DOI] [PMC free article] [PubMed] [Google Scholar]
- 26.Gurdak E; Rouxhet P; Dupont-Gillain C Colloid Surf., B 2006, 52, 76–88. [DOI] [PubMed] [Google Scholar]
- 27.Wasserman S; Tao Y; Whitesides G Langmuir 1989, 5, 1074–1087. [Google Scholar]
- 28.Jeenanong A; Kawaguchi H Colloid Surf., A 2007, 302, 403–410. [Google Scholar]
- 29.Pugh N; Simpson AMC; Smethurst PA; de Groot PG; Raynal N; Farndale RW Blood 2010, 115, 5069–5079. [DOI] [PMC free article] [PubMed] [Google Scholar]
- 30.Li F; Moake J; McIntire L Ann. Biomed. Eng 2002, 30, 1107–1116. [DOI] [PubMed] [Google Scholar]
- 31.Rice RV; Casassa EF; Kerwin RE; Maser MD Arch. Biochem. Biophys 1964, 105, 409–23. [DOI] [PubMed] [Google Scholar]
- 32.McCarty OJT; Zhao Y; Andrew N; Machesky LM; Staunton D; Frampton J; Watson SP J. Thromb. Haemost 2004, 2, 1823–1833. [DOI] [PubMed] [Google Scholar]
- 33.McDonald JC; Duffy DC; Anderson JR; Chiu DT; Wu H; Schueller OJ; Whitesides GM Electrophoresis 2000, 21, 27–40. [DOI] [PubMed] [Google Scholar]
- 34.Zack GW; Rogers WE; Latt SA J. Histochem. Cytochem 1977, 25, 741–53. [DOI] [PubMed] [Google Scholar]
- 35.Jacquemart I; Pamua E; De Cupere V; Rouxhet P; Dupont-Gillain C J. Colloid Interface Sci 2004, 278, 63–70. [DOI] [PubMed] [Google Scholar]
- 36.Pareti FI; Niiya K; McPherson JM; Ruggeri ZM J. Biol. Chem 1987, 262, 13835–41. [PubMed] [Google Scholar]
- 37.Auger J; Kuijpers M; Senis Y; Watson S; Heemskerk J FASEB J 2005, 19, 825–+. [DOI] [PubMed] [Google Scholar]
- 38.Chung K-H; Bhadriraju K; Spurlin TA; Cook RF; Plant AL Langmuir 2010, 26, 3629–3636. [DOI] [PubMed] [Google Scholar]
- 39.Schneider SW; Nuschele S; Wixforth A; Gorzelanny C; Alexander-Katz A; Netz RR; Schneider MF Proc. Natl. Acad. Sci. U. S. A 2007, 104, 7899–903. [DOI] [PMC free article] [PubMed] [Google Scholar]
- 40.Bonnefoy A; Romijn RA; Vandervoort PAH; VAN Rompaey I; Vermylen J; Hoylaerts MF J. Thromb. Haemost 2006, 4, 2151–61. [DOI] [PubMed] [Google Scholar]
- 41.Romijn RA; Westein E; Bouma B; Schiphorst ME; Sixma JJ; Lenting PJ; Huizinga EG J. Biol. Chem 2003, 278, 15035–15039. [DOI] [PubMed] [Google Scholar]
- 42.Serrano SMT; Jia LG; Wang DY; Shannon JD; Fox JW Biochem. J 2005, 391, 69–76. [DOI] [PMC free article] [PubMed] [Google Scholar]
- 43.Romijn RA; Westein E; Bouma B; Schiphorst ME; Sixma JJ; Lenting PJ; Huizinga EG J. Biol. Chem 2003, 278, 15035–9. [DOI] [PubMed] [Google Scholar]
- 44.Siedlecki CA; Lestini BJ; Kottke-Marchant KK; Eppell SJ; Wilson DL; Marchant RE Blood 1996, 88, 2939–50. [PubMed] [Google Scholar]
- 45.Ribba AS; Loisel I; Lavergne JM; Juhan-Vague I; Obert B; Cherel G; Meyer D; Girma JP Thromb. Haemost 2001, 86, 848–854. [PubMed] [Google Scholar]
- 46.Baronciani L; Federici AB; Beretta M; Cozzi G; Canciani MT; Mannucci PM J. Thromb. Haemost 2005, 3, 2689–2694. [DOI] [PubMed] [Google Scholar]
- 47.Farndale RW Blood Cell Mol. Dis 2006, 36, 162–165. [DOI] [PubMed] [Google Scholar]
- 48.Shattil SJ; Kashiwagi H; Pampori N Blood 1998, 91, 2645–2657. [PubMed] [Google Scholar]
- 49.Morton LF; Peachey AR; Zijenah LS; Goodall AH; Humphries MJ; Barnes MJ Biochem. J 1994, 299, 791–797. [DOI] [PMC free article] [PubMed] [Google Scholar]
- 50.White TC; Berny MA; Robinson DK; Yin H; DeGrado WF; Hanson SR; McCarty OJT FEBS J 2007, 274, 1481–1491. [DOI] [PubMed] [Google Scholar]
- 51.O’Connor MN; Smethurst PA; Davies LW; Joutsi-Korhonen L; Onley DJ; Herr AB; Farndale RW; Ouwehand WH J. Biol. Chem 2006, 281, 33505–33510. [DOI] [PubMed] [Google Scholar]
- 52.Polanowska-Grabowska R Arteriosclerosis, Thrombosis, Vascular Biology 2003, 23, 1934–1940. [DOI] [PubMed] [Google Scholar]
- 53.Houdijk WP; Sakariassen KS; Nievelstein PF; Sixma JJ J. Clin. Invest 1985, 75, 531–40. [DOI] [PMC free article] [PubMed] [Google Scholar]
- 54.Kritzik M; Savage B; Nugent DJ; Santoso S; Ruggeri ZM; Kunicki TJ Blood 1998, 92, 2382–8. [PubMed] [Google Scholar]
- 55.Di Paola J; Federici AB; Mannucci PM; Canciani MT; Kritzik M; Kunicki TJ; Nugent D Blood 1999, 93, 3578–82. [PubMed] [Google Scholar]
- 56.Roest M; Sixma JJ; Wu YP; Ijsseldijk MJ; Tempelman M; Slootweg PJ; de Groot PG; van Zanten GH Blood 2000, 96, 1433–7. [PubMed] [Google Scholar]
- 57.Gale M; Pollanen MS; Markiewicz P; Goh MC Biophys. J 1995, 68, 2124–8. [DOI] [PMC free article] [PubMed] [Google Scholar]
- 58.Fraser RD; MacRae TP; Suzuki E J. Mol. Biol 1979, 129, 463–81. [DOI] [PubMed] [Google Scholar]
Associated Data
This section collects any data citations, data availability statements, or supplementary materials included in this article.