

Abstract
Objective:
Delays in care for patients with acute cardiac complaints are associated with increased morbidity and mortality. The objective of this study was to quantify rural and urban differences in prehospital time intervals for patients with cardiac complaints.
Methods:
The ESO Data Collaborative dataset consisting of records from 1332 EMS agencies was queried for 9–1–1 encounters with acute cardiac problems among adults (age ≥ 18) from 1/1/2013–6/1/2018. Location was classified as rural or urban using the 2010 United States Census. The primary outcome was total prehospital time. Generalized estimating equations evaluated differences in the average times between rural and urban encounters while controlling for age, sex, race, transport mode, loaded mileage, and patient stability.
Results:
Among 428,054 encounters, the median age was 62 (IQR 50–75) years with 50.7% female, 75.3% white, and 10.3% rural. The median total prehospital, response, scene, and transport times were 37.0 (IQR 29.0–48.0), 6.0 (IQR 4.0–9.0), 16.0 (IQR 12.0–21.0), and 13.0 (IQR 8.0–21.0) minutes. Rural patients had an average total prehospital time that was 16.76 min (95%CI 15.15–18.38) longer than urban patients. After adjusting for covariates, average total time was 5.08 (95%CI 4.37–5.78) minutes longer for rural patients. Average response and transport time were 4.36 (95%CI 3.83–4.89) and 0.62 (95%CI 0.33–0.90) minutes longer for rural patients. Scene time was similar in rural and urban patients (0.09 min, 95%CI −0.15–0.33).
Conclusion:
Rural patients with acute cardiac complaints experienced longer prehospital time than urban patients, even after accounting for other key variables, such as loaded mileage.
Keywords: Emergency medical services (EMS), Prehospital, Chest pain, Acute coronary syndrome, Rural, Urban, Disparity
1. Introduction
1.1. Background
Acute cardiac problems such as acute coronary syndrome (ACS) account for nearly 10% of all emergency medical services (EMS) encounters [1,2]. Furthermore, emergency departments (ED) in the United States (US) care for between 8 and 10 million patients with acute cardiac complaints annually, with almost half of these patients arriving by EMS [3–5].
1.2. Importance
There is a paucity of data examining total prehospital, response, scene, and transport times for patients with acute cardiac complaints in rural and urban settings. Studies evaluating patients with ST-elevation myocardial infarction (STEMI) suggest that almost half of rural EMS STEMI patients do not meet guideline-based time goals [6–8]. It is unclear if a prehospital time disparity exists for patients with acute cardiac complaints. In 2020, the American Heart Association underscored the importance of mitigating cardiovascular rural health disparities. Quantifying differences in prehospital times for patients in rural vs. urban settings is a first step in reducing these disparities.
1.3. Goals of this investigation
We hypothesized that rural patients with acute cardiac complaints would have prolonged prehospital times compared to their urban counterparts. Therefore, the primary objective was to determine if total prehospital, response, scene, and transport time differed between rural and urban patients. A secondary objective was to assess for associations between age, sex, race, transport mode, and loaded mileage with each time interval.
2. Methods
2.1. Study design
A national retrospective cross-sectional study of US EMS encounters from 1332 EMS agencies using the ESO Data Collaborative (Austin, TX) was conducted for 9–1–1 calls with an impression, chief complaint, or supporting documentation of an acute cardiac problem among adult patients (age ≥ 18) from January 1st, 2013 to June 1st, 2018. Keywords used to identify an acute cardiac complaint included “chest pain,” “heart problem,” “chest discomfort,” “heart failure,” “myocardial infarction,” “STEMI,” “NSTEMI,” “chest pressure,” and “arrythmia.” ESO provides prehospital electronic health records (EHR) and generates a deidentified public-use dataset. The Wake Forest University Health Sciences Institutional Review Board deemed this investigation exempt. The Strengthening the Reporting of Observational Studies in Epidemiology (STROBE) guidelines helped direct the research process [9].
2.2. Study setting and population
Both advanced and basic life support agencies were included. Only patients transported from the scene to a hospital by ground ambulance were included. Encounters with patients who presented in or went into cardiac arrest while in the care of EMS were excluded.
Encounter location was classified as rural or urban by matching the encounter zip code to the US Census Bureau's 2010 census. The US Census Bureau defines an Urbanized Area (UA) as an area of at least 50,000 people, an Urbanized Cluster (UC) as an area of at least 2500 people but less than 50,000, and a Rural Area as all areas that are not UAs or UCs [10]. Urban was defined as the composite of a UA or a UC. A patient was considered unstable if systolic blood pressure was <90 mmHg, the heart rate was >120 or < 40 beats per minute, or pulse oximetry was <90% [11]. Ethnicity was not routinely captured separately from race. Therefore, race was collapsed into a four-level variable (White, Hispanic or Latino, Black, and Other). EMS transport mode was defined as emergent (lights and siren) or non-emergent (no lights or siren). Loaded mileage was defined as the distance traveled from the scene to the hospital.
2.3. Outcomes
The primary outcome was total prehospital time, defined as the time from EMS dispatch to hospital arrival. Secondary outcomes included response time (dispatch to scene arrival), scene time (scene arrival to depart scene), and transport time (depart scene to hospital arrival). These time points were recorded in the ESO EHR and then typically validated by each local prehospital agency.
2.4. Statistical analysis
Descriptive statistics were used to characterize the population. The unit of analysis was the EMS encounter. Age, sex, race, location, stability, and transport mode were treated as categorical variables and reported as frequencies and percentages. Total prehospital time, response time, scene time, transport time, and loaded mileage were treated as continuous variables and reported as medians and interquartile ranges (IQR). A complete case analysis was performed under the assumption that data were missing completely at random (MCAR). Encounters with a missing time interval were excluded. Extreme outliers were excluded and defined as a response time of 0 or > 60 min, scene time of 0 or > 120 min, transport time of 0 or > 180 min, transport distance of 0 miles, rural encounters with a loaded mileage <0.5 miles, calculated transport speed >100 miles per hour (MPH), and those with a loaded mileage >25 miles with a transport speed <5 MPH. Encounters with missing covariates (sex, race, rurality, or instability) were also excluded.
Generalized estimating equations (using the normal distribution with identity link and assuming an exchangeable correlation structure) evaluated differences in average total prehospital time, response time, scene time, and transport time while controlling for age, sex, race, location, transport mode, loaded mileage, and patient stability while accounting for clustering of patients within EMS agencies. The Quasilikelihood under the Independence model Criterion (QIC) was used to select the covariance structure and Zeng's marginal R2 statistic was calculated to evaluate model fit [12,13]. Parameter estimates with 95% confidence intervals (95%CI) were determined.
3. Results
3.1. Characteristics of study subjects
There were 774,174 acute cardiac prehospital encounters. Of these, 514,642 met the inclusion criteria and 428,054 were included in the analysis after exclusions (Fig. 1). The population had a median age of 62 years (IQR 50–75) years and was 50.7% female, 75.3% white race, and 10.3% rural. The median total prehospital, response, scene, and transport times were 37.0 (IQR 29.0–48.0), 6.0 (IQR 4.0–9.0), 16.0 (IQR 12.0–21.0), and 13.0 (IQR 8.0–21.0) minutes. Table 1 provides demographic information and Table 2 provides time interval findings. Fig. 2 graphically presents the time intervals and the rural and urban time interval medians.
Fig. 1.
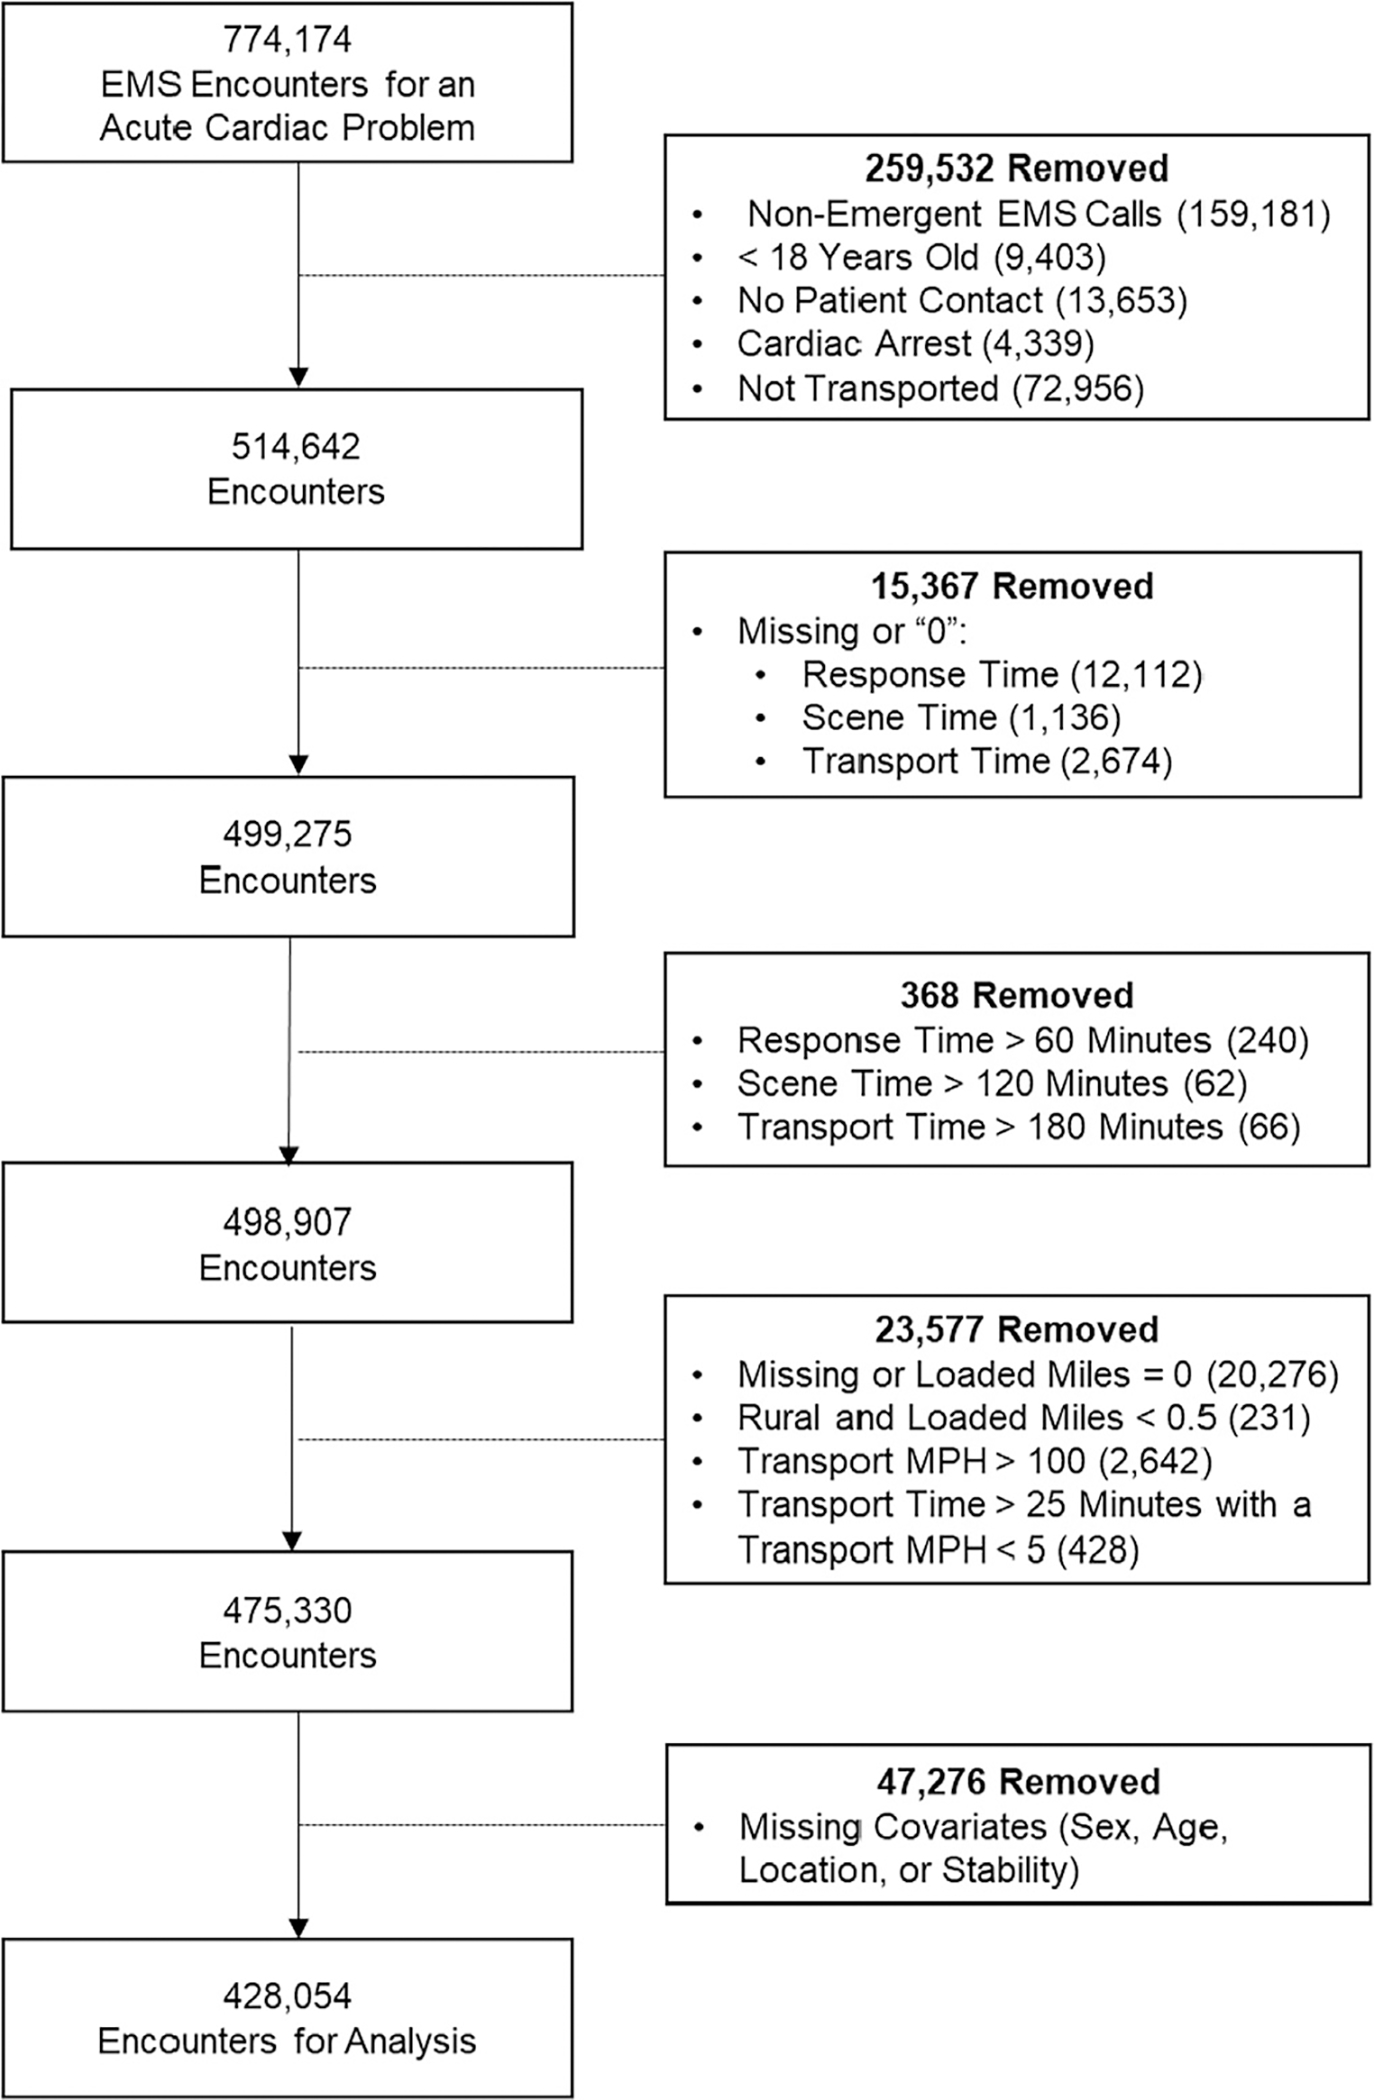
Case-selection flow diagram.
Table 1.
Demographics of the overall study population. Reported as median (IQR) or N(%)
| Variable | Rural N = 44,176 (10.3%) |
Urban N = 383,878 (89.7%) |
Total N = 428,054 |
|---|---|---|---|
|
| |||
| Age (continuous) | 62 (50–75) | 62 (50–75) | 62 (50–75) |
| Age (categorical) | |||
| 18–44 | 7039 (15.9%) | 64,962 (16.9%) | 72,001 (16.8%) |
| 45–64 | 17,200 (38.9%) | 146,285 (38.1%) | 163,485 (38.2%) |
| 65+ | 19,937 (45.1%) | 172,631 (45.0%) | 192,568 (45.0%) |
| Sex | |||
| Female | 21,807 (49.4%) | 195,092 (50.8%) | 216,899 (50.7%) |
| Race/Ethnicity | |||
| White | 39,094 (88.5%) | 283,243 (73.8%) | 322,337 (75.3%) |
| Black or African American | 4048 (9.2%) | 75,536 (19.7%) | 79,584 (18.6%) |
| Hispanic or Latino | 857 (1.9%) | 20,444 (5.3%) | 21,301 (5.0%) |
| Other | 177 (0.4%) | 4655 (1.2%) | 4832 (1.1%) |
| Transport Mode | |||
| Lights/Siren | 12,217 (27.7%) | 77,749 (20.3%) | 89,966 (21.0%) |
| Unstable | |||
| Yes | 14,390 (32.6%) | 129,474 (33.7%) | 143,864 (33.6%) |
| Loaded Mileage | 20.8 (14.0–29.7) | 5.5 (2.9–10.5) | 6.2 (3.0–12.8) |
IQR – interquartile range.
Table 2.
Time interval descriptive statistics
| Time (min) | Rural Median (IQR) | Urban Median (IQR) | Total Median (IQR) |
|---|---|---|---|
|
| |||
| Total Prehospital Time | 55.0 (44.0–68.0) | 35.0 (28.0–45.0) | 37.0 (29.0–48.0) |
| Response Time | 10.0 (5.0–16.0) | 5.0 (4.0–8.0) | 6.0 (4.0–9.0) |
| Scene Time | 16.0 (12.0–21.0) | 16.0 (12.0–21.0) | 16.0 (12.0–21.0) |
| Transport Time | 27.0 (19.0–36.0) | 12.0 (8.0–18.0) | 13.0 (8.0–21.0) |
IQR – interquartile range.
Fig. 2.
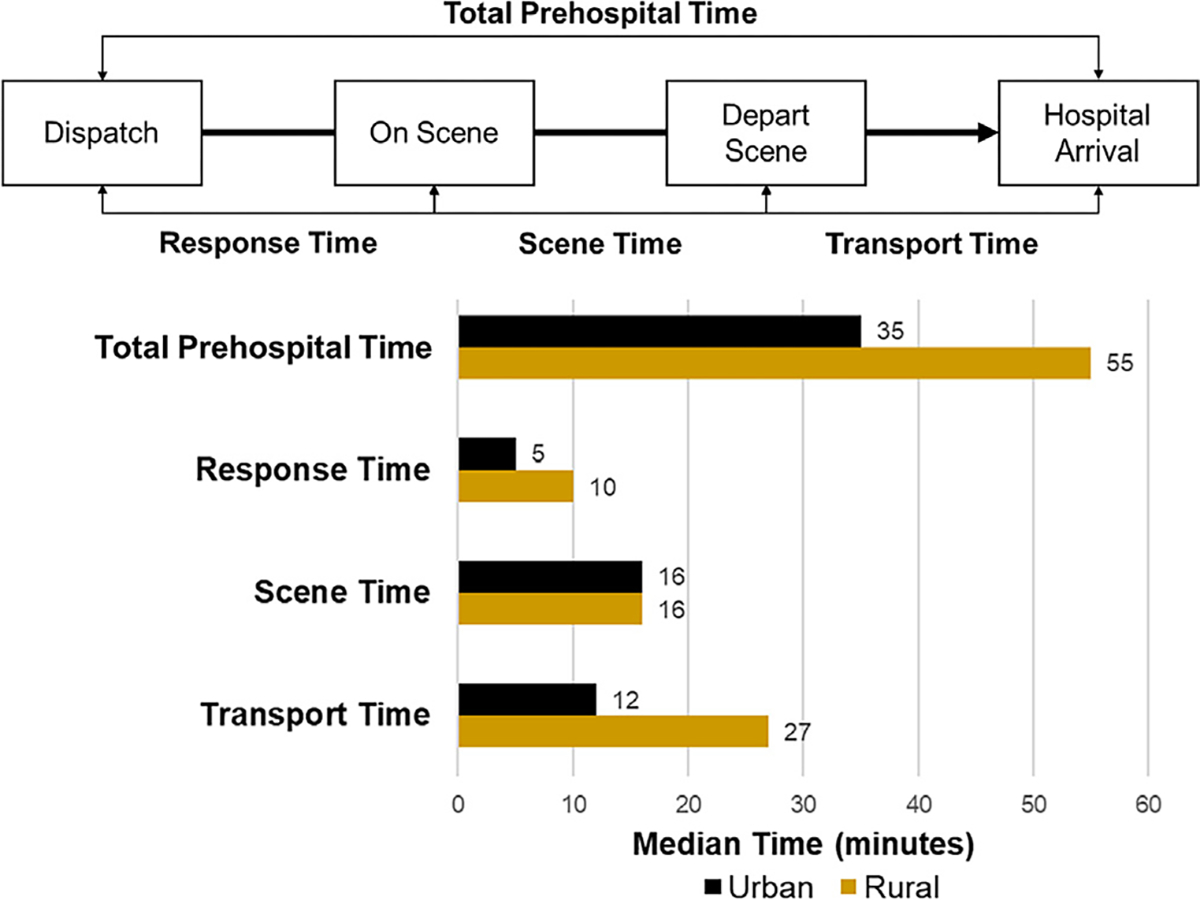
The prehospital time intervals of interest presented with median rural and urban times.
3.2. Main results
In univariable analysis, rural patients had an average total prehospital time that was 16.76 min (95%CI 15.15–18.38) longer than urban patients. Rural patients had longer response times (5.42 min, 95%CI 4.86–5.97), scene times (0.49 min, 95%CI 0.26–0.72), and transport times (10.92 min, 95%CI 9.69–12.14). The median rural loaded mileage distance was 20.8 miles (IQR 14.0–29.7) while the median urban distance was 5.5 miles (IQR 2.9–10.5).
After adjusting for covariables, including loaded mileage, rural patients still had longer average total prehospital time (5.08 min, 95%CI4.37–5.78). Response time (4.36 min, 95%CI 3.83–4.89) and transport time (0.62 min, 95%CI 0.33–0.90) remained longer for rural patients while scene time was no longer associated with location (0.09 min, 95%CI −0.15–0.33).
In the adjusted model, every 10-mile increase in loaded mileage was associated with longer total prehospital time (11.46 min, 95%CI 11.05–11.88), response time (1.02 min, 95%CI 0.85–1.19), scene time (0.38 min, 95%CI 0.29–0.47), and transport time (10.06 min, 95%CI 9.82–10.30). Unstable patients had longer total prehospital time (1.50 min, 95%CI 1.35–1.65) and scene time (1.45 min, 95%CI 1.32–1.58). Using lights and siren during transport was associated with less total prehospital time (−3.51 min, 95%CI −3.81 to −3.21), response time (−0.22 min, 95%CI −0.29 to −0.15), scene time (−0.27 min, 95%CI −0.45 to −0.08), and transport time (−3.02 min, 95%CI −3.20 to −2.85 min). Older patients, females, and white patients had longer total prehospital times. Table 3 presents the multivariable models.
Table 3.
Multivariable model for each prehospital time interval. Results reported as the change in minutes with the associated 95%CI.
| Variable | Total Prehospital Time (marginal R2 = 0.599) | Response Time (marginal R2 = 0.059) | Scene Time (marginal R2 = 0.048) | Transport Time (marginal R2 = 0.826) |
|---|---|---|---|---|
|
| ||||
| Age (categorical) | ||||
| 45–64 vs. 18–44 | 0.89 (0.79–0.99) | −0.09 (−0.14– −0.05) | 0.90 (0.82–0.97) | 0.09 (0.04–0.14) |
| 65+ vs. 18–44 | 2.91 (2.76–3.06) | 0.01 (−0.06–0.07) | 2.67 (2.56–2.78) | 0.23 (0.17–0.30) |
| Sex | ||||
| Female vs. Male | 1.01 (0.88–1.14) | −0.06 (−0.10– −0.01) | 0.88 (0.79–0.98) | 0.18 (0.15–0.21) |
| Race | ||||
| Black vs. White | −0.18 (−0.45–0.09) | −0.34 (−0.48– −0.20) | 0.17 (0.05–0.29) | −0.01 (−0.17–0.16) |
| Hispanic/Latino vs. White | −0.16 (−0.35–0.03) | −0.13 (−0.24– −0.03) | 0.05 (−0.08–0.18) | −0.08 (−0.18–0.01) |
| Other vs. White | −0.09 (−0.47–0.29) | −0.003 (−0.20–0.20) | 0.03 (−0.17–0.23) | −0.11 (−0.27–0.05) |
| Location | ||||
| Rural vs. Urban | 5.08 (4.37–5.78) | 4.36 (3.83–4.89) | 0.09 (−0.15–0.33) | 0.62 (0.33–0.90) |
| Transport Mode | ||||
| Lights/Siren vs. No Lights/Siren | −3.51 (−3.81– −3.21) | −0.22 (−0.29– −0.15) | −0.27 (−0.45– −0.08) | −3.02 (−3.20– −2.85) |
| Unstable | ||||
| Yes vs. No | 1.50 (1.35–1.65) | 0.02 (−0.01–0.06) | 1.45 (1.32–1.58) | 0.03 (−0.004–0.07) |
| Loaded Mileage (10-mile increase) | 11.46 (11.05–11.88) | 1.02 (0.85–1.19) | 0.38 (0.29–0.47) | 10.06 (9.82–10.30) |
4. Limitations
This study has limitations. It was a retrospective study using deidentified data among a heterogeneous population, making it possible that some patients had multiple encounters. Because this dataset was not linked with outcomes, it is unclear how many patients were diagnosed with ACS, required admission, or experienced other morbidity or mortality that could have been affected by time-to-delivery of care. Non-ESO EHR systems exist and were not included in this study, which limits the study's generalizability and may have led to selection bias. The US Census Bureau's dichotomous rural vs. urban scheme may oversimplify the rural-urban continuum as it does not account for socioeconomic factors, geography, or access to healthcare [14,15]. Regarding response time, scene time, transport time, loaded mileage, and transport MPH, practical yet arbitrary cut-offs were selected to exclude likely erroneous data entries. A complete case analysis was performed under the assumption that missing data are MCAR. If this assumption is incorrect, there could be some bias in the estimates. The analysis was also done under the assumption of normality. Even though the times evaluated were skewed, the normality assumption should be reasonable given the large sample size. Lastly, owing to the size of the dataset, there is a risk of detecting statistically significant but not clinically relevant differences.
5. Discussion
This national study of nearly 500,000 acute cardiac EMS encounters demonstrates that even after controlling for loaded mileage and other potential confounders, total prehospital time is longer for rural patients than urban patients. This suggests that opportunities exist to improve rural prehospital times. Addressing this rural disparity may reduce cardiovascular morbidity and mortality.
The importance of timely prehospital care and transport is well described. The American College of Cardiology recommends that patients with “suspected ACS and high-risk features” be referred immediately to the ED. [16] The Mission: Lifeline program identifies timely prehospital care as key for caring for patients with STEMI [8,17,18]. For these patients, every 30-min delay in reperfusion therapy is associated with a 7.5% increase in mortality [19]. Furthermore, EMS scene times less than 15 min are associated with a ten times greater odds of achieving the 90-min first medical contact to percutaneous coronary intervention benchmark for patients with STEMI [20,21].
A key finding is that rural patients were delayed in reaching hospitalbased care due to prolonged response times and transport times. Rural patients waited almost twice as long (11.4 vs. 6.5 min) for EMS to arrive compared to urban patients. A potential solution to this response time disparity includes optimizing rural EMS resources such as staff, ambulances, quick response vehicles, and base locations. Rural patients also had longer transport times. Distance to hospitals is naturally longer in the rural setting, especially in the era of many rural hospitals closing [22,23]. However, this disparity persisted despite accounting for loaded mileage, suggesting that the problem may stem from potentially modifiable rural EMS factors. Rural agencies may lack quality improvement and assurance programs. Alternatively, perhaps the quality and type of roadway available in rural areas contribute to this disparity. Although rural and urban scene time were similar, average times in both groups failed to meet Studnek's 15-min scene time metric, which has been associated with meeting guideline-based care metrics [21].
This study reveals other care disparities. Older patients had longer scene and transport times. Older patients may require moving assistance and more interventions, thereby accounting for longer scene time. Females received less timely care than males. This sex disparity is pervasive in the cardiovascular literature [24–27]. Previous prehospital literature indicates that use of lights and siren during transport does save time, especially during urban transports [28–31]. However, their use has not been shown to improve patient outcomes [28,32,33]. Unstable patients had longer prehospital time, particularly due to longer scene times. These longer scene times are likely due to performing onscene stabilization and procedures.
6. Conclusion
This national study demonstrates that rural patients with acute cardiac complaints receive less timely care than their urban counterparts. Even after adjusting for distance traveled and other confounders, rural patients still had longer prehospital times. These results suggest that further studies of EMS agency workflows could identify opportunities to improve rural prehospital times. Females and unstable patients also had longer prehospital time. These delays in care may contribute to increased morbidity and mortality.
Funding and disclosures
Dr. Crowe is the lead data scientist for ESO Solutions, Inc.
Dr. Snavely receives funding from NHLBI (1RO1HL118263–01), HRSA (1H2ARH399760100), and Abbott Laboratories.
Dr. Miller receives research funding from Siemens, Abbott Point of Care, Creavo Medical Technologies, Grifols, and NHLBI (5U01HL123027, 1 R01 HL118263).
Dr. Mahler receives funding/support from Roche Diagnostics, Abbott Laboratories, Ortho Clinical Diagnostics, Siemens, Grifols, Pathfast, Quidel, Genetesis, AHRQ, PCORI, NIDA, NHLBI (1RO1HL118263–01), and HRSA (1H2ARH399760100). He is a consultant for Abbott, Roche, Quidel, Genetesis, and Amgen and is the Chief Medical Officer for Impathiq Inc.
Dr. Stopyra receives research funding from NCATS/NIH (KL2TR001421), HRSA (H2ARH39976–01-00), Roche Diagnostics, and Abbott Point of Care.
Footnotes
Prior presentations
Preliminary data were presented at the 2020 National Association of EMS Physicians annual conference and at the 2020 American College of Emergency Physicians annual conference.
References
- [1].Møller TP, Ersbøll AK, Tolstrup JS, et al. Why and when citizens call for emergency help: an observational study of 211,193 medical emergency calls. Scand J Trauma Resusc Emerg Med. 2015;23:88. 10.1186/s13049-015-0169-0. [DOI] [PMC free article] [PubMed] [Google Scholar]
- [2].Pittet V, Burnand B, Yersin B, Carron PN. Trends of pre-hospital emergency medical services activity over 10 years: a population-based registry analysis. BMC Health Serv Res. 2014;14:380. 10.1186/1472-6963-14-380. [DOI] [PMC free article] [PubMed] [Google Scholar]
- [3].Owens PL, Barrett ML, Gibson TB, Andrews RM, Weinick RM, Mutter RL. Emergency department care in the United States: a profile of national data sources. Ann Emerg Med. 2010;56(2):150–65. 10.1016/j.annemergmed.2009.11.022. [DOI] [PubMed] [Google Scholar]
- [4].Benjamin EJ, Muntner P, Alonso A, et al. Heart disease and stroke statistics-2019 update: A report from the American Heart Association. Circulation. 2019;139(10): e56–528. 10.1161/CIR.0000000000000659. [DOI] [PubMed] [Google Scholar]
- [5].Kerr D, Holden D, Smith J, Kelly A-M, Bunker S. Predictors of ambulance use in patients with acute myocardial infarction in Australia. Emerg Med J 2006;23(12): 948–52. 10.1136/emj.2006.038414. [DOI] [PMC free article] [PubMed] [Google Scholar]
- [6].Nallamothu Brahmajee K, Bates Eric R, Wang Yongfei, Bradley Elizabeth H, Krumholz Harlan M. Driving times and distances to hospitals with percutaneous coronary intervention in the United States. Circulation. 2006;113(9):1189–95. 10.1161/CIRCULATIONAHA.105.596346. [DOI] [PubMed] [Google Scholar]
- [7].Dauerman HL, Bates ER, Kontos MC, et al. Nationwide analysis of patients with STsegment-elevation myocardial infarction transferred for primary percutaneous intervention: findings from the American Heart Association Mission: Lifeline Program. Circ Cardiovasc Interv. 2015;8(5). 10.1161/CIRCINTERVENTIONS.114.002450. [DOI] [PubMed] [Google Scholar]
- [8].Jollis JG, Al-Khalidi HR, Roettig ML, et al. Regional systems of care demonstration project: American Heart Association Mission: lifeline STEMI systems accelerator. Circulation. 2016;134(5):365–74. 10.1161/CIRCULATIONAHA.115.019474. [DOI] [PMC free article] [PubMed] [Google Scholar]
- [9].The Strengthening the Reporting of Observational Studies in Epidemiology (STROBE) Statement: guidelines for reporting observational studies | The EQUATOR Network. http://www.equator-network.org/reporting-guidelines/strobe/. [DOI] [PMC free article] [PubMed]
- [10].Bureau USC. 2010 census urban and rural classification and urban area criteria. Published online https://www.census.gov/programs-surveys/geography/guidance/geo-areas/urban-rural/2010-urban-rural.html; 2010.
- [11].Stopyra JP, Snavely AC, Scheidler JF, et al. Point-of-care troponin testing during ambulance transport to detect acute myocardial infarction. Prehosp Emerg Care. 2020; 24(6):751–9. 10.1080/10903127.2020.1721740. [DOI] [PubMed] [Google Scholar]
- [12].Zheng B Summarizing the goodness of fit of generalized linear models for longitudinal data. Stat Med 2000;19(10):1265–75 (doi:). [DOI] [PubMed] [Google Scholar]
- [13].Pan W Akaike’s information criterion in generalized estimating equations. Biometrics. 2001;57(1):120–5. 10.1111/j.0006-341x.2001.00120.x. [DOI] [PubMed] [Google Scholar]
- [14].Hall SA, Kaufman JS, Ricketts TC. Defining urban and rural areas in U.S. epidemiologic studies. J Urban Health. 2006;83(2):162–75. 10.1007/s11524-005-9016-3. [DOI] [PMC free article] [PubMed] [Google Scholar]
- [15].Definition of Rural Emergency Medicine. American College of Emergency Physicians. Accessed February 17 https://www.acep.org/patient-care/policy-statements/definition-of-rural-emergency-medicine/; 2021. [Google Scholar]
- [16].Amsterdam Ezra A, Wenger Nanette K, Brindis Ralph G, et al. 2014 AHA/ACC guideline for the management of patients with non–ST-elevation acute coronary syndromes. Circulation. 2014;130(25):e344–426. 10.1161/CIR.0000000000000134. [DOI] [PubMed] [Google Scholar]
- [17].Mission: Lifeline® EMS Recognition. American Heart Association. Accessed April 21 https://www.heart.org/en/professional/quality-improvement/mission-lifeline/mission-lifeline-ems-recognition; 2021. [Google Scholar]
- [18].Kragholm K, Lu D, Chiswell K, et al. Improvement in care and outcomes for emergency medical service-transported patients with ST-elevation Myocardial Infarction (STEMI) with and without prehospital cardiac arrest: a mission: lifeline STEMI accelerator study. J Am Heart Assoc. 2017;6(10). 10.1161/JAHA.117.005717. [DOI] [PMC free article] [PubMed] [Google Scholar]
- [19].Giuseppe De Luca, Suryapranata Harry, Ottervanger Jan Paul, Antman Elliott M. Time delay to treatment and mortality in primary angioplasty for acute myocardial infarction. Circulation. 2004;109(10):1223–5. 10.1161/01.CIR.0000121424.76486.20. [DOI] [PubMed] [Google Scholar]
- [20].O’Gara PT, Kushner FG, Ascheim DD, et al. 2013 ACCF/AHA guideline for the management of ST-elevation myocardial infarction: executive summary: a report of the American College of Cardiology Foundation/American Heart Association Task Force on Practice Guidelines: developed in collaboration with the American College of Emergency Physicians and Society for Cardiovascular Angiography and Interventions. Catheter Cardiovasc Interv. 2013;82(1):E1–27. 10.1002/ccd.24776. [DOI] [PubMed] [Google Scholar]
- [21].Studnek JR, Garvey L, Blackwell T, Vandeventer S, Ward SR. Association between prehospital time intervals and ST-elevation myocardial infarction system performance. Circulation. 2010;122(15):1464–9. 10.1161/CIRCULATIONAHA.109.931154. [DOI] [PubMed] [Google Scholar]
- [22].Frakt AB. The rural hospital problem. JAMA. 2019;321(23):2271–2. 10.1001/jama.2019.7377. [DOI] [PubMed] [Google Scholar]
- [23].Kaufman BG, Thomas SR, Randolph RK, et al. The rising rate of rural hospital closures. J Rural Health. 2016;32(1):35–43. 10.1111/jrh.12128. [DOI] [PubMed] [Google Scholar]
- [24].Humphries KH, Lee MK, Izadnegahdar M, et al. Sex differences in diagnoses, treatment, and outcomes for emergency department patients with chest pain and elevated cardiac troponin. Acad Emerg Med. 2018;25(4):413–24. 10.1111/acem.13371. [DOI] [PubMed] [Google Scholar]
- [25].Smulowitz PB, Barrett O, Hall MM, Grossman SA, Ullman EA, Novack V. Physician variability in management of emergency department patients with chest pain. West J Emerg Med. 2017;18(4):592–600. 10.5811/westjem.2017.2.32747. [DOI] [PMC free article] [PubMed] [Google Scholar]
- [26].Mnatzaganian G, Hiller JE, Braitberg G, et al. Sex disparities in the assessment and outcomes of chest pain presentations in emergency departments. Heart. 2020;106 (2):111–8. 10.1136/heartjnl-2019-315,667. [DOI] [PubMed] [Google Scholar]
- [27].Ashburn NP, Smith ZP, Hunter KJ, et al. The disutility of stress testing in low-risk HEART Pathway patients. Am J Emerg Med. 2020. 10.1016/j.ajem.2020.08.032 Published online August 15. [DOI] [PMC free article] [PubMed] [Google Scholar]
- [28].Marques-Baptista A, Ohman-Strickland P, Baldino KT, Prasto M, Merlin MA. Utilization of warning lights and siren based on hospital time-critical interventions. Prehosp Disaster Med. 2010;25(4):335–9. 10.1017/s1049023x0000830x. [DOI] [PubMed] [Google Scholar]
- [29].Hunt RC, Brown LH, Cabinum ES, et al. Is ambulance transport time with lights and siren faster than that without? Ann Emerg Med. 1995;25(4):507–11. 10.1016/s0196-0644(95)70267-9. [DOI] [PubMed] [Google Scholar]
- [30].Fleischman RJ, Lundquist M, Jui J, Newgard CD, Warden C. Predicting ambulance time of arrival to the emergency department using global positioning system and Google maps. Prehosp Emerg Care. 2013;17(4):458–65. 10.3109/10903127.2013.811562. [DOI] [PMC free article] [PubMed] [Google Scholar]
- [31].O’Brien DJ, Price TG, Adams P. The effectiveness of lights and siren use during ambulance transport by paramedics. Prehosp Emerg Care. 1999;3(2):127–30. 10.1080/10903129908958920. [DOI] [PubMed] [Google Scholar]
- [32].Newgard CD, Schmicker RH, Hedges JR, et al. Emergency medical services intervals and survival in trauma: assessment of the “golden hour” in a North American prospective cohort. Ann Emerg Med. 2010;55(3):235–46 e4 10.1016/j.annemergmed.2009.07.024. [DOI] [PMC free article] [PubMed] [Google Scholar]
- [33].Kupas DF. Lights and siren use by Emergency Medical Services (EMS): above all do no harm. US Department of Transportation, National Highway Traffic Safety Administration, Office of Emergency Medical Services; 2017. https://www.ems.gov/pdf/Lights_and_Sirens_Use_by_EMS_May_2017.pdf. [Google Scholar]