Figure 4.
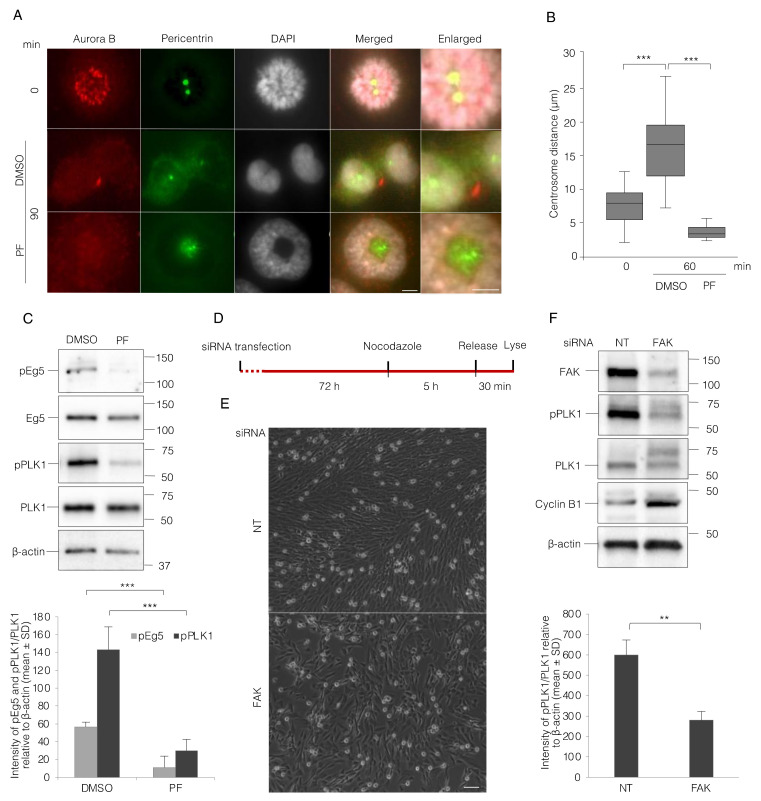
FAK inhibition reduces PLK1 activity and thereby impairs centrosome separation. (A) Representative immunofluorescence pictures illustrating the separation of centrosomes and nuclear features in BJ cells at the time points of 0 min after nocodazole washout and 90 min after re-plating the cells on fibronectin with PF or DMSO added directly at the washout. The staining of Aurora B (red) shows its location at centromeres and the midbody at the early and late stages of mitosis, respectively, in the control cells. Scale bar, 5 μm. (B) Box plots showing the centrosomes distance (µm) at 0 and 60 min after treatment as in (A). (C) Representative Western blot picture (upper) and quantification of the signal intensity of the bands (lower) of mitotic cells re-plated on fibronectin for 60 min in the presence of PF or DMSO. (D) Experimental design for siRNA treatment shown in (E,F). (E) Representative phase contrast images from the siRNA transfected cells 5 h after nocodazole treatment. Scale bar, 50 μm. (F) Western blot pictures (upper) and quantification of the signal intensity of pPLK1 bands relative to total PLK1 and β-actin (lower) from the cells described in part (D). p-values less than 0.05, 0.01, 0.001, and 0.0001 were shown by two and three stars, respectively.

