Figure 3.

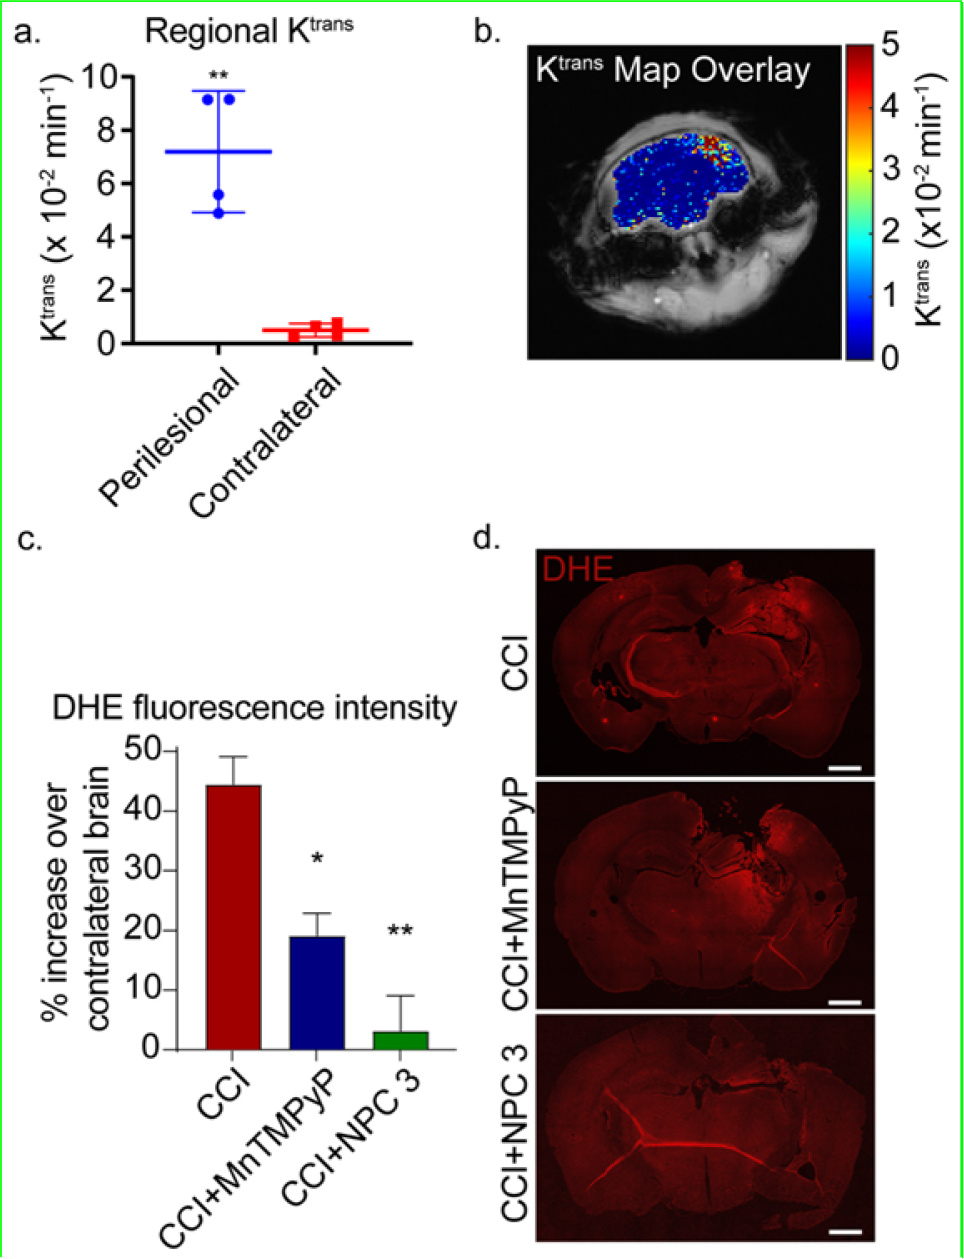
(a-b) In vivo DCE-MRI and Ktrans mapping of mice 3 h post-injury. (a) Significantly higher Ktrans was observed in the ipsilateral region compared with the contralateral (p = 0.0097) as determined by paired t-test. (b) The Ktrans map shows higher permeability (red) corresponds with the ipsilateral region (right side of the brain in the image) while lower values are observed in the contralateral hemisphere. (c-d) In vivo DHE staining of the brains at 4 h post-injury. c) The DHE fluorescence mean intensity at the perilesional normalized to the contralateral hemisphere. Data are shown as mean ± SEM with n = 3 for each treatment group; 1.439 ± 0.055 for untreated CCI mice, 1.189 ± 0.045 for MnTMPyP treated CCI mice, and 1.032 ± 0.071 for NPC 3 treated CCI mice. * indicates a statistical difference compared to control with one and two symbols indicating p < 0.05 and p < 0.01, respectively, as determined by one-way ANOVA and Tukey’s post hoc test. (d) Representative images of the DHE staining of the untreated CCI mice, MnTMPyP treated CCI mice, and NPC 3 treated CCI mice. The scale bar is 1000 μm.
