

Abstract
Medicaid claims are an important, but underutilized source of data for neonatal health services research in the United States. However, identifying live births in Medicaid claims data is challenging due to variation in coding practices by state and year. Methods of identifying live births in Medicaid claims data have not been validated, and it is not known which methods are most appropriate for different research questions. The objective of this study is to describe and validate five approaches to identifying births using Medicaid Analytic eXtract (MAX) from 45 states (2006–2014). We calculated total number of MAX births by state-year using five definitions: (1) any claim within 30 days of birth date listed in personal summary (PS) file, (2) any claim within 7 days of PS birth date, (3) live birth ICD-9 in inpatient or other therapies file, (4) live birth ICD-9 code in inpatient file, (5) live birth ICD-9 in inpatient file with matching PS birth date. We then compared the number of MAX births by state and year to expected counts using outside data sources. Definition 1 identified the most births (14,189,870) and was closest to total expected count (98.3%). Each definition produced over- and underestimates compared to expected counts for given state-years. Findings suggest that the broadest definition of live births (Definition 1) was closest to expected counts, but that the most appropriate definition depends on research question and state-years of interest.
Keywords: Medicaid, Claims analysis, Data quality, Maternal health services, Infant health services
1. Introduction
Limitations of existing data sources for neonatal health services research are a persistent challenge for researchers seeking to evaluate the impacts of policies and innovations in care delivery that span the perinatal continuum (Gourevitch et al. 2020). Several datasets commonly used to study birth outcomes, including State Inpatient Databases (SID) (Faherty et al. 2019), National Inpatient Sample (NIS) (Winkelman et al. 2018), and National Vital Statistics System (NVSS) (Dahlen et al. 2017), may not be suitable to address many health services research questions. First, none of these datasets provide information on outpatient utilization, which means they are of limited use in studies examining primary care utilization, care coordination, or conditions that may be detected in the weeks or months following birth. Second, neither SID nor NIS provide maternal information, meaning they cannot be used to examine the impact of maternal health or healthcare utilization on birth outcomes. The NVSS provides information on both maternal and infant health, however, this information is very limited. Finally, each state and year of the SID must be purchased individually, and the NIS includes only a sample of hospitals, without state identifiers, which limits their utility for conducting multi-state studies examining the impact of state policies on disparities in maternal and neonatal outcomes.
An important but underutilized data source for neonatal health services researchers is Medicaid claims. In 2018, Medicaid financed nearly half of all births in the United States and financed the majority of births for several priority populations including racial/ethnic minorities and women living in rural areas (Medicaid and CHIP Payment and Access Commission 2020). Medicaid inpatient and outpatient claims data contain detailed information on diagnoses, types and dates of service from multiple care settings, and can be linked to prescription claims. Because eligibility requirements for pregnant women and children are less restrictive than for other adults, these Medicaid enrollees represent large and diverse populations.
Despite the potential utility of Medicaid claims for neonatal health services research, few studies use this data source. Researchers have obtained Medicaid data directly from individual states and linked these data with birth certificate data to examine infant health outcomes (Anum et al. 2010; Phiri et al. 2015). However, this strategy must be employed separately for each state, making large, multi-state comparisons or policy evaluations costly and time consuming. A better option for many researchers is Medicaid Analytic eXtract (MAX) data, available from the Research Data Assistance Center (ResDAC). MAX data are available for all 50 states and the District of Columbia 1999–2010, with some states having data through 2014. Files are constructed from state files submitted to the Center for Medicare and Medicaid Services (CMS) and converted to a consistent, national format with a unified data dictionary. However, differences in how infants are enrolled in Medicaid and how their claims are recorded vary by state. Federal law states that all infants born to mothers insured by Medicaid are automatically eligible for Medicaid with no new application or eligibility determination required, but in practice, reviews of enrollment data show gaps between the number of infants who are eligible for Medicaid and the number of infants who are continuously enrolled from birth (Johnson et al. 2020). The size of this gap varies considerably by state and is likely due to administrative practices that lead to delays in enrollment (Johnson et al. 2020). When these infants are eventually enrolled, their claims data may not always be retroactively included in MAX data (Johnson et al. 2020). Beyond differences in enrollment, there are also inconsistencies in how these claims are initially recorded. Infant claims are sometimes included on the mother’s identification number for the first few days of life with completeness of retroactive correction varying by state (Johnson et al. 2020). On the other hand, states may assign multiple identification numbers (e.g., a temporary then permanent identification number) to the same infant, which could lead to overcounting. This potential variation in enrollment and coding practices across 50 states makes it challenging for researchers to fully understand the variety of approaches that can be used to identify births in Medicaid data and the implications of these different approaches.
To take full advantage of Medicaid data for neonatal health services research, researchers need to better understand available approaches to identifying live births and how the validity of these approaches vary by state. Studies have used the mothers’ Medicaid claims in MAX to identify delivery episodes, but fewer have used infant claims to look at neonatal health conditions and utilization. The few studies that have used MAX data to identify infants rather than focus on the delivery episode (DiMaggio et al. 2011; DiMaggio and Li 2013; Lorch et al. 2014) do not provide sufficient information to recreate or validate their identification methods. This study addresses an important gap in the literature and provides a resource for researchers planning to use Medicaid data to study neonatal health services research topics. The objectives of this paper are to (1) compare counts of births in MAX data using five different claims-based definitions and (2) assess the validity of these counts by comparing them to expected counts of Medicaid births.
2. Methods
2.1. Data
MAX data files used for this study were initially obtained for a study of early childhood dental care utilization (Kranz et al. 2020). Forty-five states were selected based on availability of data (Research Data Assistance Center 2019) and high-quality managed care encounter data (Byrd and Hedley Dodd 2012). A sample of MAX data were obtained for most states during 2006–2012, with some states also having data for 2013 or 2014. The sample used in this study included both (1) all Medicaid enrolled children younger than six years old who received dental services in medical offices and (2) a stratified random sample of Medicaid enrolled children younger than six who never received those services (i.e., controls). Those who received dental services received a weight of one while controls received a weight equal to the inverse proportion of controls sampled (e.g., if 20% of children who did not receive dental services were randomly selected in a given state, those children each received a weight of 5). Thus, the sample was weighted to be representative of all Medicaid enrolled children younger than six years of age in these states and years and provided a representative sample for examining live births. Values of control group weights ranged from 1 to 53 depending on the state.
MAX data files used in this study included the Personal Summary (PS) file, inclusive of enrollment information and date of birth, the Other Therapy (OT) file, inclusive of claims for outpatient visits, and the Inpatient file. To assess the validity of counts of births generated using the MAX data, we constructed expected counts of Medicaid births based on external sources with which we could compare the state and year estimates in the MAX. These sources included the National Center for Health Statistics (NCHS) (2020), the Kaiser Family Foundation (2016), and March of Dimes (2020). As a second source for comparison, we obtained Medicaid enrollment counts for children under one year of age by state and year from CMS (Centers for Medicare and Medicaid Services 2021).
2.2. Live birth definitions in MAX
We examined five claims-based definitions of a live birth in the Medicaid MAX data:
Definition 1: Any Medicaid claim in the OT or Inpatient files on or within 30 days following the date of birth in the infant’s PS file;
Definition 2: Any Medicaid claim in the OT or Inpatient files on or within 7 days following the date of birth listed in the infant’s PS file;
Definition 3: Any claim with an ICD-9 code indicating a live birth in the OT or Inpatient files (V30.00-V30.01, V31.00-V31.01, V32.00-V32.01, V33.00-V33.01, V34.00-V34.01, V35.00-V35.01, V36.00-V36.01, V37.00-V37.01, V38.00-V38.01, V39.00-V39.01);
Definition 4: Any claim with an ICD-9 code indicating a live birth in the Inpatient file only;
Definition 5: Any claim in the Inpatient file only with an ICD-9 code indicating a live birth on the same date as the date of birth in the infant’s PS file.
In the rare case in which a claim had a live birth ICD-9 code at some point, but there were no claims within 30 days of the date of birth listed in the PS file (< 1% of births), the birth was considered to still meet Definitions 1 and 2. Thus, the definitions can be considered hierarchical with all individuals meeting criteria for a given definition also meeting the criteria for the previous definition(s).
2.3. Approach
The total number of MAX births for each of the five definitions was calculated by state and year, weighted to be representative of the states and years in the study. Counts were summed to provide an overall count of births during the study period and compared to each other. Additionally, we assessed the validity of the counts of MAX births by comparing them to outside estimates from publicly available data. Lacking a single data source to provide expected counts of total Medicaid births by state-year during our study period, we constructed estimates using information from three sources. The NCHS (2006–2014) provided total counts of births by state-year. State-specific percentages of Medicaid covered births were obtained from March of Dimes (Hawaii) and Kaiser Family Foundation (all other states). Cross-sectional estimates were available for only one year per state and varied by state, ranging from 2010–2016 (March of Dimes 2020). We constructed expected counts of total Medicaid births per state-year by multiplying the state- and year-specific counts of total births from the NCHS by state-specific percentages of Medicaid covered births. Because there is no “gold standard” count of births count of Medicaid births, we conducted a secondary analysis using counts of children younger than one year of age enrolled in Medicaid from row 1a of CMS-416 reports, which are used to monitor Medicaid-enrolled children’s receipt of Early and Periodic Screening, Diagnostic and Treatment (EPSDT) benefits (Centers for Medicare and Medicaid Services 2021). We expect these counts to be a more accurate representation of what they are measuring (Medicaid enrollment of children younger than one year of age by state-year) but will likely be greater than the number of Medicaid births in a year as some children will be enrolled in Medicaid later in life. We calculated the percent difference between each of the five definitions examined in the MAX data to each state-year expected count using the following formula:
The percent difference between the MAX Count and the number of children enrolled in Medicaid younger than one year of age were also calculated in the same manner and the results by state-year can be found in Online Resource 1.
3. Results
This analysis included data from 45 states, representing 351 state-years 2006–2014. Figure 1 shows the number of live births identified using each definition and the percent of expected births. Definition 1, which defined a live birth as the presence of any claim on or within 30 days following an infant’s birth date, identified 14,189,870 total live births, 98.3% of the births estimated using outside sources for the same states and years. Restricting the definition to the presence of any claim on or within 7 days following the date of an infant’s birth date (Definition 2) reduced the number of births to 85.3% of expected counts. Requiring a live birth ICD-9 code (Definition 3) further reduced the number of identified births to 76.7% of expected counts. Of these births, 2,840,677 only had ICD-9 codes indicating live births in the OT file. When live birth ICD-9 codes were restricted to those found in the Inpatient file (Definition 4), the number of births identified decreased to 57.1% of expected counts. Requiring the additional quality check that the date of the live birth ICD-9 code match the birth date listed on the PS file excluded few additional infants, with Definition 5 identifying 56.0% of expected counts.
Fig. 1.
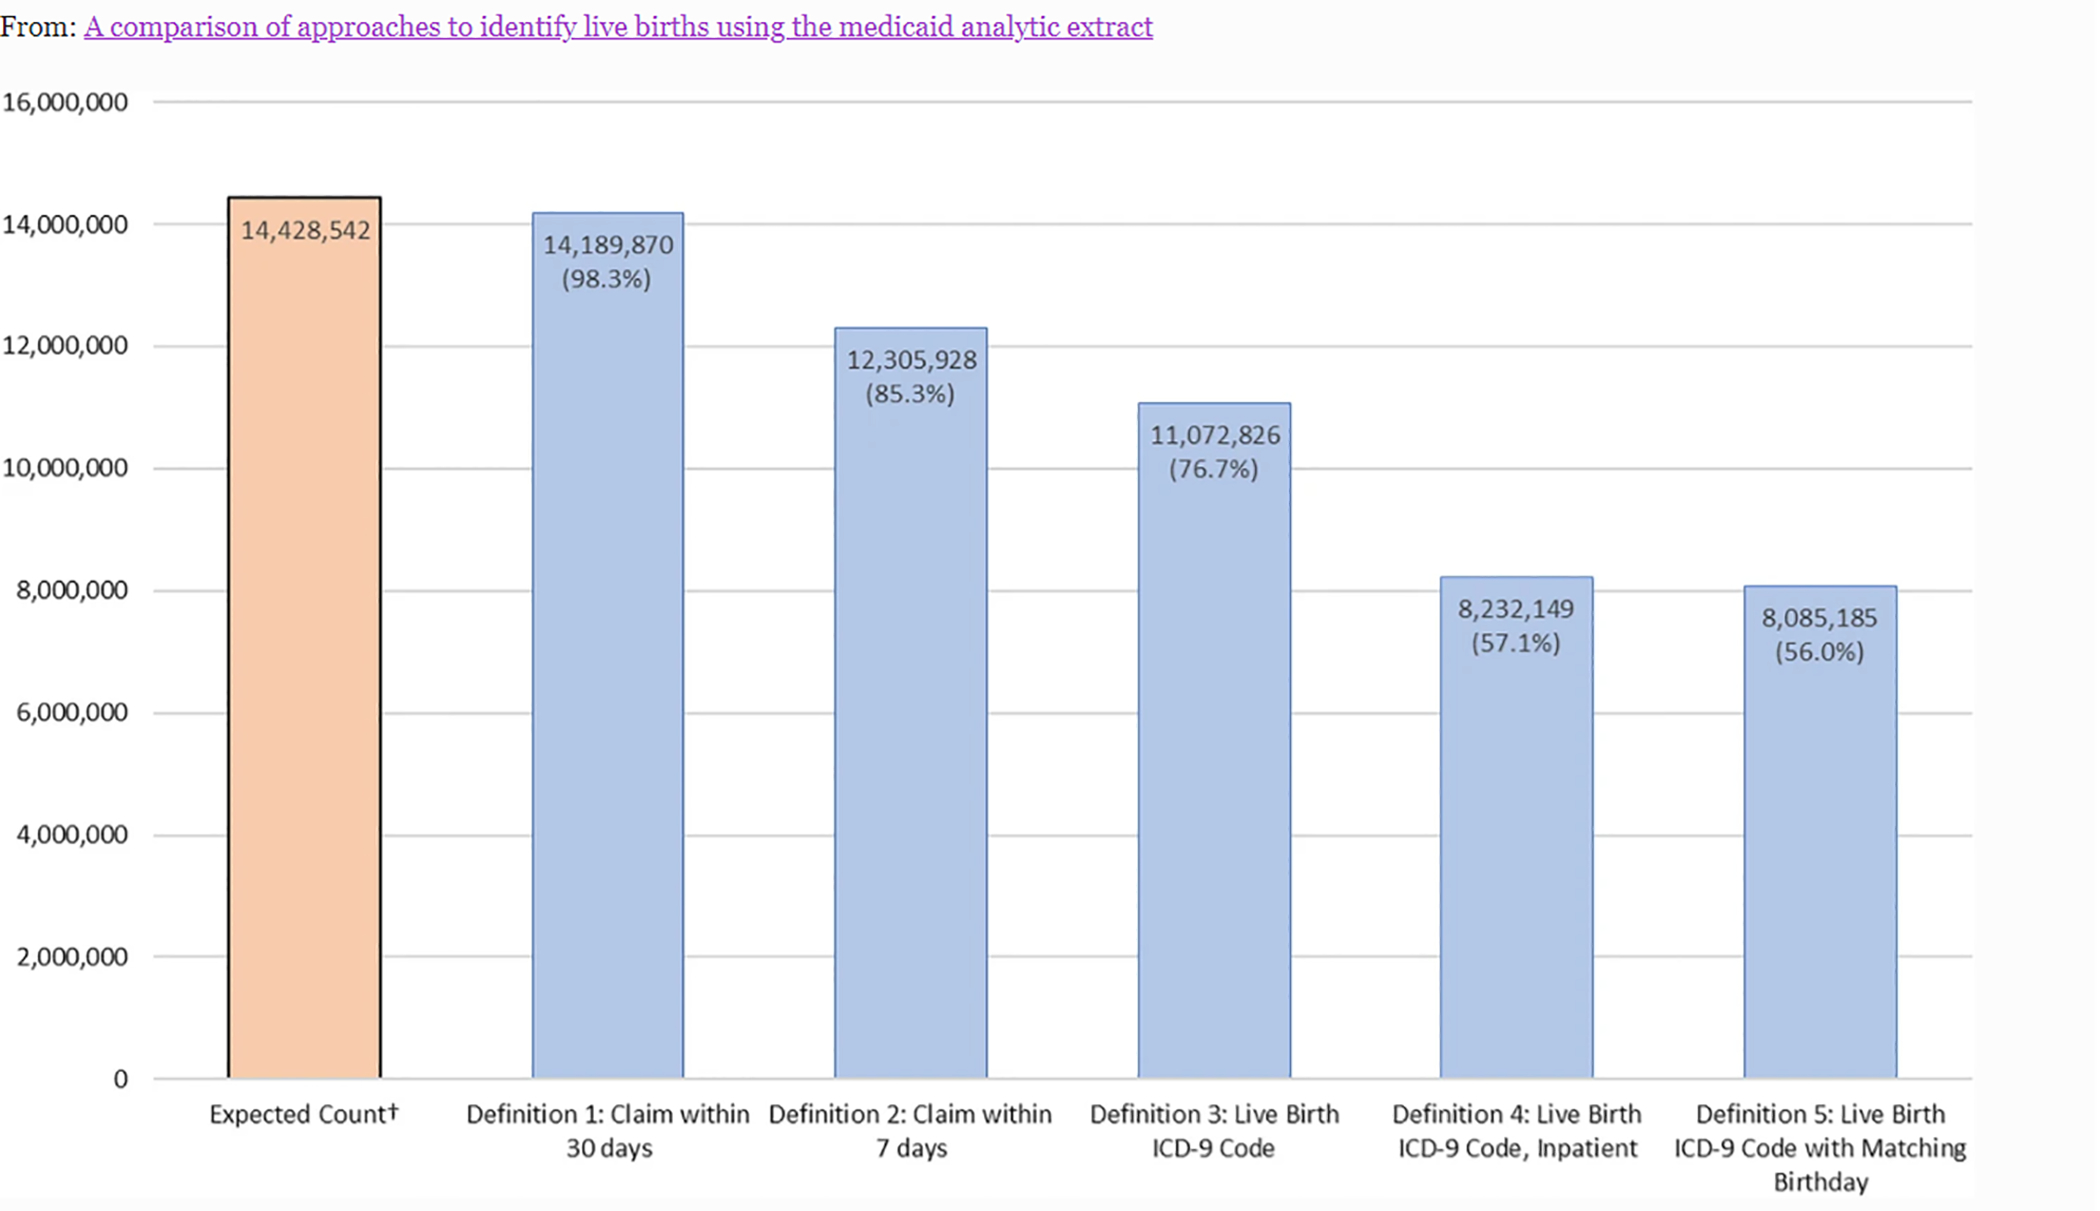
Number of live births captured by definition and percentage of expected counts for all 351 state-years. †Expected count based on total births by state and year from United States Census data and percent of births financed by Medicaid from Kaiser Family Foundation and March of Dimes
Figure 2 illustrates variation in differences between MAX claims-based definitions and expected counts by state and year. Definitions 1 and 2 had the highest percent of state-years with birth counts most similar to expected counts (49.6% and 48.4% of state-years, respectively). The percent of state-years with birth counts within 10% of expected counts decreased as definitions became more restrictive, with the most restrictive definition (Definition 5) only yielding 74 state-years (21.1%) within 10% of expected counts. While the total number of births identified using Definition 1 was similar to expected counts, only half of state-years were within 10% of expected counts. Using Definition 1, 60 state-years (17.1%) had birth counts 10 to 20% greater than expected counts, and 53 state-years (15.1%) had birth counts over 20% greater than expected counts.
Fig. 2.

Summary of percent differences between MAX using different definitions and expected count (N = 351 state-years)†. Figure 2 shows the number and percent of state-years with live births that were greater than expected counts (> + 10% different), similar to expected counts (− 10% to + 10% different), and less than expected counts (< − 20%) for each definition. For example, using Definition 1, 174 state years (49.6%) had birth counts similar to expected counts. Abbreviations: DOB Date of Birth; ICD-9 International Classification of Disease, Version 9; MAX Medicaid Analytic eXtract; OT Other Therapy
Table 1 highlights a selection of state-years in which the number of live births identified using Definition 1 closely matched or was substantially higher or lower than expected counts. While those that most closely matched expected counts did not show a pattern by state or year, three of the five largest undercounts were from Nebraska (2006, 2008, 2009) and three of the five largest overcounts were from New Hampshire (2010–2012). Complete data on number of births identified and percent difference from expected counts by state-year for each definition is available in Online Resource 1.
Table 1.
State/years with largest and smallest percent differences from expected counts using Definition 1 (Any claims within 30 days of Date of Birth)
| Rank | Closest to expected counts | Largest negative percent differences | Largest positive percent differences |
|---|---|---|---|
| 1 | Indiana 2006, + 0.2% | Maine 2010, − 94.7% | Arizona 2010, + 64.8% |
| 2 | Colorado 2009, − 0.6% | Kansas 2010, − 88.9% | New Hampshire 2011, + 47.8% |
| 3 | Rhode Island 2007, + 0.7% | Nebraska 2008, − 73.6% | Kentucky 2010, + 47.6% |
| 4 | Oklahoma 2006, − 0.7% | Nebraska 2009, − 73.1% | New Hampshire 2012, + 45.0% |
| 5 | Wisconsin 2012, − 0.7% | Nebraska 2006, − 72.0% | New Hampshire 2010, + 44.0% |
In our secondary analysis, comparisons of MAX counts to counts of children under the age of one enrolled in Medicaid yielded similar results. All definitions identified a lower percentage of children under one than the percentage of expected births. This was expected because the number of children younger than age one enrolled in Medicaid should be higher than the number of Medicaid births. For example, Definition 1 identified 84.4% the number of total Medicaid enrollees younger than age one for our state-years of interest (Online Resource 1). However, the overall conclusion, that Definition 1 provided counts closest to those expected, remained the same. Definition 1 provided a count of births within a 10% difference of the number of total Medicaid children younger than age one for 163 out of 351 state-years (46.4%).
4. Discussion
In this comparison of five definitions of live births in MAX data across 45 states, we found that using the broadest definition—any claim within 30 days of infant birth date—identified the number of births closest to expected counts. However, the percent difference varied widely by state-year, with the definition yielding both substantial under- and overcounts as compared to outside estimates.
Researchers seeking the optimal approach to identifying live births in Medicaid data should first consider which definitions are most appropriate for the states and years they plan to include in their studies. Researchers can consult Online Resource 1 to determine which definition has the smallest percent difference from expected counts for their states and years of interest. Second, researchers should consider whether it is more important to obtain a representative sample of infants or to have complete information on the infants in their study. If obtaining a representative sample of infants is very important to the research question, one of the more generous definitions may be preferable. Requiring a live birth ICD-9 code will identify fewer infants overall and could disproportionately exclude infants with fewer medical needs, as infants with higher service utilization may be more likely to have services retroactively added to their records. Some states may also underreport diagnosis and procedure code information among their managed care population (Byrd and Dodd 2013), potentially leading to a live birth ICD-9 requirement (i.e., Definitions 3–5) identifying fewer managed care infants. If having complete information on diagnosis codes and procedures, particularly for an infant’s first days of life, is more important, using an ICD-9-based definition may be preferred.
Across the five approaches to identifying births, undercounting live births was a larger issue than overcounting. There are several reasons MAX claims-based definitions may undercount live births. First, infant claims may initially be included under the mother’s identification number (Johnson et al. 2020). Similarly, Medicaid-eligible infants may not immediately be enrolled in Medicaid and, after enrollment, some claims data may not be retroactively included (Johnson et al. 2020). These reasons could explain cases where live birth ICD-9 codes were not observed for infants who were enrolled in Medicaid in the year of their birth. Including infants with any claims within 7 or 30 days may capture many, but not all of these cases. Another minor contributor to undercounting may be infants born outside the hospital. However, this contribution is likely negligible given that < 1% of US births occurred outside of a hospital setting during this time period and are much less likely to be financed by Medicaid than are hospital births (MacDorman and Declercq 2019).
Overcounting live births was a significant issue for specific state-years, particularly with Definition 1. Births may be overcounted if the infant did not qualify for Medicaid at the time of birth, but enrolled and generated claims within 30 days. Additionally, overcounting may occur if a state assigns multiple identification numbers to the same infant which could lead to overcounting for all definitions examined. If a temporary identification number is assigned at birth and a new number is assigned when the infant is enrolled in Medicaid, using an ICD-9 based definition may help reduce double-counting. However, other neonatal services received may be missed if infants receive a second identification number after enrollment.
These hypothesized reasons for undercounting and overcounting births point to potential areas for data quality improvement. To enhance the utility of these data for research purposes, infants eligible at birth should be enrolled in Medicaid in a timely manner and claims should be recorded under a unique identification number. If an infant is not immediately enrolled in Medicaid or claims are included under the mother’s identification number, records should be retroactively corrected. In recent years, CMS has taken additional steps to analyze and improve data quality. One notable effort is CMS’s Data Quality (DQ) Atlas, which helps researchers examine data quality assessments by topic, state, and year (Centers for Medicare and Medicaid Services 2020). Notably, the DQ Atlas does not include reports on Medicaid MAX data, only the more recent Transformed Medicaid Statistical Information System (T-MSIS) data.
This study should be interpreted in light of a few limitations. First, the outside estimates used to create expected counts are not a “gold standard.” We obtained counts of total births for each state and year in our study period, but were only able to find state-level, cross-sectional estimates of percent of births covered by Medicaid during 2010–2016. The percent of births covered by Medicaid changes each year, which may lead to inaccuracies in our expected counts of births covered by Medicaid for some state-years. Beginning in 2016, Wide-ranging Online Data for Epidemiologic Research (WONDER) began reporting source of payment for deliveries in their publicly available natality data derived from birth certificates (Centers for Disease Control and Prevention 2020). This dataset provides more precise estimates of the number of births financed by Medicaid by state-year and could be used to validate birth definitions of more recent data. We expect natality data derived from birth certificates to be highly complete and accurate, but it is possible that Medicaid MAX may capture a small number of infants that are not captured in WONDER data. Second, newer Medicaid data is now available from ResDAC via the T-MSIS. States transitioned from MAX to T-MSIS between 2011 and 2016, leading to delays in new data, but more recent data, available up to 2019 in some states, are finally being released. However, few researchers have published with these data given their recent release and concerns about data completeness (Centers for Medicare and Medicaid Services 2016). These approaches to identifying and validating live births remain relevant in the newer Medicaid enrollment and claims files, but exact results may vary. Additionally, results may vary with the 2015 transition to ICD-10, though these general methods could still be used with an updated code set.
This study is a resource for researchers who want to use Medicaid claims data to identify births for neonatal health services research. Researchers can use these comparisons of live birth counts to expected counts to determine the most appropriate definitions for their research questions and which state-years of data should be excluded.
Supplementary Material
Acknowledgments
Funding Research reported in this publication was supported by the National Institute on Drug Abuse of the National Institutes of Health under award number R21DA045212 (Faherty). The content is solely the responsibility of the authors and does not necessarily represent the official views of the National Institutes of Health.
Footnotes
Conflicts of interest The authors have no conflicts of interest to report.
Code availability SAS code is available from the authors upon request.
Supplementary Information The online version contains supplementary material available at https://doi.org/10.1007/s10742-021-00252-w.
Data availability
Medicaid Analytic Extract (MAX) Data is available for purchase through the Research Data Assistance Center (ResDAC). Medicaid enrollment data is publicly available from the Centers for Medicare and Medicaid Services (CMS). Original data from the National Center for Health Statistics (NCHS), the Kaiser Family Foundation, and March of Dimes are publicly available and derived state-year estimates from this data are included in supplementary material.
References
- Anum EA, Retchin SM, Garland SL, Strauss JF III.: Medicaid and preterm births in Virginia: an analysis of recent outcomes. J. Womens Health. 19, 1969–1975 (2010) [DOI] [PMC free article] [PubMed] [Google Scholar]
- Kaiser Family Foundation: Births Financed by Medicaid. https://www.kff.org/medicaid/state-indicator/births-financed-by-medicaid/ (2016). Accessed 20 July 2020
- Byrd V, Hedley Dodd A: Assessing the usability of encounter data for enrollees in comprehensive managed care across MAX 2007–2009. Centers for Medicare and Medicaid Services Policy Brief. https://www.cms.gov/Research-Statistics-Data-and-Systems/Computer-Data-and-Systems/MedicaidDataSourcesGenInfo/Downloads/MAX_IB_15_AssessingUsability.pdf (2012). Accessed 25 May 2021. [Google Scholar]
- Byrd VL, Dodd AH: Assessing the usability of MAX 2008 encounter data for comprehensive managed care. Medicare Medicaid Res. Rev. 3, 1 (2013) [DOI] [PMC free article] [PubMed] [Google Scholar]
- Centers for Disease Control and Prevention: Natality - Birth Records (Expanded) Documentation. https://wonder.cdc.gov/wonder/help/Natality-expanded.html (2020). Accessed 25 May 2021.
- Centers for Medicare and Medicaid Services: State Summary 2016 TAF DQ Topical Snapshot. https://resdac.umn.edu/taf-data-quality-resources (2016). Accessed 25 May 2021.
- Centers for Medicare and Medicaid Services: Data Quality Atlas. https://www.medicaid.gov/dq-atlas/landing/topics/info (2020). Accessed 25 May 2021.
- Centers for Medicare and Medicaid Services: Early and Periodic Screening, Diagnostic, and Treatment. https://www.medicaid.gov/medicaid/benefits/early-and-periodic-screening-diagnostic-and-treatment/index.html (2021). Accessed 25 May 2021.
- Dahlen HM, McCullough JM, Fertig AR, Dowd BE, Riley WJ: Texas medicaid payment reform: fewer early elective deliveries and increased gestational age and birthweight. Health Aff. (millwood) 36, 460–467 (2017). 10.1377/hlthaff.2016.0910 [DOI] [PubMed] [Google Scholar]
- DiMaggio C, Li G: Emergency department visits for traumatic brain injury in a birth cohort of medicaid-insured children. Brain Inj. 27, 1238–1243 (2013). 10.3109/02699052.2013.809552 [DOI] [PubMed] [Google Scholar]
- DiMaggio C, Sun L, Li G: Early childhood exposure to anesthesia and risk of developmental and behavioral disorders in a sibling birth cohort. Anesth. Analg 113, 1143–1151 (2011). 10.1213/ANE.0b013e3182147f42 [DOI] [PMC free article] [PubMed] [Google Scholar]
- Faherty LJ, Kranz AM, Russell-Fritch J, Patrick SW, Cantor J, Stein BD: Association of punitive and reporting state policies related to substance use in pregnancy with rates of neonatal abstinence syndrome. JAMA Netw. Open 2, e1914078–e1914078 (2019) [DOI] [PMC free article] [PubMed] [Google Scholar]
- Gourevitch RA, Friedman Peahl A, McConnell M, Shah N: Understanding the impact of prenatal care: improving metrics, data, and evaluation. Health Affairs Blog. (2020). 10.1377/hblog20200221.833522/full/ Accessed 25 May 2021. [DOI] [Google Scholar]
- Johnson K, Rosenbaum S, Handley M The next steps to advance maternal and child health in medicaid: filling gaps in postpartum coverage and newborn enrollment. Health Affairs Blog. 10.1377/hblog20191230.967912/full/ (2020). Accessed 25 May 2021. [DOI] [Google Scholar]
- Johnson K: Missing Babies: Best Practices for Ensuring Continuous Enrollment in Medicaid and Access to EPSDT. Johnson Group Consulting, Inc. https://ccf.georgetown.edu/wp-content/uploads/2021/03/missing_babies_EPSDT_Medicaid_finalJan2021_Johnson.pdf. (2021). Accessed 25 May 2021. [Google Scholar]
- Kranz AM, Rozier RG, Stein BD, Dick AW: Do Oral Health Services in Medical Offices Replace Pediatric Dental Visits? J. Dent. Res 99, 891–897 (2020). 10.1177/0022034520916161 [DOI] [PMC free article] [PubMed] [Google Scholar]
- Lorch SA, Passarella M, Zeigler A: Challenges to measuring variation in readmission rates of neonatal intensive care patients. Acad. Pediatr 14, S47–S53 (2014). 10.1016/j.acap.2014.06.010 [DOI] [PubMed] [Google Scholar]
- MacDorman M, Declercq E: Trends and state variations in out-of-hospital births in the United States, 2004–2017. Birth Berkeley Calif. 46, 279–288 (2019). 10.1111/birt.12411 [DOI] [PMC free article] [PubMed] [Google Scholar]
- March of Dimes: Peristats, https://www.marchofdimes.org/peristats/Peristats.aspx (2021). Accessed 25 May 2021.
- Medicaid and CHIP Payment and Access Commission: Medicaid’s Role in Financing Maternity Care. https://www.macpac.gov/wp-content/uploads/2020/01/Medicaid%E2%80%99s-Role-in-Financing-Maternity-Care.pdf (2020). Accessed 25 May 2021.
- Phiri K, Williams PL, Dugan KB, Fischer MA, Cooper WO, Seage GR, Hernandez-Diaz S: Antiretroviral Therapy Use during Pregnancy and the Risk of Small-for-Gestational-Age Birth in a Medicaid Population. Pediatr. Infect. Dis. J 34, e169–e175 (2015). 10.1097/INF.0000000000000712 [DOI] [PMC free article] [PubMed] [Google Scholar]
- Research Data Assistance Center: MAX Other Therapy File, https://www.resdac.org/cms-data/files/max-ot (2019). Accessed 25 May 2021.
- Winkelman TNA, Villapiano N, Kozhimannil KB, Davis MM, Patrick SW: Incidence and costs of neonatal abstinence syndrome among infants with medicaid: 2004–2014. Pediatrics 141, 1 (2018). 10.1542/peds.2017-3520 [DOI] [PMC free article] [PubMed] [Google Scholar]
Associated Data
This section collects any data citations, data availability statements, or supplementary materials included in this article.
Supplementary Materials
Data Availability Statement
Medicaid Analytic Extract (MAX) Data is available for purchase through the Research Data Assistance Center (ResDAC). Medicaid enrollment data is publicly available from the Centers for Medicare and Medicaid Services (CMS). Original data from the National Center for Health Statistics (NCHS), the Kaiser Family Foundation, and March of Dimes are publicly available and derived state-year estimates from this data are included in supplementary material.