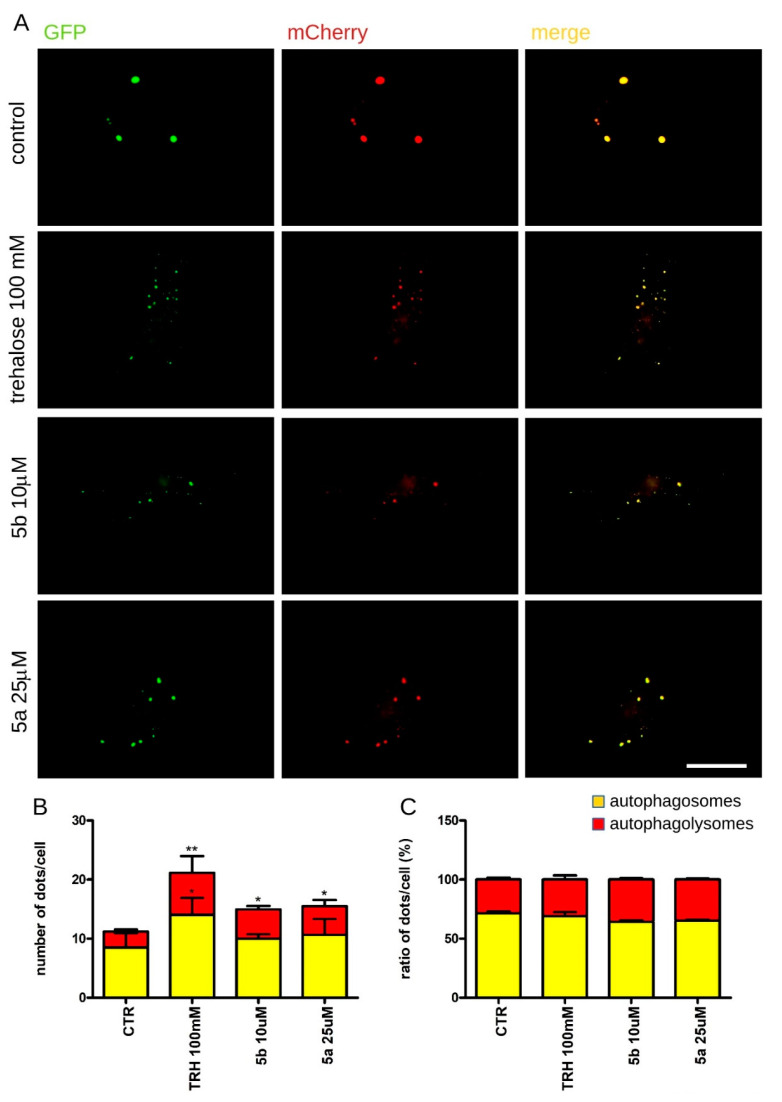
Figure 5.
Assessment of autophagy by imaging approaches. We investigated the autophagic flux by a GFP-mCherry-LC3B reporter. Non-acidic autophagosomes appear as green and red dots, while autophagolysomes are red. (A) Image-based investigation of autophagy upon expression of the reporter GFP-mCherry-LC3B in HeLa cells treated for 24 h with trehalose (100 mM), 5b (10 μM) and 5a (25 μM). Scale bar = 10 μm. (B) The graph reports the number of autophagosomes (yellow) and autophagolysomes (red) present in each cell. Data are expressed as mean ± S.E.; * p < 0.05, ** p < 0.01 vs. control, n = 10–15 for each experiment, 3 independent experiments. (C) The graph reports the percentage of autophagosomes (yellow) and autophagolysomes (red) present in each cell. Data are expressed as mean ± S.E.; * p < 0.05, ** p < 0.01 vs. control, n = 10–15 for each experiment, 3 independent experiments.

