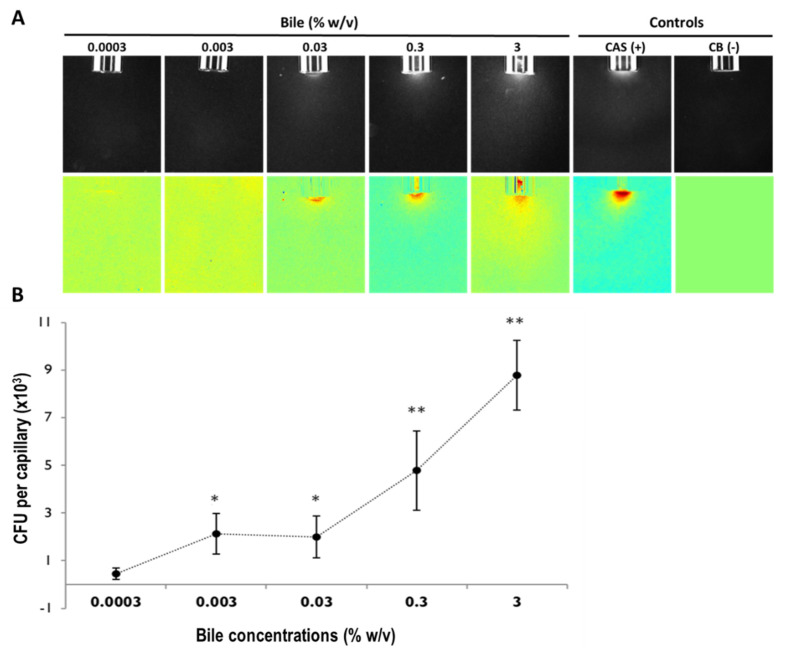
Figure 2.
Chemotaxis of P. aeruginosa PAO1 toward bovine bile in the absence of cystic fibrosis -derived bronchial epithelial (CFBE) cells using qualitative (A) and quantitative (B) microcapillary assays. (A) PAO1 chemoattraction towards bile (0.0003–3% w/v). Top panel: Dark-field images of bacterial cells gathered at the mouth of microcapillaries containing attractants at time 5 min. Below panel: Color map “jet” (MATLAB R2013b version 8.2; www.Mathworks.com, accessed on 5 September 2013) representing a normalization with the time 0 min for each treatment. The positive control (casamino acids, (0.2%, w/v) (CAS)) and the negative control (chemotaxis buffer (CB)) are shown for contrast. (B) Quantitative assay illustrating the concentration-response curve of P. aeruginosa PAO1 to bovine bile (0.0003–0.3% w/v) diluted in chemotaxis buffer. Results are averaged of at least 18 capillaries from 7 independent experiments. The results have been normalized with CB. (Results with no normalization have been illustrated in Supplementary Figure S2). Error bars indicate standard error. A comparison between the five concentrations of bile tested and the negative control is indicated by the ANOVA test (* 0.01 < p ≤ 0.05; ** p ≤ 0.01).

