

Abstract
Recent studies indicate that women with predominant estrogen metabolism through the 2-hydroxyl (inactive) pathway have lower bone mineral density (BMD) compared with those with predominant 16α-hydroxylation (active). Although many factors have been identified to affect estrogen metabolism, the role of a family history of osteoporosis remains unknown. The objective of this study was to investigate the influence of family history of osteoporosis and other clinical factors on estrogen hydroxylation. This was a cross-sectional study conducted in a university-based research center from May 2002 to February 2004. The participants included 175 otherwise healthy postmenopausal women at least 1 yr from the last menstrual period. Main outcome measures were urinary estrogen metabolites and BMD of the spine and femur. Women with a family history of osteoporosis had significantly higher log-transformed ratios of 2-hydroxyestrone/16α-hydroxyestrone (0.303 ± 0.03 vs. 0.226 ± 0.03; P = 0.04) and 2-methoxyestrone/16α-hydroxyestrone (0.024 ± 0.02 vs. −0.036 ± 0.02; P = 0.03) compared with women without family history. As expected, these women also had significantly lower BMD at the total femur, trochanter, and intertrochanter. Surprisingly, calcium intake positively correlated with metabolite levels, and women in the highest quartile of calcium intake had the highest levels of urinary metabolites. In conclusion, women with a positive family history of osteoporosis have predominant estrogen metabolism through the inactive 2-hydroxyl pathway; thus, the increased risk of osteoporosis in those with family history may in part be related to inherited differences in estrogen metabolism. The finding that calcium intake modulates estrogen hydroxylation has never been reported and thus deserves additional investigation
ESTROGEN IS CRUCIAL for maintaining bone homeostasis, as shown by rapid bone loss after surgical or natural menopause (1). Estrone (E1), the main form of estrogen in men and postmenopausal women (2, 3), is mainly derived from aromatization of the adrenal androgen, androstenedione, in adipose tissue (4). It can, in turn, undergo reversible conversion to estradiol (E2) by the enzyme 17β-hydroxysteroid dehydrogenase. The major metabolic pathway for E1 is the irreversible hydroxylation at either the C-2 or C-16α position (5, 6), which is catalyzed by the cytochrome P450 group of enzymes (7, 8). C-2 hydroxylation leads to the formation of 2-hydroxyestrone (2OHE1) and 2-methoxyestrone (2MeOE1), which not only are devoid of estrogenic activity, but possibly also have some antiestrogenic activity (9, 10). In contrast, the C-16α hydroxylation gives rise to 16α-hydroxyestrone (16αOHE1) and estriol (E3), which retain proestrogenic activity (11, 12). Because both pathways coexist, the dominance of one pathway over another will contribute to the overall estrogenic state in a given individual.
The recognition of estrogen metabolism as an important factor in the pathogenesis of hormone-related disorders has emerged not only from breast cancer studies, but recently, also from osteoporosis studies. Previous reports have shown that women with a higher 2OHE1/16αOHE1 ratio are at a reduced risk of breast cancer, presumably from a relatively weak estrogenic state (13). However, this subgroup of women is also at an increased risk of osteoporosis for the same reason (14, 15), whereas the converse is true when the 2OHE1/16αOHE1 ratio is low (14, 16). Because both breast cancer and osteoporosis are affected by estrogen metabolism, and both have a strong genetic component in their pathogenesis, we speculate that part of the genetic mechanism for these diseases is mediated through estrogen metabolism. In fact, a report had suggested that this might be the case for breast cancer (16). Women with a family history of breast cancer were found to have increased 16α-hydroxylation, which perhaps contributed to the increased incidence of breast cancer among these women (16). In contrast, no data are available on the effect of family history of osteoporosis on estrogen metabolism, and whether a positive family history of the condition may also be associated with an alteration in estrogen hydroxylation, as has been suggested for breast cancer.
The objective of this study, therefore, was to determine the influence of family history of osteoporosis on estrogen metabolism. We hypothesize that a positive family history of osteoporosis is associated with preferential metabolism of estrogen through the inactive 2-hydroxyl pathway. In addition, we analyze the influence of other clinical variables on estrogen metabolism in our subjects.
Subjects and Methods
Study population
This is a cross-sectional study conducted on community-dwelling, otherwise healthy women, who were at least 1 yr from the last menstrual period and were living in the St. Louis, MO, metropolitan area. Participants were recruited through advertisements or direct mailing. This study was conducted in accordance with the guidelines in the Declaration of Helsinki for the appropriate treatment of human subjects. The protocol was approved by the Washington University School of Medicine institutional review board, and written informed consent was obtained from each participant. Twenty-six women were participants in a previous related study (14), and the clinical and laboratory data for the women from that study were used in this study. Subjects who were taking any medication that affects bone metabolism, such as estrogen, selective estrogen receptor modulators (including raloxifene and tamoxifen), bisphosphonates (alendronate, risedronate, pamidronate, or zoledronate), aromatase inhibitors, GnRH analogs, glucocorticoids (>5 mg daily for >1 month), or phenytoin, were excluded from the study. Intake of medications known to affect estrogen hydroxylation (phytoestrogens, cimitidine, thyroid hormones, and monooxygenase inhibitors) and drugs known to affect cytochrome P450 enzyme activity were also exclusionary criteria, as were diseases or conditions known to interfere with bone metabolism, including hyperthyroidism, osteomalacia, chronic liver disease, renal failure, hypercortisolism, malabsorption, immobilization, and alcoholism. Current tobacco users were excluded. Past smokers who had stopped smoking for at least 6 months were allowed into the study. Subjects consuming more than one serving per day of vegetables containing high levels of phytochemicals known to preferentially enhance 2-hydroxylation of estrogen, such as cabbage, cauliflower, Brussels sprouts, broccoli, and kale (17), were excluded from participation.
Clinical, dietary, and anthropometric data
Dietary calcium and vitamin D intake were estimated from a 7-d dietary record, which was mailed to the participants at least 1 wk before the study visit. The record contains a list and serving sizes of common dietary sources of calcium. The participants were asked to record daily intake of these foodstuffs, and the average daily intake was determined for 7 d. Diet history also included intake of vegetables such as cabbage, cauliflower, Brussels sprouts, broccoli, and kale. Any subject consuming more than one serving per day of these vegetables was not allowed into the study for reasons cited above. Alcohol intake was expressed as the average number of alcoholic drink-equivalents consumed over a 1-wk period. A can of beer (336 ml), a glass of wine (112 ml), and 28 ml of a heavy alcoholic beverage were considered one drink-equivalent. Previous smoking was expressed in pack-years and was estimated as the number of 20-cigarette packs smoked per day multiplied by the number of years of smoking. Physical activity was expressed as a numerical score and was defined as: sedentary (sitting or lying most of the day, score 1), moderately active (being on feet more than half a day, score 2), and very active (engaging in regular physical exercise, score 3) (18).
Family history of osteoporosis was obtained through a questionnaire. A family history of osteoporosis was coded as positive in the presence of a blood relative (first and/or second degree, i.e. aunts and grandmothers) diagnosed with osteoporosis, kyphosis, and fragility fractures in the absence of secondary causes. Data on estrogen exposure were assessed through a number of variables, such as age at menarche, average number of periods per year during the reproductive years, number of years of birth control pill use (BCP), total number of pregnancies, number of pregnancies to term, months of lactation, age at menopause, and years since menopause (YSM). Body mass index (BMI) was calculated as weight in kilograms divided by the square of height in meters. The waist to hip ratio was calculated as the ratio between waist circumference, taken at the umbilical level, and hip circumference, measured 6 in. (15.24 cm) below the anterior superior iliac spine.
Biochemical data
Urinary estrogen metabolites were measured on a 24-h urine specimen using ESTRAMET immunoassay kits (Immuna Care Corp., Bethlehem, PA). The ESTRAMET series of test kits are monoclonal antibody-based competitive enzyme immunoassays for estrogen metabolites in microtiter plate format. The antibodies and assays for urinary 2- and 16α-hydroxyestrogen have been described previously (19). The monoclonal antibody to 2-hydroxyestrogens recognizes the 2-hydroxy forms of E1, E2, and E3 equivalently. Similarly, the monoclonal antibody to 2-methoxyestrogens recognizes the 2-methoxy forms of estrogen metabolites equivalently and exhibits less than 0.1% cross-reactivity with any other estrogen, including 2-hydroxyestrogens. The monoclonal antibody to E3 exhibited less than 2% cross-reactivity with any other estrogen. All urinary estrogen assays were performed according to methods described previously (14). Briefly, urine samples were incubated with enzymes that deconjugated estrogen metabolite sulfates and glucuronides to their respective free forms. The amount of estrogen metabolite in the enzymic hydrolysate was determined by competition between deconjugated estrogen in the hydrolysate and estrogen-labeled alkaline phosphatase for binding to specific monoclonal antibodies attached to the microtiter plate. More than 90% of the metabolites in urine exist as glucuronides and are recovered totally by this method. The inter-and intraassay coefficients of variability for these ELISAs were less than 9% and 13%, respectively. Each urinary metabolite value was corrected for 24-h urinary creatinine (Cr; milligrams per 24 h) and expressed as nanograms per milligram of Cr.
Serum samples were collected in the nonfasting state. Serum E2 was measured by an ultrasensitive RIA technique (Diagnostic Systems Laboratory, Webster, TX). The inter- and intraassay coefficients of variability for this assay are less than 10%.
Bone mineral density (BMD)
The BMDs of lumbar spine and proximal femur were measured by dual energy x-ray absorptiometry using a Hologic QDR 4500 (Hologic, Inc., Waltham MA). BMD of the lumbar spine was determined using the antero-posterior projection and was calculated as the average of L1–L4 vertebrae. The nondominant hip was used for proximal femur scans, and values were calculated on the total femur, femoral neck, trochanter, and intertrochanteric areas. BMD values were expressed as grams per square centimeter. The coefficient of variability of this technique using the QDR 4500 densitometer is 1.09% for lumbar spine and 1.2% for total femur in our center.
Statistical analysis
Results are expressed as the mean ± se. P < 0.05 was considered statistically significant. The association between BMD and clinical variables with each metabolite, metabolite ratios (2OHE1/16αOHE1 and 2MeOE1/16αOHE1), and total metabolites (2OHE1+2MeOE1 + 16αOHE1+E3) were evaluated by linear regression analysis. Clinical variables found to have a significant correlation with the metabolites and determined to be significantly different between those with and without a family history of osteoporosis (e.g. age and YSM) were used as covariates when comparing urinary metabolite values. Values for urinary metabolites were not normally distributed and therefore were log transformed. The log-transformed metabolite values were then used in the ANOVA to compare subjects with and without a family history of osteoporosis adjusted for covariates such as age and YSM. BMD (grams per square centimeter) comparisons between groups were also analyzed by ANOVA adjusted for age, YSM, and BMI, whereas urinary metabolite comparisons in the different quartiles of calcium intake were analyzed using unadjusted ANOVA. Differences in clinical features were compared using a t test for continuous variables (e.g. age and BMI) and a χ2 test for categorical variables (e.g. family history of osteoporosis) as appropriate. Data were managed using Excel 2000 (Microsoft Corp., Redmond, WA) and were analyzed using Statgraphic Plus 5.0 (Manugistic, Inc., Rockville, MD).
Results
One hundred ninety-nine postmenopausal women participated in the study. Data on family history of osteoporosis were available for 194 women; four participants did not provide any information on family history. Ten women were African-Americans, nine were Asians, and the rest (175) were Caucasians. Because racial differences in BMD and estrogen metabolism are known to exist, the analysis presented in this report only includes that of Caucasian women, because the limited number of minority participants precludes meaningful interpretation. Bone density measurements were available for all 175 Caucasian participants, and 48% (84 of 175) of these women had a positive family history of osteoporosis (67 from a first-degree relative and 17 from a second-degree relative). However, urinary metabolites values were available in only 156 of these women. The clinical features of the Caucasian participants are given in Table 1. Women with a family history of osteoporosis were younger and earlier in postmenopausal status than women without a family history of osteoporosis. As expected, these women had significantly lower adjusted mean BMDs (Table 1), mainly in the total femur (P = 0.002), trochanter (P = 0.014), and intertrochanter (P = 0.001). Simple correlation analysis between BMD and urinary metabolites is shown in Table 2. Significant inverse correlations were observed between urinary E3 and total metabolites (2OHE1, 2MeOE1, 16αOHE1, and E3) with total femur and intertrochanteric BMD, and between 2MeOE1/16αOHE1 and spine BMD (all P < 0.05). A borderline negative correlation was also observed between 2OHE1 and 2OHE1/16αOHE1 with trochanteric BMD (r =−0.16; P = 0.05 for both).
TABLE 1.
Clinical and bone density data on Caucasian postmenopausal women (n = 175)
| Clinical features | Family history of osteoporosis (n = 84) | No family history of osteoporosis (n = 91) | P valuea |
|---|---|---|---|
| Age (yr) | 62.6 ± 0.9 | 65.4 ± 0.8 | 0.02 |
| BMI (kg/m2) | 27.2 ± 0.6 | 28.2 ± 0.5 | 0.24 |
| W/H ratio | 0.81 ± 0.01 | 0.83 ± 0.01 | 0.08 |
| YSM (yr) | 11.7 ± 1.2 | 15.3 ± 1.1 | 0.03 |
| Lactation (months) | 7.0 ± 2.1 | 4.3 ± 2.0 | 0.34 |
| BCP use (yr) | 5.7 ± 1.6 | 3.2 ± 1.5 | 0.22 |
| History of smoking | |||
| % Past smokers | 43.4% | 42.2% | 0.86 |
| Total past smoking (pack-years) | 7.6 ± 1.8 | 8.6 ± 1.7 | 0.70 |
| Alcohol intake (oz-Eq) | 1.5 ± 0.3 | 1.47 ± 0.3 | 0.89 |
| Calcium intake (mg/d) | 1179 ± 76 | 1084 ± 70 | 0.36 |
| Physical activity score | 2.33 ± 0.07 | 2.30 ± 0.06 | 0.72 |
| BMD (g/cm2) | |||
| Spine | 0.941 ± 0.02 | 0.945 ± 0.01 | 0.84 |
| Total hip | 0.831 ± 0.01 | 0.884 ± 0.01 | 0.002 |
| Femoral neck | 0.697 ± 0.01 | 0.727 ± 0.01 | 0.055 |
| Trochanteric | 0.632 ± 0.01 | 0.667 ± 0.01 | 0.014 |
| Intertrochanteric | 0.995 ± 0.02 | 1.065 ± 0.01 | 0.001 |
Values are the mean ± SE. W/H ratio, Waist/hip ratio.
Determined by ANOVA adjusted for age, YSM, and BMI for BMD comparisons.
TABLE 2.
Simple correlation (r) between urinary metabolites and BMD (grams per square centimeter) in healthy postmenopausal Caucasian women (n = 156)
| Spine | Total femur | Femoral neck | Trochanter | Intertrochanteric | |
|---|---|---|---|---|---|
| 2OHE1 | −0.001 | −0.13 | −0.04 | −0.16 | −0.13 |
| 2MeOE1 | −0.07 | −0.11 | −0.10 | −0.13 | −0.11 |
| 16αOHE1 | 0.05 | −0.10 | −0.11 | −0.07 | −0.09 |
| E3 | 0.05 | −0.19a | −0.16 | −0.09 | −0.22a |
| 2OHE1/16αOHE1 | −0.07 | −0.09 | 0.02 | −0.16 | −0.08 |
| 2MeOE1/16aOHE1 | −0.18a | −0.08 | 0.06 | −0.14 | 0.06 |
| 2OHE1, + 2MeOE1 + 16αOHE1 + E3 | −0.03 | −0.18a | −0.13 | −0.15 | −0.19a |
P < 0.05.
Analysis of the effect of family history of osteoporosis on urinary metabolites (Table 3) showed that women with a family history of osteoporosis had significantly higher log-transformed ratios of 2OHE1/16αOHE1 (0.303 ± 0.03 vs. 0.226 ± 0.03; P = 0.04) and 2MeOE1/16αOHE1 (0.024 ± 0.02 vs. −0.036 ± 0.02; P = 0.03) than women without a family history of osteoporosis. Meanwhile, the absolute levels of each metabolite, total metabolites, and the serum estradiol were comparable between the two groups.
TABLE 3.
Urinary metabolites and serum E2 of Caucasian postmenopausal women stratified according to family history of osteoporosis
| Urinary metabolites, metric units, ng/mg Cr [range] (SI units, μmol/mol Cr) | Untransformed values | Log-transformed values | P a | ||
|---|---|---|---|---|---|
| Family history (n = 77) | No family history (n = 79) | Family history (n = 77) | No family history (n = 79) | ||
| 2OHE1 | 8.19 ± 0.55 | 7.83 ± 0.53 | 0.839 ± 0.03 | 0.824 ± 0.03 | 0.73 |
| [0.34–26.14] | [1.61–24.41] | ||||
| (3.19 ± 0.21) | (3.09 ± 0.21) | ||||
| 2MeOE1 | 4.20 ± 0.27 | 4.09 ± 0.27 | 0.562 ± 0.03 | 0.551 ± 0.03 | 0.77 |
| [0.47–12.77] | [0.92–10.66] | ||||
| (1.62 ± 0.11) | (1.65 ± 0.11) | ||||
| 16αOHE1 | 4.18 ± 0.32 | 4.46 ± 0.31 | 0.538 ± 0.03 | 0.580 ± 0.03 | 0.34 |
| [0.44–14.84] | [1.42–18.99] | ||||
| (1.63 ± 0.12) | (1.76 ± 0.12) | ||||
| E3 | 7.30 ± 0.95 | 7.37 ± 0.91 | 0.783 ± 0.03 | 0.734 ± 0.03 | 0.31 |
| [1.07–22.67] | [0.87–14.92] | ||||
| (2.82 ± 0.37) | (2.89 ± 0.36) | ||||
| 2OHE1/16αOHE1 | 2.28 ± 0.13 | 1.19 ± 0.13 | 0.303 ± 0.03 | 0.226 ± 0.03 | 0.04 |
| [0.53–7.48] | [0.33–4.84] | ||||
| 2.26 ± 0.14 | 1.98 ± 0.14 | ||||
| 2MeOE1/16αOHE1 | 1.13 ± 0.05 | 1.00 ± 0.05 | 0.024 ± 0.02 | −0.036 ± 0.02 | 0.03 |
| [0.36–3.51] | [0.23–2.24] | ||||
| 6.32 ± 0.77 | 6.06 ± 0.76 | ||||
| Total metabolites | 23.88 ± 1.66 | 23.74 ± 1.60 | 1.32 ± 0.03 | 1.31 ± 0.03 | 0.75 |
| [2.67–56.86] | [5.96–63.45] | ||||
| (9.29 ± 0.64) | (9.37 ± 0.63) | ||||
| Serum E2 (pg/ml) (SI, pmol/liter) | 13.80 ± 0.70 | 15.07 ± 0.61 | |||
| (52.20 ± 2.54) | (54.43 ± 2.22) | 0.17 | |||
The molecular weight of the different metabolites used in the conversion to SI units is as follows: 2OHE1 and 16αOHE1, 286.4; 2MeOE1, 284.4; and E3, 288.4. The conversion factors for urinary Cr and serum E2 are 88.4 and 3.671, respectively. Values are the mean ± SE [range].
Determined by ANOVA adjusted for age and YSM for urinary metabolite comparisons.
The influence of different factors on estrogen metabolism was analyzed by simple correlation analysis. The results are summarized in Table 4. Positive correlations between age and 2MeOE1 level or 2MeOE1/16αOHE1 ratio and between YSM or 2MeOE1/16αOHE1 ratio were observed. In contrast, negative correlations were observed for BMI with 2OHE1, 2MeOE1, E3, 2MeOE1/16αOHE1, and total metabolites, and for waist to hip ratio with 2OHE1, 2MeOE1, E3, and total metabolites. Surprisingly, increasing calcium intake was associated with proportionate increases in the absolute levels of most urinary metabolites (with the exception of urinary E3) and total metabolites. This relationship is well illustrated (Fig. 1) after dividing the average daily calcium intake into quartiles; quartile 1, less than 500 mg/d; quartile 2, 501–1000 mg/d; quartile 3, 1001–1500 mg/d; and quartile 4, more than 1500 mg/d. Women in the lowest quartile of calcium intake had the lowest levels of urinary 2MeOE1, 16αOHE1, 2OHE1, and total metabolites; levels increase with increasing quartiles, with the highest quartile having the highest levels of these metabolites. This correlation with calcium intake, however, was not seen with 2OHE1/16αOHE1 and 2MeOE1/16αOHE1 ratios. Based on the source of calcium, we also categorized women into those taking calcium supplements only, those with dietary sources only, and those with both. Women whose calcium intake came only from supplements had lower total urinary metabolite levels than women whose calcium intake came predominantly from dietary sources with or without supplements (17.09 ± 2.87, 25.0 ± 1.39, and 23.67 ± 1.86 ng/mg Cr, respectively; P < 0.05). A positive correlation between calcium intake and metabolites was observed only for those on dietary calcium sources (r = 0.30; P = 0.03). There was no difference in average calcium intake between those with only dietary calcium sources (742.3 ± 72.7 mg/d) and those taking calcium supplements only (714.8 ± 128.4 mg/dl), whereas those with both dietary and supplemental calcium intake, as expected, had a higher average calcium intake (1491.0 ± 54.3 mg/d).
TABLE 4.
Clinical variables affecting urinary estrogen metabolites
| 2OHE1 | 2MeOE1 | 16OHE1 | E3 | 2OH/16OH | 2MeO/16OH | Total metabolites | |
|---|---|---|---|---|---|---|---|
| Age | 0.10 | 0.19a | 0.01 | 0.02 | −0.002 | 0.17a | 0.08 |
| YSM | 0.06 | 0.08 | −0.10 | 0.01 | 0.08 | 0.19a | 0.02 |
| Lactation (months) | 0.15 | 0.004 | −0.003 | −0.03 | 0.14 | 0.003 | 0.03 |
| BCP use (yr) | −0.09 | −0.05 | −0.02 | −0.06 | −0.03 | −0.01 | −0.07 |
| BMI | −0.30a | −0.29a | −0.13 | −0.20a | −0.16 | −0.20a | −0.29a |
| W/H ratio | −0.22a | −0.21a | −0.12 | −0.17a | −0.13 | −0.03 | −0.23a |
| Past smoking (pack-years) | 0.01 | −0.03 | 0.03 | −0.07 | 0.10 | 0.04 | −0.04 |
| Alcohol intake (oz-Eq) | −0.10 | −0.02 | −0.02 | 0.05 | −0.08 | 0.05 | −0.01 |
| Calcium intake (mg/d) | 0.26a | 0.32a | 0.18a | 0.14 | −0.07 | 0.13 | 0.26a |
W/H ratio, Waist/hip ratio.
P < 0.05 by simple correlation analysis.
FIG. 1.
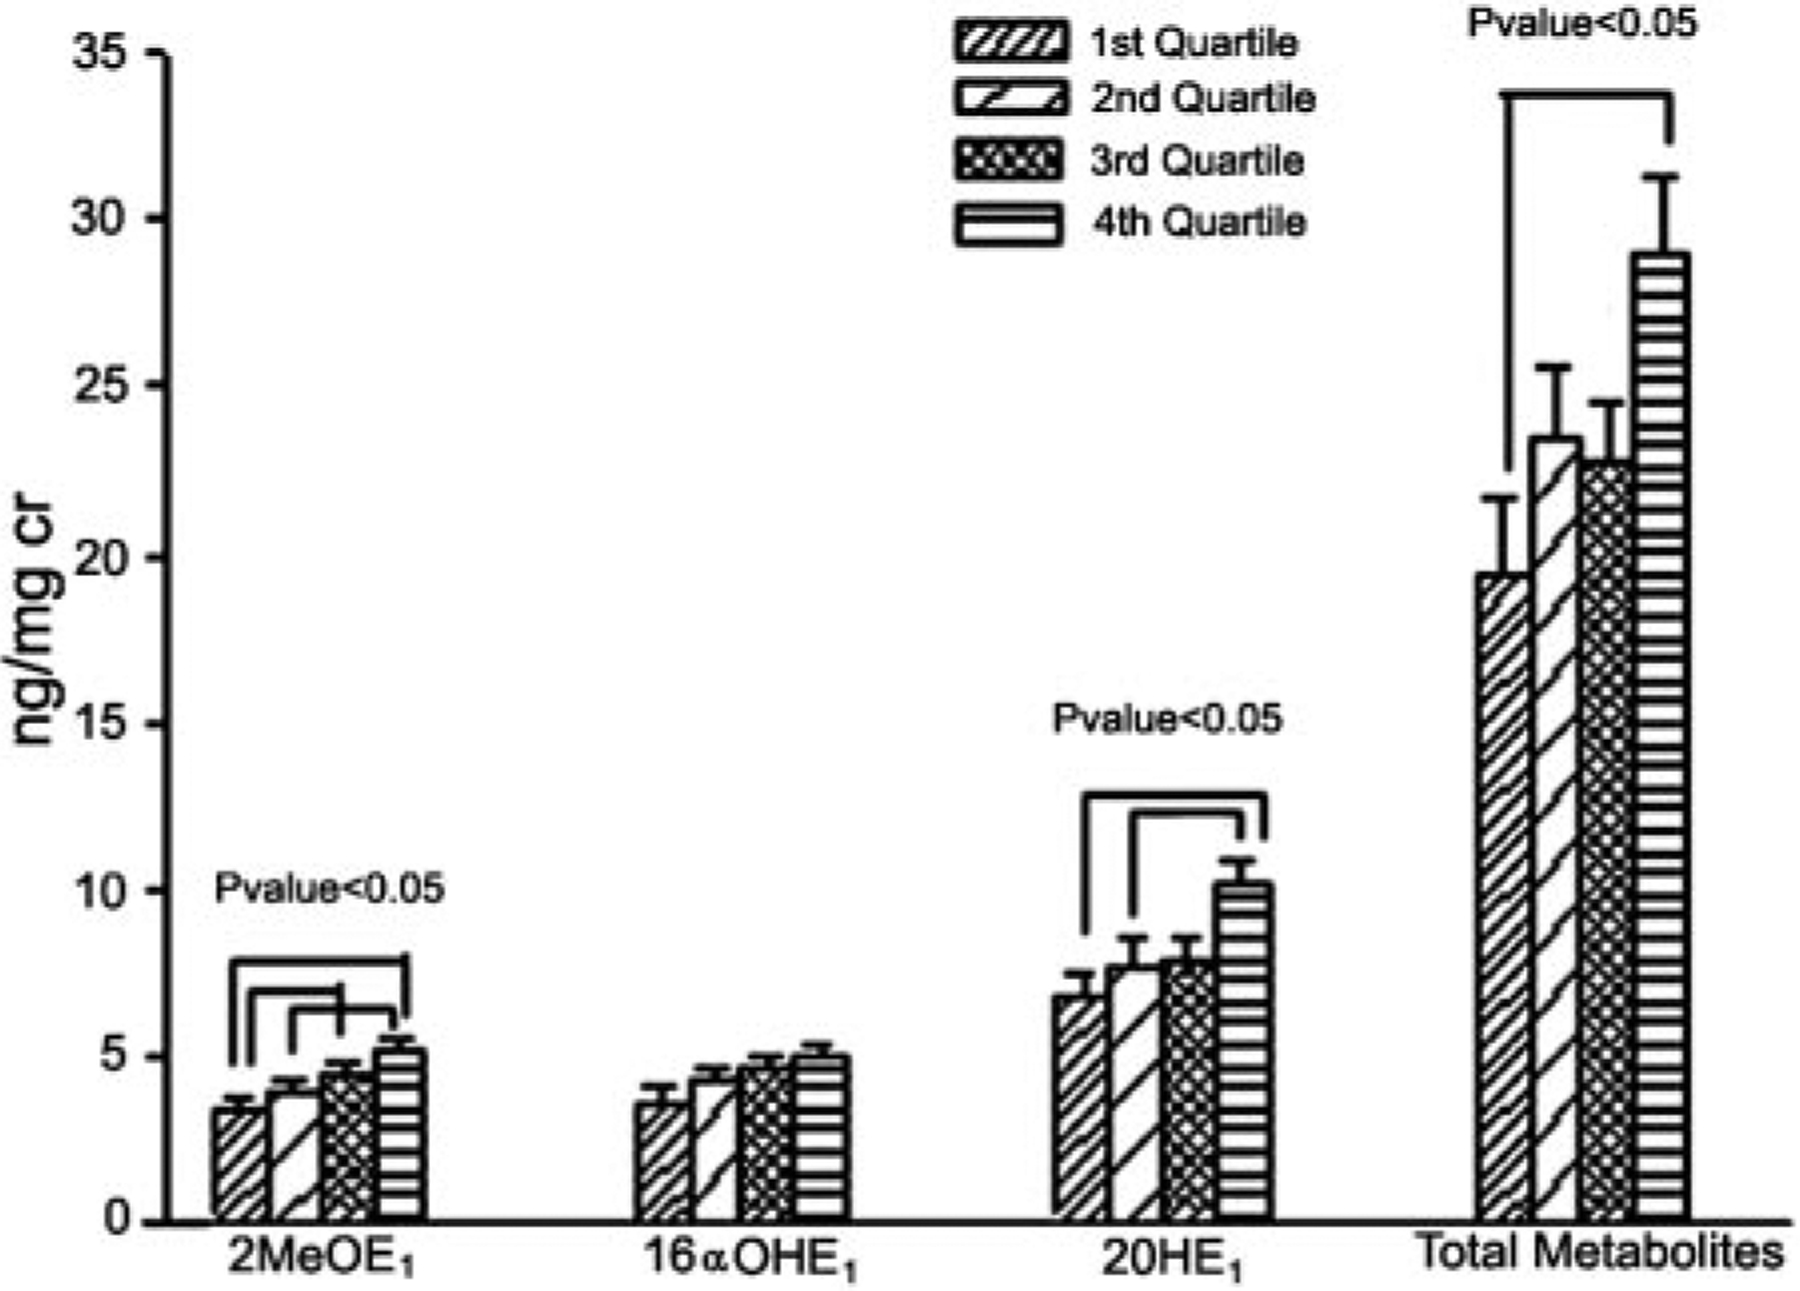
Levels of urinary metabolites stratified according to quartiles of average daily calcium intake (milligrams per day). Each group represents the different quartiles of 2OHE1, 2MeOE1, 16OHE1, and total metabolites, from the lowest to the highest (left to right). Quartile va1ues for calcium intake: quartile 1, less than 500; quartile 2, 501–1000; quartile 3, 1001–1500; and quartile 4, greater than 1500. P < 0.05, by ANOVA.
There were no significant associations between alcohol consumption, past smoking (pack-years), length of past BCP, and lactation history with urinary metabolites.
Discussion
Our results show that women with a family history of osteoporosis have predominant estrogen metabolism through the 2-hydroxyl pathway, as indicated by higher 2OHE1/16αOHE1 and 2MeOE1/16αOHE1 ratios. This finding is in agreement with our hypothesis that women with a family history of osteoporosis have prevalent estrogen metabolism through the inactive pathway, a condition that may result in a lifelong state of relative estrogen deficiency and lower bone density among these women. Accordingly, our study supported this concept by showing that this subgroup of women also has lower BMD, involving mainly various anatomical sites of the hip.
One of the earlier reports on the physiological relevance of estrogen hydroxylation on bone density came from our group (14). We demonstrated that women in the lowest quartile of 2OHE1/16αOHE1 ratio were protected from bone loss over a 1-yr period of follow-up. In addition, higher urinary levels of 2OHE1 and 2MeOE1 were associated with lower BMD in the lumbar spine and proximal femur. A similar conclusion was drawn by Lim et al. (15) in a study of Korean women, although technical problems limit the validity of that particular study. In the current study a similar negative association between BMD and the degree of 2-hydroxylation was observed, i.e. those with higher ratios of 2MeOE1/16αOHE1 and, to some extent, 2OHE1/16αOHE1 have lower BMD.
The importance of family history as a determinant of estrogen metabolism was first investigated in the context of breast cancer (16). In a small study of postmenopausal women, Osborne et al. (16) observed an increase in 16α-hydroxylation in women with a family history of breast cancer. In contrast, a study of premenopausal women did not show any difference in the pattern of hydroxylation between those with and those without a family history of breast cancer (20). These discrepancies, however, could be the result of ethnic and age differences in the population under investigation. Nevertheless, by showing that women with a family history of osteoporosis have increased 2-hydroxylation, our results lend support to the idea that estrogen metabolism is influenced by family history. Furthermore, these findings may advance the concept that the hereditary nature of both breast cancer and osteoporosis is partially mediated through inherited patterns of estrogen hydroxylation.
A family history of osteoporosis is considered one the most important risk factors for this problem (18, 21, 22). A previous study showed that nearly half of the women with idiopathic osteoporosis had a positive family history of osteoporosis (22). Daughters of osteoporotic mothers were also found to have lower BMD and, therefore, were more prone to develop osteoporosis than daughters of nonosteoporotic mothers (21). In agreement with previous reports, our study showed that women with a positive family history indeed had low BMD at different anatomical sites of the proximal femur. Although no difference in BMD of the spine was observed, the failure to see a difference may reflect the effect of degenerative changes on dual energy x-ray absorptiometry measurements in the spine (23), considering that most of our subjects were elderly (mean age, >60 yr). Because estrogen metabolism is a lifelong process, we speculate that women with a family history of osteoporosis have lifelong relative estrogen deficiency, a risk factor for low peak bone density, and accelerated bone loss at menopause.
There are several candidate genes implicated in the pathogenesis of osteoporosis. The list of candidate genes evaluated to date consists of all of the main calciotropic hormones, enzymes involved in steroid hormone biosynthesis, hormone receptors, local growth factors, and cytokines and their receptors (24). Recently, the gene for lipoprotein receptor-related protein-5 has been added to this list of candidate genes. Gain of function mutations of this gene are associated with high bone mass (25), whereas loss of function mutations lead to osteoporosis (26). Similarly, a few cases of single gene mutations, such as the loss of function mutations of aromatase (27) or estrogen receptor α (28), result in rare cases of osteoporosis. Notwithstanding the overabundance of association studies available, not one of these genes has emerged as a lone determinant of bone mass, and osteoporosis is still considered a polygenic disorder. Because estrogen is metabolized by the cytochrome P450 enzyme system (8), genes coding for these enzymes are additional possible candidate genes for investigation. Potentially, polymorphism of these genes could result in an alteration in enzyme kinetics and may be responsible for the shift in the balance toward increased 2-hydroxylation of estrogen in subjects with family history of osteoporosis.
We also examined other factors that may influence estrogen metabolism. Similar to our previous findings (14), a negative correlation exists between BMI and urinary metabolites, more importantly, with the 2MeOE1/16αOHE1 ratio. The mechanism for this observation was previously evaluated by Schneider et al. (29). Using tracer E2, these investigators found that obese individuals had a significant decrease in C-2 hydroxylation, without a change in 16α-hydroxylation, compared with age-matched, normal weight controls (29). This proestrogenic ratio created by increased body weight may contribute to the already hyperestrogenic environment generated by increased aromatization of adrenal androgens in adipocytes (30) and the decreased concentrations of SHBG in obese women (31). This hyperestrogenic environment is, in fact, one of the mechanisms cited for why obese women are protected from osteoporosis (32), but are at increased risk for breast cancer (33).
We also found that higher calcium intake is associated with higher urinary estrogen metabolites. There are several factors identified to modulate estrogen metabolism. Smoking (34) and an increase in dietary phytochemicals (17) are associated with increased 2-hydroxylation. Certain medications, such as cimetidine (35) and thyroid hormones (36), are also reported to affect estrogen metabolism. Nevertheless, to our knowledge, no effect has been reported for calcium. Our findings suggest that calcium induces both 2- and 16α-hydroxylation, leading to a generalized increase in the products of both pathways. Alternatively, it may be argued that increased calcium intake leads to enhanced clearance of these metabolites in the urine. Because serum metabolite measurements are not available for our subjects, this putative mechanism remains debatable. In contrast, the significant positive correlation between calcium intake and urinary metabolites was mainly observed in subjects whose calcium intake came from dietary sources. Although we carefully excluded women taking medications and those with dietary and lifestyle habits identified to affect estrogen hydroxylation, there may be other food items, probably in the form of dietary calcium sources, that modulate estrogen metabolism.
We realize the limitation of our study in that information on family history of osteoporosis was based solely on the patient’s recall and thus was subject to possible gaps in memory. In addition, the subjects in our study came from a wide range of age and YSM, both of which have been known to influence estrogen metabolism. Our analyses, however, were adjusted for these potential confounding variables.
In summary, our results indicate that women with a family history of osteoporosis are predisposed to the condition partly because of increased estrogen metabolism through the inactive 2-hydroxyl pathway. Whether this alteration is inherited remains uncertain, because we have no data on estrogen metabolism among family members who had or did not have osteoporosis. However, our findings suggest that these women may benefit from avoiding factors, such as lifestyle and dietary habits as well as drugs, that would modulate estrogen metabolism through the inactive pathway if the goal is to maximize peak bone density and minimize or prevent menopause-related bone loss. They may also represent the population of women who might benefit from drug targeting intended to shift estrogen metabolism through the active 16α-hydroxyl pathway. To our knowledge, our study is the first to report the effect of family history of osteoporosis on estrogen metabolism; thus, additional studies are needed to confirm our findings.
Acknowledgments
We thank Drs. Roberto Civitelli and Dwight Towler for their mentorship, and Dr. Thomas Klug for assessing all urinary metabolites.
This work was supported by NIH Grants R03-AR-049401 (to R.A.-V.) and K12-HD-01459 (Building Interdisciplinary Research Careers in Women’s Health).
Abbreviations:
- BCP
Birth control pill use
- BMD
bone mineral density
- BMI
body mass index
- Cr
creatinine
- E1
estrone
- E2
estradiol
- E3
estriol
- 2MeOE1
2-methoxyestrone
- 2OHE1
2-hydroxyestrone
- 16αOHE1
16α-hydroxyestrone
- YSM
years since menopause
Footnotes
This work was presented in part as an oral presentation at the 86th Annual Meeting of The Endocrine Society, New Orleans, LA, June 16–19, 2004.
References
- 1.Riggs BL, Melton III LJ 1986. Involutional osteoporosis. N Engl J Med 314: 1676–1686 [DOI] [PubMed] [Google Scholar]
- 2.Longcope C, Kato T, Horton R 1969. Conversion of blood androgens to estrogens in normal adult men and women. J Clin Invest 48:2191–2201 [DOI] [PMC free article] [PubMed] [Google Scholar]
- 3.Grodin JM, Siiteri PK, MacDonald PC 1973. Source of estrogen production in postmenopausal women. J Clin Endocrinol Metab 36:207–214 [DOI] [PubMed] [Google Scholar]
- 4.Forney JP, Milewich L, Chen GT, Garlock JL, Schwarz BE, Edman CD, MacDonald PC 1981. Aromatization of androstenedione to estrone by human adipose tissue in vitro: correlation with adipose tissue mass, age, and endometrial neoplasia. J Clin Endocrinol Metab 53:192–199 [DOI] [PubMed] [Google Scholar]
- 5.Fishman J, Bradlow HL, Gallagher TF 1960. Oxidative metabolism of estradiol. J Biol Chem 235:3104–3107 [PubMed] [Google Scholar]
- 6.Adlercreutz H, Gorbach SL, Goldin BR, Woods MN, Dwyer JT, Hamalainen E 1994. Estrogen metabolism and excretion in Oriental and Caucasian women. J Natl Cancer Inst 86:1076–1082 [DOI] [PubMed] [Google Scholar]
- 7.Yamazaki H, Shaw PM, Guengerich FP, Shimada T 1998. Roles of cytochromes P450 1A2 and 3A4 in the oxidation of estradiol and estrone in human liver microsomes. Chem Res Toxicol 11:659–665 [DOI] [PubMed] [Google Scholar]
- 8.Badawi AF, Cavalieri EL, Rogan EG 2001. Role of human cytochrome P450 1A1, 1A2, 1B1, and 3A4 in the 2-, 4-, and 16α-hydroxylation of 17β-estradiol. Metabolism 50:1001–1003 [DOI] [PubMed] [Google Scholar]
- 9.Bradlow HL, Telang NT, Sepkovic DW, Osborne MP 1996. 2-Hydroxyestrone: the ‘good’ estrogen. J Endocrinol 150(Suppl):S259–S265 [PubMed] [Google Scholar]
- 10.Schneider J, Huh MM, Bradlow HL, Fishman J 1984. Antiestrogen action of 2-hydroxyestrone on MCF-7 human breast cancer cells. J Biol Chem 259:4840–4845 [PubMed] [Google Scholar]
- 11.Westerlind KC, Gibson KJ, Malone P, Evans GL, Turner RT 1998. Differential effects of estrogen metabolites on bone and reproductive tissues of ovariectomized rats. J Bone Miner Res 13:1023–1031 [DOI] [PubMed] [Google Scholar]
- 12.Lippert TH, Seeger H, Mueck AO 2000. The impact of endogenous estradiol metabolites on carcinogenesis. Steroids 65:357–369 [DOI] [PubMed] [Google Scholar]
- 13.Muti P, Bradlow HL, Micheli A, Krogh V, Freudenheim JL, Schunemann HJ, Stanulla M, Yang J, Sepkovic DW, Trevisan M, Berrino F 2000. Estrogen metabolism and risk of breast cancer: a prospective study of the 2:16α-hydroxyestrone ratio in premenopausal and postmenopausal women. Epidemiology 11:635–640 [DOI] [PubMed] [Google Scholar]
- 14.Leelawattana R, Ziambaras K, Roodman-Weiss J, Lyss C, Wagner D, Klug T, Armamento-Villareal R, Civitelli R 2000. The oxidative metabolism of estradiol conditions postmenopausal bone density and bone loss. J Bone Miner Res 15:2513–2520 [DOI] [PubMed] [Google Scholar]
- 15.Lim SK, Won YJ, Lee JH, Kwon SH, Lee EJ, Kim KR, Lee HC, Huh KB, Chung BC 1997. Altered hydroxylation of estrogen in patients with postmenopausal osteopenia. J Clin Endocrinol Metab 82:1001–1006 [DOI] [PubMed] [Google Scholar]
- 16.Osborne MP, Bradlow HL, Wong GY, Telang NT 1993. Upregulation of estradiol C16 α-hydroxylation in human breast tissue: a potential biomarker of breast cancer risk. J Natl Cancer Inst 85:1917–1920 [DOI] [PubMed] [Google Scholar]
- 17.Michnovicz JJ, Adlercreutz H, Bradlow HL 1997. Changes in levels of urinary estrogen metabolites after oral indole-3-carbinol treatment in humans. J Natl Cancer Inst 89:718–723 [DOI] [PubMed] [Google Scholar]
- 18.Armamento-Villareal R, Villareal DT, Avioli LV, Civitelli R 1992. Estrogen status and heredity are major determinants of premenopausal bone mass. J Clin Invest 90:2464–2471 [DOI] [PMC free article] [PubMed] [Google Scholar]
- 19.Klug TL, Bradlow HL, Sepkovic DW 1994. Monoclonal antibody-based enzyme immunoassay for simultaneous quantitation of 2- and 16α-hydroxyestrone in urine. Steroids 59:648–655 [DOI] [PubMed] [Google Scholar]
- 20.Ursin G, London S, Yang D, Tseng CC, Pike MC, Bernstein L, Stancyzk FZ, Gentzschein E 2002. Urinary 2-hydroxyestrone/16α-hydroxyestrone ratio and family history of breast cancer in premenopausal women. Breast Cancer Res Treat 72:139–143 [DOI] [PubMed] [Google Scholar]
- 21.Seeman E, Hopper JL, Bach LA, Cooper ME, Parkinson E, McKay J, Jerums G 1989. Reduced bone mass in daughters of women with osteoporosis. N Engl J Med 320:554–558 [DOI] [PubMed] [Google Scholar]
- 22.Peris P, Guanabens N, Martinez de Osaba MJ, Monegal A, Alvarez L, Pons F, Ros I, Cerda D, Munoz-Gomez J 2002. Clinical characteristics and etiologic factors of premenopausal osteoporosis in a group of Spanish women. Semin Arthritis Rheum 32:64–70 [DOI] [PubMed] [Google Scholar]
- 23.Liu G, Peacock M, Eilam O, Dorulla G, Braunstein E, Johnston CC 1997. Effect of osteoarthritis in the lumbar spine and hip on bone mineral density and diagnosis of osteoporosis in elderly men and women. Osteoporos Int 7:564–569 [DOI] [PubMed] [Google Scholar]
- 24.Gong G, Haynatzki G 2003. Association between bone mineral density and candidate genes in different ethnic populations and its implications. Calcif Tissue Int 72:113–123 [DOI] [PubMed] [Google Scholar]
- 25.Boyden LM, Mao J, Belsky J, Mitzner L, Farhi A, Mitnick MA, Wu D, Insogna K, Lifton RP 2002. High bone density due to a mutation in LDL-receptor-related protein 5. N Engl J Med 346:1513–1521 [DOI] [PubMed] [Google Scholar]
- 26.Gong Y, Vikkula M, Boon L, Liu J, Beighton P, Ramesar R, Peltonen L, Somer H, Hirose T, Dallapiccola B, De Paepe A, Swoboda W, Zabel B, Superti-Furga A, Steinmann B, Brunner HG, Jans A, Boles RG, Adkins W, van den Boogaard MJ, Olsen BR, Warman ML 1996. Osteoporosis-pseudoglioma syndrome, a disorder affecting skeletal strength and vision, is assigned to chromosome region 11q12–13. Am J Hum Genet 59:146–151 [PMC free article] [PubMed] [Google Scholar]
- 27.Morishima A, Grumbach MM, Simpson ER, Fisher C, Qin K 1995. Aromatase deficiency in male and female siblings caused by a novel mutation and the physiological role of estrogens. J Clin Endocrinol Metab 80:3689–3698 [DOI] [PubMed] [Google Scholar]
- 28.Smith EP, Boyd J, Frank GR, Hiroyuki T, Cohen RM, Specker B, Williams TC, Lubahn DB, Korach KS 1994. Estrogen resistance caused by a mutation in the estrogen-receptor gene in a man. N Engl J Med 331:1056–1061 [DOI] [PubMed] [Google Scholar]
- 29.Schneider J, Bradlow HL, Strain G, Levin J, Anderson K, Fishman J 1983. Effects of obesity on estradiol metabolism: decreased formation of nonuterotropic metabolites. J Clin Endocrinol Metab 56:973–978 [DOI] [PubMed] [Google Scholar]
- 30.Longcope C, Baker RS, Johnston CC Jr 1986. Androgen and estrogen metabolism: relationship to obesity. Metabolism 35:235–237 [DOI] [PubMed] [Google Scholar]
- 31.Potischman N, Hoover RN, Brinton LA, Siiteri P, Dorgan JF, Swanson CA, Berman ML, Mortel R, Twiggs LB, Barrett RJ, Wilbanks GD, Persky V, Lurain JR 1996. Case-control study of endogenous steroid hormones and endometrial cancer. J Natl Cancer Inst 88:1127–1135 [DOI] [PubMed] [Google Scholar]
- 32.Albala C, Yanez M, Devoto E, Sostin C, Zeballos L, Santos JL 1996. Obesity as a protective factor for postmenopausal osteoporosis. Int J Obes Relat Metab Disord 20:1027–1032 [PubMed] [Google Scholar]
- 33.Bianchini F, Kaaks R, Vainio H 2002. Overweight, obesity, and cancer risk. Lancet Oncol 3:565–574 [DOI] [PubMed] [Google Scholar]
- 34.Michnovicz JJ, Hershcopf RJ, Naganuma H, Bradlow HL, Fishman J 1986. Increased 2-hydroxylation of estradiol as a possible mechanism for the antiestrogenic effect of cigarette smoking. N Engl J Med 315:1305–1309 [DOI] [PubMed] [Google Scholar]
- 35.Galbraith RA, Michnovicz JJ 1989. The oxidative metabolism of estradiol: inhibition by cimetidine. Trans Assoc Am Phys 102:44–54 [PubMed] [Google Scholar]
- 36.Michnovicz JJ, Galbraith RA 1990. Effects of exogenous thyroxine on C-2 and C-16 α hydroxylations of estradiol in humans. Steroids 55:22–26 [DOI] [PubMed] [Google Scholar]