Abstract
Industries developing cold spray aim at dense and resistant coatings for component repair. However, as-sprayed 316L coatings display non-equilibrium microstructure and brittle fracture behavior. Improving their mechanical properties requires controlling their microstructure; post-spraying heat treatment is a promising approach. The recovery and recrystallization of coatings were little studied, and heat treatments reported in literature mostly used holding for long time in furnaces, not adapted to on-site repairs. This study aimed at gaining insights into recovery and recrystallization mechanisms of 316L coatings, for a broader range of heat treatment kinetics. A study of powders and as-sprayed coatings was conducted to characterize the initial state. In situ XRD measurements provided input for heat treatment definition. Microscopy, room temperature XRD and hardness measurements allowed to better understand the microstructural evolutions and to select treatments leading to original microstructures. In this work, a variety of microstructures were produced by adapting heat treatment conditions for a given set of spraying parameters. The recrystallization path of the heterogeneous skin-core microstructure of deposited particles, as well as the interaction between grain growth and precipitation was revealed. A novel, optimized fast heat treatment led to a fully recrystallized, fine-grained coating and significantly reduced hardness.
Keywords: austenitic stainless steels, cold gas dynamic spraying, heat treatment, microstructure, recrystallization
Introduction
Cold gas dynamic spraying (CGDS) consists of the acceleration of solid-state particles to a range of velocity of 500-1200 m.s−1. Those particles form a layer-by-layer coating when hitting a substrate. They undergo intense and extremely fast plastic deformation at impact (i.e., around 109 s−1, calculated by finite elements analysis in the case of a single copper particle (Ref 1)), leading to mechanical and metallurgical bonding and to the creation of a dense and cohesive coating. For example, Adachi et al. (Ref 2) achieved coating densities up to 98.1 % for 316L and Maestracci et al. (Ref 3) obtained a fracture stress exceeding 70 MPa.
CGDS advantageously avoids substantial substrate heating during the process, preventing the appearance of heat-affected zones. Nevertheless, a mechanically affected zone can be found at the extreme surface of the substrate, up to a depth of a hundred micrometers (Ref 4). Compared to other thermal spray processes, the absence of thermal issues is the main benefit of using CGDS for material repair. Several authors investigated the use of CGDS for repairing applications in different industrial domains (Ref 5-11). In these studies, a large range of materials was tested, such as aluminum, magnesium, nickel-base superalloys and austenitic stainless steels (Ref 6).
One of the characteristics of cold-sprayed materials is the non-equilibrium microstructure of the as-sprayed state, due to strong particle deformation during the spraying process. In particular, deformation is strongly localized at particle–particle interfaces and at the substrate–coating interface, giving rise to a heterogeneous microstructure and sometimes to a brittle fracture behavior (Ref 12, 13), with an inter-particular fracture path. The lack of ductility of the as-sprayed material is a major drawback for the repair and refurbishment of damaged parts by the CGDS process. As reported in literature for 316L stainless steel, an effective way to improve coating properties is heat treatment (Ref 13, 14).
Previous studies reported about the effect of isothermal holdings on 316L cold spray coatings, all in furnaces, in laboratory air except for (Ref 12) (argon environment): (i) Al-Mangour et al. (Ref 14): 400, 700, 750, 800, 1000, and 1100 °C for 1h; (ii) Dikici et al. (Ref 15): 250, 500, 750, and 1000 °C for 1h; (iii) Huang et al. (Ref 12): 400, 600, 800, and 1000 °C for 4h; (iv) Sundararajan et al. (Ref 16): 400, 800, and 1100 °C for 1h.
Little microstructural change was noticed for holding temperatures below 700°C. This was reflected in a low EBSD (electron backscatter diffraction) indexation rate, especially close to particle boundaries (Ref 14); the microhardness was similar to that of the as-sprayed coating (i.e., around 400 HV0.1 in Ref 14) ; only little decrease in nanohardness occurred (i.e., from 2.92 GPa in as-sprayed state to 2.60 GPa at 400 °C in Ref 16) and no significant evolution of the fracture elongation was noticed (from 0.1 % up to 600 °C in (Ref 12) to 1 % in (Ref 14)). After holding at 700°C, Al-Mangour et al. (Ref 14) reported the presence of nano-grains from place to place, around the particle–particle interfaces, accompanied by a decrease in hardness (down to around 300 HV0.1). It should be noted, however, that any EBSD data post-processing, as well as the number of pixels used in the grain definition, were not mentioned for EBSD maps on which their conclusions were based. Moreover, besides black regions composed of non-indexed measurement points, a significant fraction of white regions, usually corresponding to poorly indexed patterns (one crystal orientation per pixel) in the grain color maps, were also present. Finally, small grains were surprisingly visible inside larger grains in these maps. Thus, potential artifacts related to the difficult EBSD indexing of cold sprayed material cannot be excluded in their reported results. Between 750 and 800 °C, the studies reported a gradual decrease in micro- and nanohardness, a slight increase in fracture elongation and microstructural homogenization. Al-Mangour et al. (Ref 14) reported a microhardness between 250 and 200 HV0.1 and an elongation at failure of 3.1 ± 0.1 % at 800 °C. Dikici et al. (Ref 15) reported a microhardness of 250 HV0.1 at 750 °C (compared to 300 HV0.1 in the as-sprayed state); Sundararajan et al. observed a decrease in nanohardness down to 2.11 GPa at 800 °C. Huang et al. (Ref 12) measured a fracture elongation of 0.3 % at 800 °C (compared to 0.2 % in the as-sprayed state). Complete recrystallization of the coating, accompanied by a drop in micro- and nanohardness and a significant increase in fracture elongation, was obtained for temperatures between 1000 and 1100 °C. Al-Mangour et al. (Ref 14) reported a fracture elongation of 22.7 ± 3.6 % and a hardness around 200 HV0.1 after holding at 1100°C after holding at 1000°C, Dikici et al. (Ref 15) measured a hardness of 200 HV0.1, Huang et al. (Ref 12) reported a fracture elongation of 10 %, and Sundararajan et al. (Ref 16) measured a minimum nanohardness of 2.11 GPa.
The above reported literature data on the effects of heat treatments on 316L cold-sprayed coatings appear to be scarce and scattered, without systematic links to the initial deformation state. A more systematic study over a wide temperature range still seems necessary in order to better understand the microstructural evolution mechanisms in these coatings. Moreover, the complex microstructure of the as-sprayed cold spray coatings, in particular, microstructural heterogeneity induced by strain localization during spraying, is expected to affect the recrystallization phenomenon, as testified by the observation of nano-grains around some particle–particle interfaces for ‘low’ temperature (i.e., 700°C) treatments leading to partial recrystallization (Ref 14). Those features will thus be considered in this study through the decorrelation of those zones.
Moreover, heat treatments reported in literature for the complete recrystallization of 316L cold sprayed coatings have mostly been carried out in air furnaces, at 1000 or 1100 °C for one hour (Ref 12-19). Applying such heat treatments is not possible in many in situ industrial applications of the cold spray process, such as the local refurbishment of thick parts. For this reason, testing shorter thermal cycles, applicable on-site during the repairing process, is highly desirable to open the way to new industrial applications. To the authors’ knowledge, no information is currently available from literature about the microstructural evolution of these coatings during faster heating and for shorter holding times.
Furthermore, undesirable effects, such as so-called void coalescence and precipitation, may appear after a heat treatment, as already observed by Al-Mangour et al. (Ref 14) and Stoltenhoff et al. (Ref 20). These defects, still present even after complete recrystallization of the coating, have already been reported to limit the mechanical properties due to persistence of an inter-particular fracture mechanism (Ref 18). However, the nature of these defects and their evolution under heat treatment is only partially understood and thus is also addressed in the present work.
In the present work, a series of different heat treatments, including fast ones, was applied to cold sprayed 316L coatings. Because the focus was on post-spraying heat treatments, all samples were obtained from coatings produced in the same conditions, i.e., with the same materials and spraying parameters. In contrast with powder fusion-based processes, the initial powder features are of prime importance here, as cold spray is a solid-state process. First, the link between the coating microstructural evolution and the initial powder was revealed through the initial characterization of the powder.
Then, in situ x-ray diffraction (XRD) analyses were conducted on as-sprayed coatings to identify the temperature range of interest. Afterward, different heat treatments were performed, followed by the analysis of the generated microstructural evolution. This work proposed a dual approach for the study of cold sprayed coatings. Indeed, the strain localization zones, here, ‘skin zones,’ located at the particle–particle interfaces are distinguished from the former particle cores, denoted as ‘core zones’ in the following. This approach highlighted the respective evolutions of these two zones and assessed the relevance of this deconvolution.
Three types of heat treatments were considered. First, isothermal treatments with a dwell time from 45 minutes to 24 hours allowed to identify the microstructural evolution path and to compare the results with current knowledge. Secondly, shorter isothermal treatments (from 30 seconds to 11 minutes) with faster heating rates were explored. Finally, flash treatments with even higher heating rates (up to 350 °C.s−1) and shorter dwell times (from 2 to 26 seconds) were carried out. As heat treatments involved temperatures at least equal to 650°C, residual stresses were considered to be relieved and will not be further addressed in the following.
By combining microstructural evolutions observed after these heat treatments, this study also aimed to shed light on the recovery and recrystallization mechanisms of 316L cold sprayed coatings, mainly based on information provided by EBSD, such as the evolution of grain size and grain boundary misorientations.
Experimental Procedure
Powder
Cold spray coatings studied in this work were produced with a commercial 316L austenitic stainless steel feed-stock powder. The typical chemical composition is presented in Table 1.
Table 1.
Chemical specification of the 316L powder, as given by the manufacturer
| Cr | Ni | Mo | Mn | Co | Si | P | S | C | O | N | Fe | |
|---|---|---|---|---|---|---|---|---|---|---|---|---|
| wt. % | 16-18 | 12-14 | 2-3 | <2 | <0.1 | <0.75 | <0.045 | <0.03 | <0.03 | <0.03 | <0.1 | bal. |
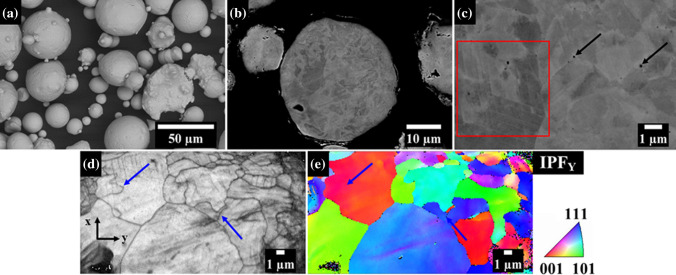
This powder was produced by gas atomization, with a particle-size distribution given by the supplier, namely D10=15 µm and D90=63 µm. As shown in Fig. 1(a), the particles exhibited a spherical morphology and presented satellites. The coatings were deposited using a sieved powder (25-36 µm fraction).
Fig. 1.
(a) Scanning electron micrograph (SEM) of the free feed-stock powder, using Secondary Electron (SE) Everhart–Thornley imaging. (b) Cross-sectional SEM-BSE image of the powder particle microstructure. (c )Cross-sectional SEM-BSE micrograph highlighting: nanosphere precipitates (pointed with arrows), and slip bands (in the red box). (d, e) Respectively, EBSD band contrast (BC) map and inverse pole figure (IPF) map along the y axis of the as-received powder showing the existence of subgrain boundaries (blue arrows) (Color figure online)
Coating Deposition
The substrates were 60x45x4.5 mm3 304L austenitic stainless steel plates. The coatings were deposited by means of a 5-11 cold spray system (Impact Innovation, Rattenkirchen, Germany) using N2, both as powder carrier gas and processing gas. Spraying parameters were set to 4.5 MPa and 900 °C and resulted in a 3-mm-thick coating without delamination. The other spraying parameters were set up to maximize the impact velocity.
Heat Treatments
Identification of the Temperatures of Interest
In order to identify viable ranges for recovery and recrystallization temperatures, in situ XRD analysis was conducted during the heating of an as-sprayed coating. Diffraction data were collected using a D8 Discover system (Bruker, Massachusetts, USA), Cu Kα1 and Kα2 radiations and the x-ray source was operated at 40 kV and 40 mA. The incident beam angle was between 40 and 150 °. The step counting was fixed at 0.029 ° intervals and the acquisition time to 2 seconds per data point. The system was equipped with a Lynxeye XE-T linear detector and an HTK1200N (Anton Paar, Graz, Austria) oven chamber, under laboratory air, based on a Kanthal resistive heating attachment.
The as-sprayed coating was placed in an alumina crucible and a LaB6 reference was analyzed with the same parameters to ensure that the measured minimum values corresponded to the material response and not to the equipment limits. The sample was then heated from room temperature up to 1000 °C at a rate of 60 °C.min−1. The heating ramp was stopped every 25 °C for 11 minutes from 500 °C to 1000 °C to acquire diffractograms.
In situ XRD analysis thus allowed a first study of the microstructural evolution of coatings with temperature. In particular, the evolution of the full width at half maximum (FWHM) of the (111) peak with temperature was taken as an indicator of modifications of the crystal lattice deformation state. The results for the other detected peaks (namely, (200); (220); (311); (222)), not presented here for the sake of brevity, showed the same trends in their FWHM evolution.
As shown in Fig. 2(a), three stages could be distinguished: the first one, with a gentle slope (i.e., − 0,0002°.°C−1) up to 700 °C; the second zone was distinguished by a steeper slope, between 700 °C and 750 °C; the third one was defined by a plateau appearing from 750 °C.
Fig. 2.
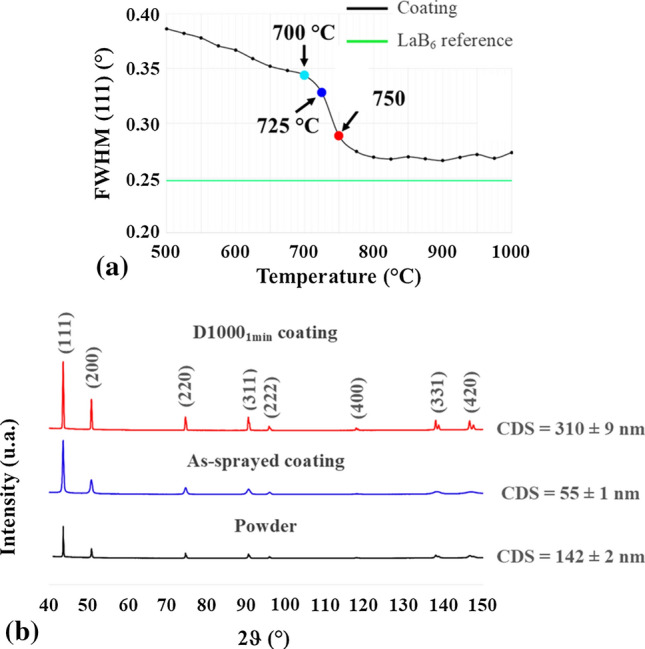
(a) Curve representing the FWHM evolution of the (111) peak with temperature during in situ XRD. (b) XRD diffractograms of the powder, of the as-sprayed coating and of the D10001min coatings (see Section "Complete recrystallization (F1000, D1000, G100030s)"), with coherence domain sizes (CDS) of each sample indicated close to the corresponding curves
These results allowed to identify a set of temperatures of interest, used for the definition of heat treatment conditions: (i) 650 °C, corresponding to a gradual decrease in the coating deformation state; (ii) 700 °C, close to the transition between the first stage and the second stage; (iii) 725 °C, near the inflection point; (iv) 750 °C, just before the beginning of the third stage; (v) 800 °C, close to the lower boundary of the plateau; (vi) 1000 °C, temperature at which the coating deformation state did not appear to change, in literature (Ref 13, 14, 17-19) this value of annealing temperature corresponded to a completely recrystallized state (see the Introduction section).
In order to more directly determine specific microstructural evolutions during the second stage, namely at the three identified temperatures (i.e., 700 °C, 725 °C and 750 °C) in Fig. 2(a), the in situ XRD cycle was reproduced in a dilatometer under helium flow and interrupted at the corresponding temperature by quenching to observe the resulting microstructure. These heat treatments are, respectively, named D700, D725 and D750 in the following.
Exploration of Heat Treatments Kinetics
With the aim of evaluating microstructural evolution phenomena appearing at 650 °C and 1000 °C, furnace treatments were carried out. A MF7 (Hermann-Moritz, Würzburg, Germany) furnace under air was selected for these treatments, as the evaluation of these temperatures did not require as much precision as the three previous cycles (i.e., D700, D725 and D750). Moreover, this choice allowed a comparison with literature results. Isothermal holding heat treatments were applied to as-sprayed substrate+coating samples with a section area of 30x8 mm2. These treatments, with a heating rate around 1.25 °C.s-1, were followed by water quenching. The samples were inserted in the furnace at room temperature, and two conditions were applied: (i) 650 °C for 24h, denoted as F650, for which the dwell time was defined from literature results (Ref 21, 22) reporting holding times between 24h and 200h; (ii) 1000 °C for 45 minutes, denoted as F1000. The holding time was again defined in relation to the literature, reporting dwell times of a few minutes up to a few hours in the case of compression-deformed 316L (Ref 23, 24). It was close to those reported in the Introduction section (Ref 12, 14-16).
The effect of short-time isothermal holding was then evaluated using a L78 Rita (Linseis, Selb, Germany) dilatometer under helium flow. The heating rate was set to 50 °C.s-1. Two temperatures were selected: 800 °C and 1000 °C. From a preliminary study, at 800 °C, for these treatment conditions, a holding time of 5 minutes resulted in a recrystallized microstructure. At 1000 °C, complete recrystallization was obtained after 30 seconds. Both cycles were studied and led to similar microstructures. Thus, only the results from the treatment at 1000 °C for 30 seconds, named D1000, are presented hereafter.
A second coating sample was treated by this means at 1000 °C for one minute, namely D10001min, and then analyzed by XRD in order to define a reference state of a defect-free 316L cold spray microstructure. Restrictions of sample geometry compatible with the dilatometry equipment did not allow keeping the substrate together with the coating, so only the coating was treated with this method.
To address faster conditions, another series of heat treatments was applied using a Gleeble 1500 (Dynamic System Inc, New York, United States) thermal-mechanical simulator, with sample heating by Joule effect. Although the material was metastable, porous and inhomogeneous, application of these treatments was possible without local melting. Coated coupons were machined in the form of cylinders of 5 mm in diameter and 20 mm in length. The samples were made of substrate–coating assemblies, the interface being parallel to the cylinder as illustrated in Fig. 3(b). The distance between jaws was set to 10 mm so the thermally homogeneous zone extended over 3 mm along the length of the cylinder, as shown in Fig. 3(b). Sample extremities were continuously cooled by the copper alloy grips. Their temperature did not exceed 160 °C in average, as measured by K-type thermocouples spot-welded in these areas. Consequently, the extremities were not affected by the heat treatment, as confirmed by subsequent SEM observations.
Fig. 3.
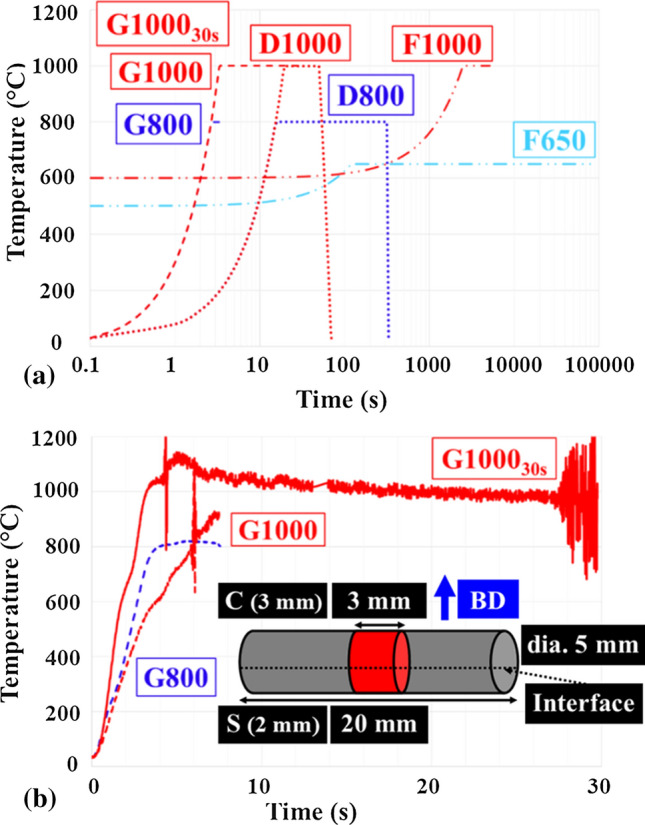
(a) Heat cycles for the different heat treatments (logarithmic time scale). (b) Actual heat cycles obtained with the Gleeble system and schematic view of the thermally homogeneous zone (in red) of Gleeble-treated samples. Spikes in the G1000 an G100030s curves are measurement artifacts but did not affect the actually applied heat cycle. BD: Building Direction, C: Coating and S: Substrate (Color figure online)
The Gleeble system allowed heating rates in the order of 300 °C.s-1, about 300 times faster than for the F650 and F1000 conditions. Two temperatures were selected for these treatments: 800 °C and 1000 °C. These temperatures were chosen because they allowed, in longer treatments as for example D800 and D1000, a complete recrystallization of the coatings. In conclusion, using the Gleeble system, three cycles were applied, namely (i) 800 °C for 3 seconds with a heating rate of 200 °C.s-1, denoted as G800; (ii) 1130 °C for 2 seconds with a heating rate of 190 °C.s-1, denoted as G1000; (iii) 1010 °C for 26 seconds with a heating rate of 350 °C.s-1, denoted as G100030s.
The temperature in the heat-treated zone was controlled by a K-type thermocouple spot-welded at the sample mid-length on the coating side. The cooling rate was obtained by switching off the electrical current and was close to 25 °C.s-1 between 800 and 500 °C, ensuring efficient quenching of the sample.
All treatments and corresponding conditions are summarized in Table 2 and the heat cycles are plotted in Fig. 3(a), using a logarithmic scale for better visibility.
Table 2.
Summary of the heat treatment conditions and evolution of the recrystallized fraction and of the fraction of HAGBs for the different heat treatments
| Heat treatment summary | |||||||
|---|---|---|---|---|---|---|---|
| Name | Heating method | Temperature (°C) | Holding time | Heating rate | Cooling rate | % HAGBs | Recrystallized fraction |
| D700 | dilatometry | 700 | 11 min | 60 °C.min−1 | 50 °C.s−1 | 14 | 0.87 |
| D725 | dilatometry | 725 | 11 min | 60 °C.min−1 | 50 °C.s−1 | 32 | 0.88 |
| D750 | dilatometry | 750 | 11 min | 60 °C.min-1 | 50 °C.s−1 | 78 | 0.90 |
| F650 | air furnace | 650 | 24 h | 1.25 °C.s−1 | water quenching | 16 | 0.37 |
| F1000 | air furnace | 1000 | 45 min | 1.25 °C.s−1 | water quenching | 98 | 0.99 |
| D800 | dilatometry | 800 | 5 min | 50 °C.s−1 | 50 °C.s−1 | ||
| D1000 | dilatometry | 1000 | 30 s | 50 °C.s−1 | 50 °C.s−1 | 97 | 0.99 |
| D10001min | dilatometry | 1000 | 1 min | 50 °C.s−1 | 50 °C.s−1 | ||
| G800 | Gleeble | 800 | 3 s | 200 °C.s−1 | 25 °C.s−1 | 33 | 0.45 |
| G1000 | Gleeble | 1130 | 2 s | 190 °C.s−1 | 25 °C.s−1 | 64 | 0.86 |
| G100030s | Gleeble | 1010 | 26 s | 350 °C.s−1 | 25 °C.s−1 | 98 | 1.00 |
The graph in Fig. 3(a) shows cycle set-points of each treatment. For F650, F950, D800 and D1000 treatments, requested set-points were tightly reproduced in the actually obtained cycles. However, for all Gleeble cycles (G800, G1000 and G100030s), a difference between the requested set-points (Fig. 3a) and the obtained cycles (Fig. 3b) was noticed. Those variations can be explained by the limited reproducibility of electrical resistivity in these samples, due to their heavy deformation, their metastable microstructure and the presence of pores.
Characterization of Microstructural Evolutions
Powder
The samples were prepared via mechanical polishing with a final etching step using a silica suspension in order to remove the work hardening induced by cutting of the sample, as well as to ensure flatness of their surfaces. A field-emission gun (FEG) low-vacuum Nova NanoSEM 450 (FEI Instruments, Lausanne, Switzerland) SEM coupled with an EDAX Hikari EBSD camera (Eden Instruments, Alexan, France) was used. The voltage and working distance (WD) for SEM observations were, respectively, set to 15 kV and 7 mm. A backscattered electron (BSE) detector was employed for SEM observations allowing crystallographic structure observation. The used voltage for EBSD mapping was 20 kV and the WD was set to 15 mm. A tilt angle of 70° was applied to the sample and the maps were obtained with a 0.1 µm step size except for D700, D725 and D750 samples, for which it was set to 0.025 µm. No post-processing data cleaning was applied and the minimum disorientation angle between two grains was set to 10°, including twins. All grain sizes reported in this paper were measured as equivalent circle diameters. The criterion for complete recrystallization used in this work was the grain orientation spread (GOS). The threshold below which recrystallization was considered complete in a given grain was fixed to 3°.
A study of powder chemical heterogeneity was carried out using a Helios Nanolab 600 (FEI, Lausanne, Switzerland) dual beam microscope (i.e., focused ion beam, FIB) and a Tecnai Osiris (FEI, Lausanne, Switzerland) FEG transmission electron microscope (TEM) equipped with a Super X-SDD detector for energy-dispersive x-ray spectroscopy (EDXS) analysis.
Finally, XRD measurements were carried out on the non-sieved initial powder in order to understand its microstructural state. The diffraction spectra were acquired under the same conditions as in Section "Identification of the temperatures of interest". In addition to phase identification, the coherence domain size (CDS), also called the crystallite size, could also be determined. This indicator, which was calculated automatically during the analysis, was derived from the Scherrer equation, Eq. 1.
| 1 |
with τ the CDS, K a crystallite shape factor, λ the used X-Ray wavelength, β the FWHM and ϑ the Bragg angle.
The CDS reflects the internal deformation of the studied material. Indeed, the presence of defects within the crystal lattice, such as dislocations, leads to a local modification of the lattice interplanar distances. According to a definition by Bertaut et al. (Ref 25), a coherent diffraction domain corresponds to a zone of the material in which this distance is constant along the direction of the diffraction vector.
Coatings
To investigate the initial substrate–coating microstructure and its evolution through the various heat treatments, first, porosity rates were determined for the as-sprayed state by image analysis using SEM images and ImageJ software. The analyzed surface was around 1 mm2, ensuring good statistical significance of the measurements.
For microscopic observations, samples were prepared in the same way as powder samples (see Section "Powder'). A Leica DMI 5000 (Leica, Wetzlar, Germany) optical microscope in direct-light and a field-emission gun
Supra 55 SEM (Zeiss, Oberkichen, Germany) coupled with a Symmetry EBSD camera (Oxford, Abingdon, UK) was used. The voltage used for SEM observations and EBSD mapping was 15 kV, and the high current feature was turned on. The working distance (WD) was fixed to 14.5 mm as it corresponded to the optimum for the system used. Two detectors were employed for SEM observations: Everhart–Thornley secondary electron imaging (SE hereafter) for topographic observations, and backscatter electron imaging (BSE hereafter) to access chemical and deformation contrasts. Sample preparation and other EBSD acquisition parameters were similar to those used in Section "Powder". Again, no post-processing data cleaning was applied. The chemical composition of precipitates appearing after some heat treatments was determined by energy-dispersive spectrometry (EDS).
To examine the presence of any locally amorphous zones at the prior particle boundaries (PPBs) and to finely characterize the coating microstructure prior to heat treatments, XRD measurements were also performed on an as-sprayed sample. For comparison purposes, XRD analysis was also conducted on the fully recrystallized D10001min sample. Diffraction measurement conditions were the same as in Section "Powder".
The as-sprayed coating microstructure was also observed by TEM on thin foils in the same conditions as in Section "Powder". Similar observations were also carried out on the G800 sample in order to better understand the phenomena involved at the PPBs during the heat treatment.
Mechanical Properties
Mechanical properties of as-sprayed and heat-treated coatings were studied, by means of microhardness measurements with a Mitutoyo microhardness measurement device (Andover, UK). For this purpose, a load of 0.05 kg and a magnification of x50 were used. Given the heterogeneity of cold spray coatings, an array of 15 indents was set in order to obtain 10 representative values at least, after the removal of abnormally low values due to porosity.
To study the evolution of the two coating zones (i.e., skin or core) more locally, under the effect of heat treatments, nanohardness measurements were carried out with a XP Nano-Indenter (MTS, Minnesota, USA). Grids of 10x10 indents (with 10 µm between indents) were defined in the coatings to obtain enough results in the considered zones (i.e., minimum of 13 measurements per zone). In order to identify the exact location of the nanoindents and thus to correlate the results with the studied area, SEM observations were performed.
Results
Recovery and Recrystallization of the Coatings during the Heat Treatment
Initial State of the as-Received Powder
The powder showed a deformed microstructure, as suggested by the gray level shades in BSE images (Fig. 1b) and more generally by the absence of clearly visible grains. Furthermore, SEM observation shown in Fig. 1(c) revealed the presence of slip bands. By comparing the EBSD maps in band contrast (Fig. 1d) and in inverse pole figure coding (Fig. 1e), the presence of subgrains was revealed, as well as the absence of twins. Powder EBSD analysis also indicated that 10 % of the grains were smaller than 0.5 µm (G10); 50 % were smaller than 1.7 µm (G50) and 90 % were smaller than 5.4 µm (G90). A maximum GOS value of 5° as well as a fraction of low angle grain boundaries (LAGBs) up to 60 % were also revealed.
XRD analysis of the powder first revealed its fully austenitic crystal structure. In Fig. 2(b), diffractograms of the powder, of the as-sprayed coating and of a fully recrystallized coating (D10001min conditions) are compared. Moreover, the initial work-hardened state of the powder was confirmed. Indeed, the diffraction peaks displayed relatively large FWHMs compared to those of the fully recrystallized sample and the CDS of the powder was 142 ± 2 nm. This initial deformation state can be explained by the powder manufacturing process and is consistent with former studies, although in the present work no significant fraction of α’ martensite was measured (Ref 14).
Microstructure of the as-Sprayed Coating
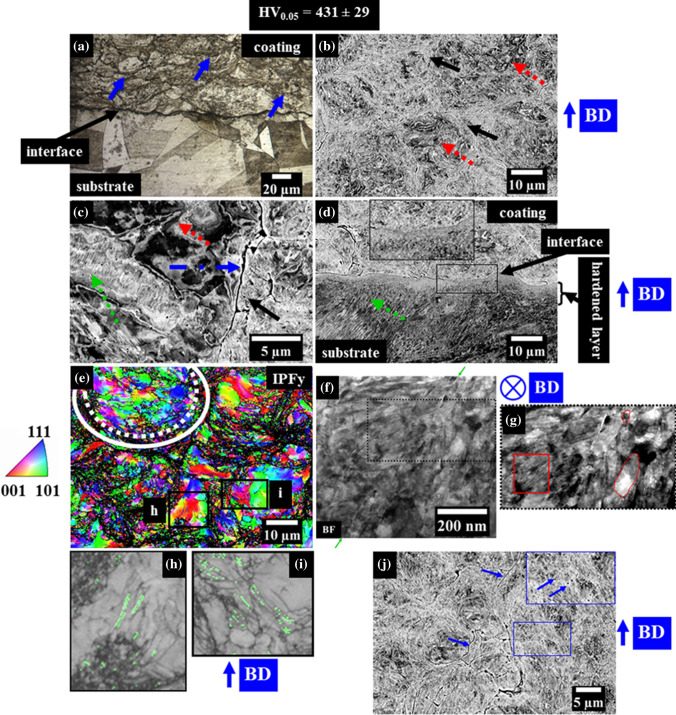
The volume fraction of porosity in the as-sprayed coatings was evaluated to 1.17 ± 0.28 %. This porosity was generated by a particle stacking fault mechanism. During heat treatment, pore evolution was found to be negligible as compared to the evolution of silica-rich particles (see Section "Evolution of the silica-rich precipitates during the heat treatment"). Thus, porosity will not be considered further in the following. In as-sprayed coating cross-sectional views presented in Fig. 4, the deformed particles were still recognizable. They presented a core-skin type microstructure, where the external (i.e., skin) zones underwent higher deformation than the particle cores. By assimilating the impacted particles to ellipses with skin zones homogeneously distributed around the cores and with a constant volume, the fraction of skin regions was evaluated to be 11 ± 4 % and their average thickness to 0.78 ± 0.40 µm.
Fig. 4.
Cross-sectional observations of the as-sprayed (AS) coating. (a) OM image, with some particle boundaries highlighted by blue arrows. (b) SEM-BSE image highlighting some core (dotted square red arrow) and skin (continuous arrow) regions. (c) SEM-BSE micrograph highlighting particle core (dotted square red arrow), skin zone (continuous black arrow), particle boundaries (dashed blue arrow) and nanotwins (dotted green arrow). (d) SEM-BSE micrograph of the substrate–coating interface with an inset showing a magnified zone. e EBSD inverse pole figure map (IPF) along the building direction highlighting the core (bounded by a dotted line circle) and the skin (bounded by a solid line circle) of a particle. (f) TEM bright-field image of the skin zones with particle–particle interface indicated by solid arrows. (g) Detail of (f) with some nano-grains delineated and nanotwins in the square framed region. (h, i) Details of boxes in e indicating nanotwins (in green) in a local image quality map. (j) SEM-BSE image showing the particle–particle interfaces and precipitates in magnified core zones (solid line blue arrows). BD: building direction (Color figure online)
Equiaxed regions, presenting a variety of gray level contrasts, corresponded to the core of deformed particles. Extremely hardened zones around the particle cores appeared in brighter gray contrast. They corresponded to regions close to particle–particle interfaces that, being in the front-line during impact, underwent extreme plastic deformation. This was confirmed by the observation of the upper layer of the coating where it was possible to observe particles without the effect of overlaying impacts. In this case, not shown here for the sake of brevity, skin zones were only observed at the interfaces with already deposited particles. Conversely, the free surface did not clearly show any skin zone but simply showed a large core area. Nanotwins were observed inside some particle cores (Fig. 4c) indicating bulk deformation within the particle. This can be a result of the powder processing, as well as of the cold spray process, although the deformation induced by the impact was mainly localized close to the surface of the particle (Ref 1, 26, 27). Comparison with the initial powder microstructure (Fig. 1) seems to confirm the very slight effect, if any, of the process on the microstructure of particle cores at that observation scale.
The substrate–coating interface was locally no longer visible (inset in Fig. 4d), suggesting strong cohesion in these areas. This indicated an intimate contact between the particle and the substrate, certainly made possible by some ejection of the oxide layer during impact, as reported in literature (Ref 26, 28, 29). This phenomenon, coupled with the strong local temperature increase and the severe plastic deformation, allowed mechanisms similar to those of diffusion welding to occur, leading to the formation of metallic bonds. In addition, a hardened layer was observed at the extreme surface of the substrate, over a depth of about 2.5 µm. Under this layer, nanotwins were also present.
EBSD mapping of the as-sprayed coating was also carried out (Fig. 4e). On the one hand, local variations in crystal orientation confirmed the strong deformation of particle cores, similar to the initial powder observations (Fig. 1e). On the other hand, skin areas could not be indexed at all, suggesting two possibilities: either the presence of an amorphous phase or an extreme grain refinement, below the spatial resolution of EBSD (close to 20 nm), as already reported in several studies (Ref 3, 14, 30).
This analysis also confirmed the presence of nanotwins in some particle cores. The maximum GOS value was identified as 29°, and a proportion of 86 % of LAGBs was measured. G10, G50 and G90 were evaluated to, respectively, 0.38, 0.49 and 1.19 µm.
Finally, no significant texture or remnant annealing twins were noticed, as confirmed by the different IPF (Inverse Pole Figure) maps parallel and perpendicular to the building direction (BD).
Concerning the microstructure in the skin areas, where most of the non-indexed points were found, the presence of nano-grains seems to be the most probable explanation, as confirmed by XRD results revealing the fully austenitic structure of the as-sprayed coating, without any amorphous halo or significant fraction of α’ martensite. This is compatible with a crystallite size of about 50 nm calculated from XRD peak broadening (Fig. 2b). Comparison with the initial powder revealed the absence of phase transformations during spraying. Moreover, a clear peak broadening was noticed in the case of the as-sprayed coating. This is another indication of the severe deformation of the material during cold spraying.
Fig. 4(f) shows a TEM bright-field (BF) image of a region containing two skin zones on both sides of a particle–particle interface. The presence of nano-grains, confirmed by dark-field imaging not shown here for the sake of brevity, with a size of 41 ± 10 nm (manually determined from 10 measurements), close to the particle–particle interface was observed. Severe deformation was evidenced by dislocation networks and nanotwins (Fig. 4g).
Early Stage of Recrystallization in Severely Deformed Zones (F650, D700, D725, D750 and G800)
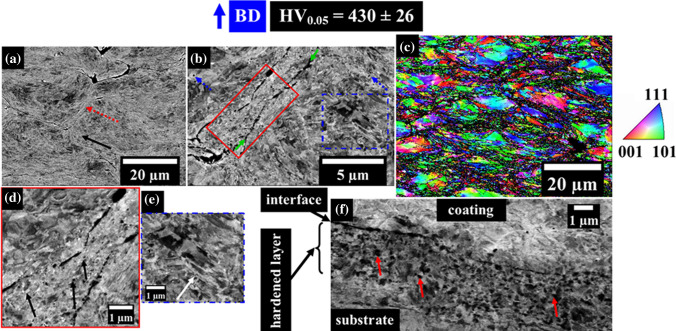
F650 coating samples still presented a core-skin microstructure (Fig. 5a), with nanotwins inherited from the as-sprayed state (Fig. 5b,d). Their thermal stability (i.e., up to 800°C) is noteworthy, but a non-significant effect was expected on the mechanical properties of the coating, in view of the high dislocation density expected to already provide significant work hardening in non-recrystallized regions. Recrystallization seemed to have started in skin regions (Fig. 5b,c). The EBSD map of Fig. 5c on the same sample confirmed these observations. Thus, although the LAGB proportion remained similar to that in the as-sprayed sample (i.e., 84 % vs 86 %), the maximum GOS value was reduced to 14° (vs 29°). The G10, G50 and G90 grain size indicators were, respectively, estimated to 0.37, 0.49 and 1.24 µm.
Fig. 5.
Cross-sectional analysis of the F650 sample. (a) SEM-BSE micrograph showing the core-skin structure, highlighting a core region (dotted arrow) and a skin region (continuous arrow). (b) SEM-BSE micrograph highlighting recrystallized grains (framed by continuous lines), nanotwins (framed by dotted lines), PPBs (solid line arrows) and precipitates (dotted line arrows). (c) EBSD IPF map of the coating along the building direction. d Enlarged view of the continuous frame in b, with nano-grains identified by black arrows. (e) Enlarged view of the dotted frame in (b), with nanotwins identified by the white arrow. (f) SEM-BSE micrograph of the substrate–coating interface with some recrystallized grains identified by red arrows (Color figure online)
The substrate–coating interface evolved as well. Indeed, the hardened layer observed in the as-sprayed state (Fig. 4d) was replaced by a layer of recrystallized nano-sized grains (Fig. 5f), which seemed larger than those in coating skin zones (Fig. 5b).
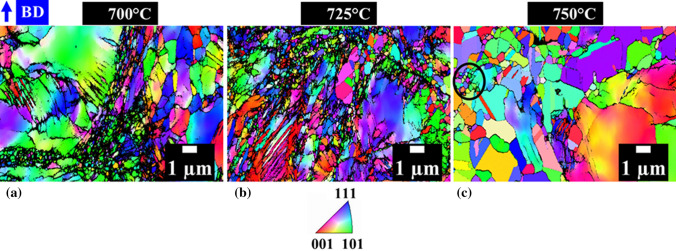
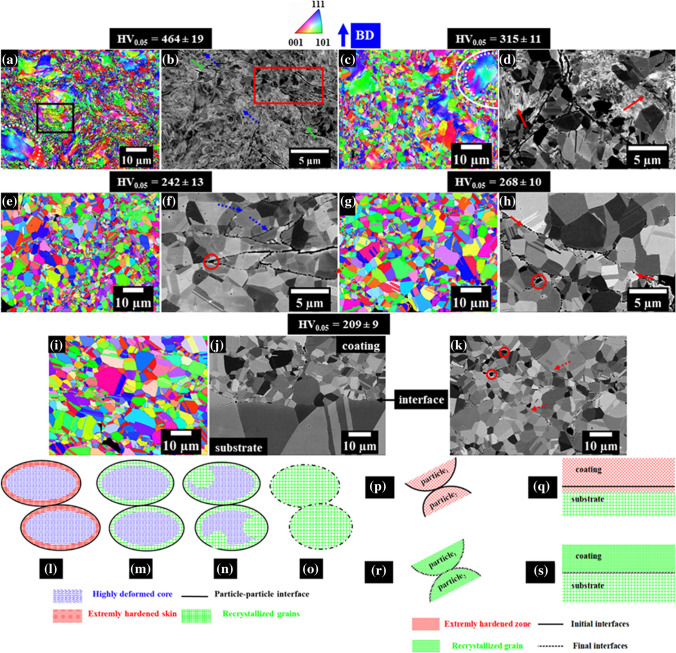
The D700, D725 and D750 coatings retained their core-skin structure as well. However, a clear influence of the temperature on the skin microstructure was observed by comparing these three treatments. After the D700 treatment (Fig. 6a), skins were constituted by nano-grains in line with TEM observations of the as-sprayed coating (Fig. 4f) but in contrast to the as-sprayed and F650 samples, these grains were now large enough to be detected by EBSD. The G10, G50 and G90 values were measured to 0.09, 0.15 and 0.51 µm, respectively. After the D725 treatment (Fig. 6b), the G10, G50 and G90 values were still unchanged, namely 0.09, 0.15 and 0.44 µm, respectively. After the D750 treatment (Fig. 6c), a clear increase in grain size was observed, in the following size distribution parameters: G10 (0.10 µm), G50 (0.28 µm) and G90 (1.60 µm). Local nano-grained clusters, such as the one circled in Fig. 6c, were still noticed. The recrystallization of skin zones, almost complete for the D750 sample, was also supported by the decrease in the maximum average grain disorientation and in the proportion of LAGBs, respectively, from 13° and 86 % for the D700 sample, to 8° and 68 % for the D725 sample and down to 2° and 22 % for the D750 sample. On the other hand, the proportion of annealing twins gradually increased, being, respectively, 10 % for D700, 33% for D725 and 70% for D750.
Fig. 6.
EBSD inverse pole figure maps along BD of (a) D700, (b) D725 and (c) D750 coating samples, with a circled local nano-grained cell
These observations thus strongly suggested that the drop in FWHM between 700 °C and 750 °C essentially corresponded to the recrystallization of skin regions.
The G800 sample still showed a clear core-skin structure (Fig. 7a) with fine and equiaxed grains in skins, similarly to the F650 sample (Fig. 5d). This partial recrystallization was confirmed by the indexing of these regions in EBSD map using the finer step size of 0.025 µm (Fig. 6) and was mostly restricted to these zones. A maximum value of GOS similar to that of the as-sprayed coating was noticed (i.e., 29°), supporting a barely initiated recrystallization. However, a decrease in the LAGB fraction (i.e., 67 % vs 86 % in the as-sprayed state), as well as the presence of annealing twins (i.e., 16 %), mainly distributed in the skin regions supports the presence of recovered grains and an incomplete recrystallization, restricted to skin areas.
Fig. 7.
(a) EBSD inverse pole figure map along BD of the G800 coating highlighting a core region (bounded by a dotted line circle) and the corresponding skin region (bounded by a solid line circle), with framed nanotwins (thin black lines). (b) Cross-sectional SEM-BSE image of the G800 coating with PPBs indicated by solid lines arrows, framed fine recrystallized grains in the skin zones and precipitates (dotted lines arrows). (c) EBSD inverse pole figure map along BD of the G1000 showing extension of recrystallization and remaining core (circled in dotted line) – skin (circled in solid line). (d) Cross-sectional SEM-BSE image of the G1000 sample showing recrystallization and nanotwins (indicated by arrows). e EBSD inverse pole figure map of the D1000 sample along BD. (f) Cross-sectional SEM-BSE image of the D1000 sample with some PPBs indicated by dotted line arrows and oxide coarsening at PPB triple junctions (circled). (g) EBSD inverse pole figure map along BD of the G100030s heat-treated coating. h Cross-sectional SEM-BSE image of the coating after G100030s treatment showing the recrystallization blocked by PPBs (indicated by solid arrows) and oxide coarsening at PPB triple junctions (circled). (i) EBSD inverse pole figure map along BD of the F1000 sample. (j) Cross-sectional SEM-BSE micrograph of the F1000 substrate–coating interface (pointed by continuous line arrow). (k) Cross-sectional SEM-BSE image of the F1000 coating showing PPB evolution (indicated by arrows) and oxide coarsening at PPB triple junctions (circled). (l, m, n, o) Schematic view of proposed coating recrystallization stages during a post-spraying heat treatment, showing two deposited particles. l as-deposited state; m recrystallization of skin zones; (n) extension of recrystallization into the core region leading to (o) full recrystallization. (p, q, r, s) Schematic view of the evolution stages of particle–particle (p, q) and coating–substrate (r, s) interfaces in a 316L cold sprayed coating during a post-spraying heat treatment up to at least 1000 °C
No significant grain growth was observed, with G10, G50 and G90 measured, respectively, to 0.36, 0.53 and 1.25 µm (vs 0.38, 0.49 and 1.19 µm in the as-sprayed state). In this recrystallization stage, nanotwins were still present in deformed particle cores (Fig. 7a).
Extension of the Recrystallization into Core Regions (G1000)
The G1000 sample also presented a core-skin structure, yet with more advanced recrystallization (Fig. 7c), with a maximum GOS value of 26° (vs 29° for the G800 sample). An increase in the HAGB and annealing twin fractions was observed for this sample, with values amounting to 64 % and 48 %, respectively. PPBs, as well as residual deformation in particle cores, were still readily visible. Nanotwins were not erased everywhere (Fig. 7d) and EBSD mapping of the sample (Fig. 7c) highlighted residual deformation in the center of former core regions as well as full recrystallization of skin regions.
At this stage of recrystallization, a clear grain coarsening was observed, with G10, G50 and G90, respectively, measured at 0.45, 1.02 and 2.76 µm (vs 0.36, 0.53 and 1.25 µm for the G800 sample).
Complete Recrystallization (F1000, D1000, G100030s)
The F1000 heat treatment led to a complete recrystallization of the coating, as suggested by the cross-sectional analysis presented in Fig. 7i. Recrystallization was considered complete in light of the maximum GOS value of 1° (vs 29° in the as-sprayed state). A proportion of annealing twins up to 63 % was observed, similarly to sample D750 where a complete recrystallization in skin zones was obtained. However, this sample had a much higher proportion of HAGBs, namely 98 % compared to 78 % for the D750 sample. This difference is certainly the result of the longer dwell time in the F1000 case (i.e., 45 minutes vs 30 seconds), enabling full recrystallization of core areas. Apart from a much smaller grain size, the coating microstructure was similar to that of the substrate. G10, G50 and G90 grain sizes were measured, respectively, at 2.37, 3.65 and 6.65 µm. These values are significantly larger than those observed for previous samples, suggesting grain coarsening. Moreover, the hardened substrate layer also seemed to have disappeared (Fig. 7j).
A totally recrystallized microstructure was observed for the D1000 treated coating (Fig. 7e), with a maximum GOS value of 4°. Furthermore, a clear increase in the fraction of HAGBs was again observed (97 % vs 14 % in the as-sprayed case). Annealing twinning was also identified, with a proportion amounting to 61 %. Recrystallization was still heterogeneous, with two typical grain sizes, defining remnants of core and skin areas. Over the entire coating, G10, G50 and G90 were, respectively, evaluated to 0.48, 1.37 and 3.68 µm, suggesting a less pronounced grain coarsening than that observed for the F1000 treatment. Recrystallization was generally constrained by PPBs (Fig. 7f), and almost no grain boundary migration across these interfaces was observed.
The G100030s sample (Fig. 7g-h) showed a microstructure similar to the one obtained after D1000 (Fig. 7e-f) and F1000 (Fig. 7i-j) treatments, with no longer visible nanotwins, with 98 % of HAGBs and 60 % of annealing twins. This treatment allowed achieving a complete recrystallization both in skin and core regions (Fig. 7g), as confirmed by a GOS of 3°. Inheritance of the former duplex core-skin structure remained, as evidenced by the grain size heterogeneity, with smaller grains in the former skin regions and larger grains in the former core regions. Moreover, grain boundary migration remained locked by PPBs (Fig. 7h). G10, G50 and G90 were, respectively, measured to 0.34, 1.22 and 4.30 µm. These values are similar to those observed for the D1000 coating (respectively 0.48, 1.37 and 3.69 µm). The G100030s substrate–coating interface, not shown here for the sake of brevity, was similar to that observed for the F1000 sample (Fig. 7j), with a disappearance of the hardened layer in the substrate, below the interface.
In all heat treatments leading to complete recrystallization, the grain boundaries could generally not migrate across PPBs despite the evolution of PPBs into discontinuous lines in BSE micrographs. This phenomenon may explain why the grain size remained small on average, when compared to the substrate (G10, G50 and G90, respectively, measured to 0.71, 17.84 and 46.19 µm).
XRD analysis showed a clear peak refinement accompanied by a strong increase in CDS after complete recrystallization of the coating (Fig. 2b) (310 ± 9 nm against 55 ± 1 nm for the as-sprayed coating). This is indicative of the thermally activated recovery. Furthermore, the fine microstructure of the recrystallized coating presented a lower defect density than that initially present within the free powder particles, as suggested by the larger obtained CDS (i.e., 310 ± 9 nm against 142 ± 2 nm).
Table 2 shows a summary of the microstructural evolution as a result of the different heat treatments. For the F650 treatment, both the recrystallized fraction and the proportion of HAGBs increased very slightly (from, respectively, 0.37 and 14 % in the as-sprayed state). This could indicate a dominant recovery mechanism for this treatment. In the case of the G800 cycle, these two indicators significantly increased, suggesting advanced recovery, as well as recrystallization starting in the skin areas. D700, D725 and D750 samples showed a gradual increase in recrystallized fraction and a steeper increase in their proportion of HAGBs with their maximum holding temperature. Given the reduced area focused on skin area (compared to F650 and G800 treatments), this supports the hypothesis of a gradual recovery and recrystallization beginning in skin areas. This also suggests the parallel evolutions of the coating core and skin areas. Partial recrystallization obtained via the G1000 treatment is illustrated by a lower recrystallized fraction and a lower proportion of HAGBs than those measured in the D750 sample. Finally, complete recrystallization obtained for the G100030s, D1000, and F1000 coatings resulted in similar values of recrystallized fraction and HAGB fraction, supporting the robustness of the recrystallization phenomenon at that temperature. Furthermore, the higher values obtained compared to the D750 coating (containing fully recrystallized skin zones) are due to the presence of unrecrystallized core zones within the mapped area.
Evolution of the Silica-rich Precipitates during the Heat Treatment
Origin of Silica-Rich Particles within the Initial Powder
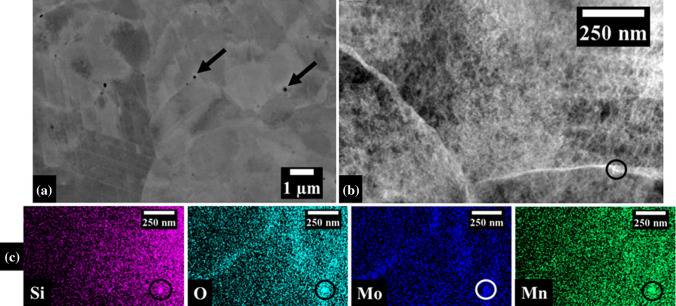
The powder SEM micrograph shown in Fig. 8a revealed the presence of spherical precipitates of an average size of 0.13 ± 0.03 µm within the particles. TEM (Fig. 8b) and TEM-EDS analysis (Fig. 8c) showed an enrichment in silicon, molybdenum, manganese, and oxygen. The presence of this type of silicate precipitates within the powder has already been reported in several studies in the case of laser powder bed fusion process (Ref 31, 32).
Fig. 8.
(a) Cross-sectional SEM-BSE micrograph of the as-received powder highlighting nanosphere precipitates (pointed with arrows) (b) TEM high-angle annular dark-field (HAADF) image of an as-received particle with a precipitate circled in solid line. (c) EDS elemental maps of the same zone and silica nanosphere circled in solid lines
Silica-Rich Particles in the as-Sprayed State
In the as-sprayed state, the PPBs appeared as fragmented solid lines (Fig. 4j). SEM-EDS analysis demonstrated that they were enriched in silicon. Furthermore, the presence of spherical precipitates was noticed, similar in shape, in size (i.e., 0.12 ± 0.03 µm in diameter) and in chemical composition to those observed in the free powder (Fig. 8).
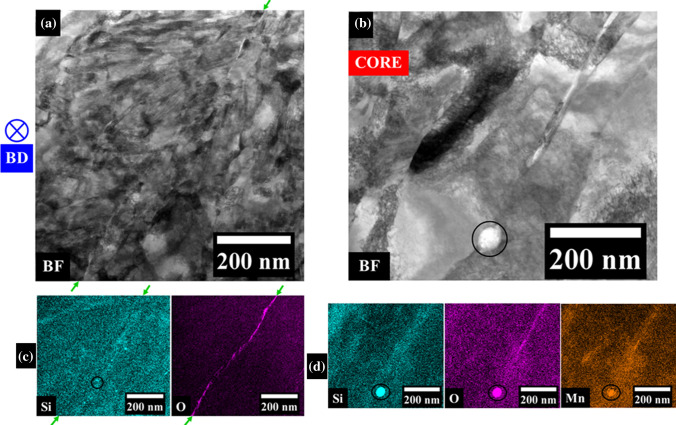
Fig. 9a shows a TEM bright-field (BF) image of a region containing two skin zones on both sides of a particle–particle interface. EDS analysis of the region of Fig. 9b, shown in Fig. 9c, demonstrated that the interface was enriched in oxygen and silicon. Oxygen-rich regions were shaped as a fragmented layer, probably coming from the impact of the particle. Silicon-rich areas were distributed as nanospheres of 6.5 ± 1.7 nm in diameter. Other larger silicate particles, up to 60 nm in diameter, were also found in the core of sprayed particles as shown in Fig. 9d.
Fig. 9.
(a) TEM bright-field image of the as-sprayed coating skin zones with particle–particle interfaces marked by solid arrows. (b) TEM bright-field image of an as-sprayed coating core with a silica nanosphere (in the solid line circle). (c,d) EDS elemental maps on the same zones and silica nanospheres surrounded by a solid line
First Stage of Oxide Evolution (F650, G800)
First of all, silicate precipitates, whether located in core zones or at PPBs, did neither evolve after a treatment at low temperature (650 °C) with a slow heating (1.25 °C.s-1) nor at higher temperature (800 °C), yet with a higher heating rate (200 °C.s-1). Indeed, as can be seen in Fig. 5b and Fig. 7b, the nano-spherical precipitates showed the same morphology and size as those observed in the as-sprayed state (Fig. 4j). (average diameter of 0.14 ± 0.03 and 0.12 ± 0.02 µm, respectively, for F650 and G800 samples).
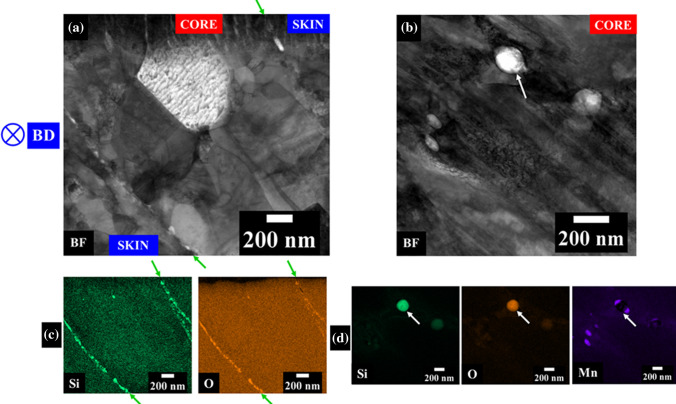
Nevertheless, TEM observations of the G800 sample revealed silica enrichment at PPBs (Fig. 10a,c). On the other hand, unlike in the as-sprayed sample (Fig. 9c), enrichment in silicon was spatially correlated with enrichment in oxygen. This evolution tends to involve thermally activated diffusion of silicon along the PPB and, contrary to what SEM observations would suggest (Fig. 7b). This testifies the beginning of PPB evolution at a very fine scale. Particle cores (Fig. 10b) presented silicate oxides like those observed in Fig. 9b. Given the small size of the core regions in this sample (about 1 µm), the zone in Fig. 10b was certainly part of a core region. While particles located in core areas did not evolve significantly after a G800 treatment compared to the as-sprayed sample (i.e., up to 35 µm), those located at PPBs displayed a larger average diameter (i.e., 33.5 ± 8 nm vs 6.5 ± 2 nm).
Fig. 10.
TEM observation of the G800 coating. (a) Bright-field image with particle–particle interfaces indicated by arrows. (b) Bright-field image of a core zone with a silica-rich nanosphere indicated by arrows. (c, d) EDS elemental maps of the zones, respectively, in (a) and (b)
Particle Characterization in the Fully Recrystallized Microstructure (D1000, F1000, G100030s)
Regardless of the treatment kinetics leading to complete recrystallization of the coating (see Section "Recovery and recrystallization of the coatings during the heat treatment"), the silica-rich precipitates located at PPBs had coarsened, while those located in core zones did not evolve significantly.
For the F1000 treatment, which involved slow heating (1.25 °C.s-1), PPBs gave way to dotted lines (Fig. 7k) formed by silicate precipitates with a size of 0.31 ± 0.05 µm (vs 0.12 ± 0.03 µm in the as-sprayed state). In addition, at PPB triple junctions, coarser precipitates of the same nature were noticed, with an average size of 2.69 ± 0.67 µm. This suggests the occurrence of fast atomic diffusion paths along PPBs during the heat treatment. Coarsening of silicate precipitates during the heat treatment has already been observed in the case of 316L materials manufactured by laser powder bed fusion (Ref 31–35). Similar features were observed for the other (faster) treatments. Namely, the D1000 treatment (50 °C.s-1) led to precipitates of 0.18 ± 0.03 µm at PPBs and 1.09 ± 0.24 at PPB triple junctions (Fig. 7f). The G100030s treatment resulted in precipitates with a diameter of 0.24 ± 0.07 µm along PPBs and of 0.84 ± 0.20 µm at PPB triple junctions (Fig. 7h).
Silicate precipitates initially located in the core areas did not evolve, keeping an average diameter of 0.16 ± 0.04 µm, 0.12 ± 0.03 µm and 0.12 ± 0.03 µm (vs 0.12 ± 0.03 µm in the as-sprayed state), respectively, for F1000, D1000 and G100030s.
Micro- and Nanohardness Evolution with Heat Treatments
The microhardness of the coatings evolved according to the applied heat treatment and its heating rate (Table 3). In the as-sprayed state, high hardness was measured (i.e., 431 ± 39 HV0.05). After skin recrystallization (obtained after the F650 and G800 treatments), the hardness did not change significantly (430 ± 26 HV0.05 and 464 ± 19 HV0.05) compared to the as-sprayed coating. The extension of recrystallization to core areas was accompanied by a significant decrease in microhardness (315 ± 11 HV0.05). Finally, after complete recrystallization of the coating, the microhardness decreased significantly. Moreover, the slower the heating rate, the lower the microhardness for a given value of the holding temperature (respectively 268 ± 10 HV0.05, 244 ± 11 HV0.05, 242 ± 13 HV0.05 and 209 ± 9 HV0.05 for G100030s, D800, D1000 and F1000 samples). The minimum hardness was obtained in the case of the treatment with the slowest heating and for the longest isothermal stage (F1000).
Table 3.
Summary of coating microhardness measurements (HV values) and of nanohardness results (in GPa)
| Heat treatment | Hardness (HV0.05) | Hardness, H (GPa) | Young’s modulus, E (GPa) | Skin | Core |
|---|---|---|---|---|---|
| Global | Skin | Core | |||
| AS | 431 ± 39 | 5.9 ± 0.4 | 5.0 ± 0.5 | 178 ± 8 | 173 ± 8 |
| F650 | 430 ± 26 | … | … | … | … |
| G800 | 464 ± 19 | 4.1 ± 0.7 | 4.4 ± 0.7 | 176 ± 30 | 186 ± 20 |
| G1000 | 315 ± 11 | … | … | … | … |
| G100030s | 268 ± 10 | 3.5 ± 0.3 | 3.5 ± 0.4 | 213 ± 8 | 212 ± 15 |
| D800 | 244 ± 11 | … | … | … | … |
| D1000 | 242 ± 13 | … | … | … | … |
| F1000 | 209 ± 9 | … | … | … | … |
In this work, the coating microhardness was linked to the microstructural state which, in turn, seemed to be less dependent on holding temperature than on heating rate, leading to similar results for the F650 and G800 as well as for the D800 and D1000 treatments, respectively. In addition, a strong scatter in hardness values was observed, until complete recrystallization. At this stage, a microstructural homogenization was noticed (see Section "Complete recrystallization (F1000, D1000, G100030s)" but a gradient was still observed between the skin and core zones, which may explain the slight residual scatter regarding microhardness.
The nanohardness (H) evolution in the case of a complete recrystallization of skin areas (i.e., G800) and coating complete recrystallization (i.e., G1000-30s) compared to the initial state (AS) is summarized in Table 3. It is also important to note that the small variation in measured values of Young’s modulus (E) brings confidence in the reliability of the hardness results.
Firstly, the complete recrystallization of the skin areas was correlated with a decrease in their measured nanohardness. The core areas showed little change in hardness with respect to the as-sprayed state. These results are in agreement with the involved microstructural evolutions (Fig. 7).
Secondly, in the case of complete recrystallization of the coating, a decrease in nanohardness of both the core and skin areas was observed, accompanied by a homogenization of the values between these two areas. These observations are again in agreement with the highlighted microstructural evolutions (Fig. 7).
Discussion
Toward a Description of Recrystallization in Annealed Coatings
The microstructural evolution of 316L cold sprayed coatings under the effect of heat treatment is essentially based on the progressive disappearance of deformation structures inside the former powder particles (Fig. 7l,m,n,o). The presence of two types of microstructures was observed in the as-sprayed coating, namely in the core and the skin areas. This affected the local recrystallization kinetics, which was shown to be inhomogeneous.
With the results on microstructural evolution in mind, three stages of the recrystallization process could be identified. First, during short heat cycles and for limited maximum temperature (from 650 to 800 °C), the skin zones recrystallized (Fig. 7m), being higher-energy-containing areas where deformation concentrated upon impact (Fig. 7l). Recrystallization then extended into core areas (Fig. 7n), in the case of short cycles at high temperature (G1000). When treated at 1000°C, a complete recrystallization could be achieved for various heating rates (F1000, D1000 and G100030s).
During these stages, an evolution of the grain size has been demonstrated. In addition, the grain size distribution evolved as a function of the applied cycle. Thus, approaching the last recrystallization stage (Fig. 7o), a smoother grain size gradient appeared and the delimitation between core and skin zones became less clear. This is expected to be beneficial to the mechanical properties by limiting stress concentration at PPBs.
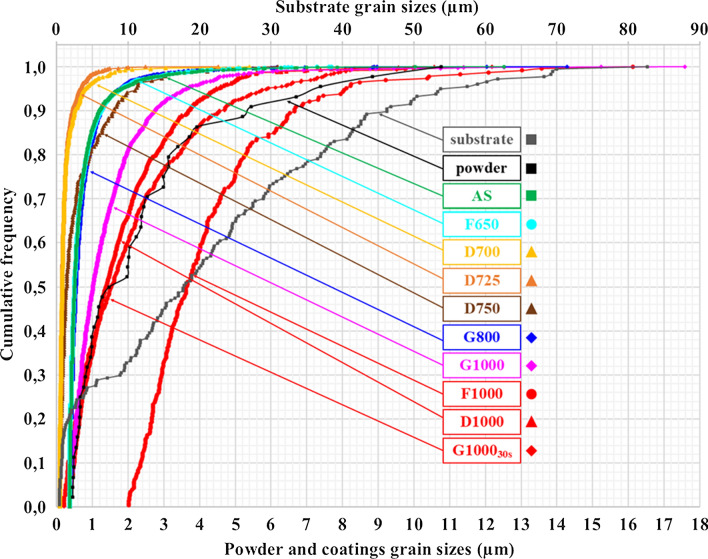
Fig. 11 illustrates the evolution of grain size distributions with maximum heat cycle temperature, as well as the effect of the heating rate. In the as-sprayed state, the grain size was mainly ranged below 1 µm. TEM analysis (Fig. 4f,g) also showed the presence of nano-grains, with an average size of 41 ± 10 nm. These were accessible by EBSD only for D700 and D725 coatings, thanks to the finer EBSD step size used (0.025 µm). They were not observed, on the contrary, for other samples. This explains the apparent shift toward smaller grain sizes for D700 and D725 samples compared to the as-sprayed coating. The recrystallization of skin areas, obtained for the F650 and G800 coatings, did not seem to be accompanied by significant changes in grain size. However, when comparing D700 (i.e., similar to an as-sprayed state) and D750 (i.e., full recrystallized skin zones) coatings, a higher proportion of larger grains was noticed in the latter.
Fig. 11.
Cumulative frequency evolution of the grain size distributions. Values for the substrate grain sizes are to be read on the upper horizontal axis; values for the initial powder and for all coatings are to be read on the lower horizontal axis
The G1000 treatment, characterized by an extension of the recrystallization toward core areas (Fig. 7n), shifted the grain size distribution toward larger values compared to the as-sprayed coating. However, the observed minimum size remained the same as that of the initial coating, which can be attributed to the still incomplete recrystallization phenomenon and to the persistence of subgrains within the coating.
Upon complete recrystallization, reached at 1000 °C in the present work, the grain size distribution evolved differently depending on the heating rate. Thus, despite a similar trend (i.e., microstructural homogenization and grain growth), only the slower heating rate (F1000) allowed a clear increase in grain size, compared to the as-sprayed coating and the initial powder. In addition, the D1000 treatment (heating rate of 50 °C.s-1) led to significant homogenization in grain size distribution toward that in the initial free powder, compared to the G100030s (heating rate of 300 °C.s-1). This is correlated to the short circuit diffusion mechanism at PPBs that enhances the evolution of oxide precipitates, allowing increased mobility of the grain boundaries. However, microstructural homogenization and grain size coarsening remain limited compared to what happened in the substrate. The difference in chemistry (substrate made of 304 and coating made of 316 stainless steels) probably does not completely explain this phenomenon, as grain sizes in annealed 316 stainless steels are close to that of the substrate in the present study (Ref 21). Grain boundary migration thus seemed to be still limited in the coatings, and certainly constrained by the presence of silicate-rich precipitates at particle boundaries, as already observed in literature (Ref 34).
The observation of grain growth, although limited, suggests a discontinuous recrystallization mechanism. It is yet difficult to unambiguously conclude about continuous vs. discontinuous recrystallization. Indeed, the nano-grains observed in the as-sprayed state were smaller than the smallest grains generally reported in the case of continuous recrystallization in coarser-grained materials (i.e., 41 ± 10 nm vs a few µm) (Ref 36). Moreover, the duplex character of the cold spray coatings microstructures made recovery and recrystallization to occur separately in core and skin areas. This phenomenon is illustrated in Fig. 12, showing a G800 EBSD image quality map together with a visualization of HAGBs and LAGBs. Here, recovery started from skin areas, slightly extending to core areas.
Fig. 12.
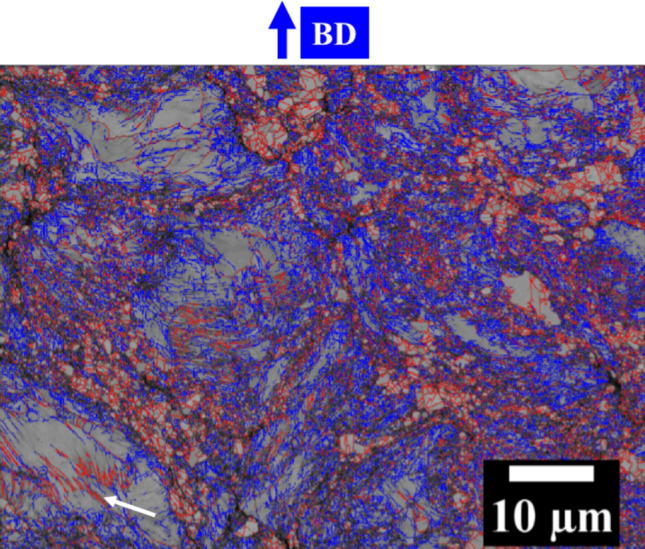
EBSD image quality map of the G800 heat-treated coating, showing LAGBs (in blue) and HAGBs (in red), with some nanotwins indicated by a solid line arrow
Microstructural Evolutions at Interfaces
The respective evolutions of PPBs and of the substrate–coating interface under heat treatment were similar (Fig. 7p,q,r,s).
In the as-sprayed state (Fig. 7p), particle boundaries appeared as more or less fragmented continuous lines composed of oxygen-rich precipitates as a thin fragmented layer and in silicon-rich regions distributed as nanospheres (Fig. 9). The substrate–coating interface also appeared as a continuous line, morphologically similar to particle–particle interfaces. A hardened layer below the substrate–coating interface, resulting from successive particle impacts, was observed. During recrystallization, silicate precipitates coarsened and PPBs gave way to silica-rich precipitates arranged into arrays, appearing as dotted lines in cross-sectional micrographs, as could be observed for example in Fig. 7k,f,h. The substrate–coating interface evolved in the same way and the hardened layer in the substrate eventually completely recrystallized.
This work demonstrated that the black regions observed in the as-sprayed state and evolving under the effect of heat treatment, only partially identified in literature (Ref 14, 20), mainly corresponded to silicates, and not to porosities. This phenomenon has already been observed in the case of laser powder bed fusion (Ref 31-35). The mechanism of formation of oxides, at particle–particle interfaces in cold spray coatings, is outside the scope of the present study. However, these particles certainly affected the microstructural evolution by hindering grain growth. This is due to the fact that, although their location did not evolve, silica-rich nanospheres did not disappear but coarsened by solid-state diffusion, leading to a strong pinning effect.
As PPBs are continuous regions all across the coatings and as they evolved into array of hard particles, the effect of oxide arrays on mechanical properties, and more precisely on the fracture behavior, was assessed. An exploratory study investigated the room temperature tensile fracture behavior of an as-sprayed sample and of a fully recrystallized sample. The fracture surface of the latter is presented in Fig. 13. Crack propagation systematically occurred along particle–particle interfaces and small dimples systematically originated from the silicate-rich nanospheres. These precipitates, whose size consistently corresponded to those presented in the Results Section of the present work, appeared therefore still harmful to the coating fracture resistance. Thus, despite a clear improvement in elongation at failure (from 2 % in the as-sprayed state to 35 % after complete recrystallization), the fracture mechanism remained dominated by the presence of these silicate-rich precipitates that also pinned grain boundaries at PPBs. Further improvement of mechanical properties thus implies working on the origin and evolution of these oxides.
Fig. 13.
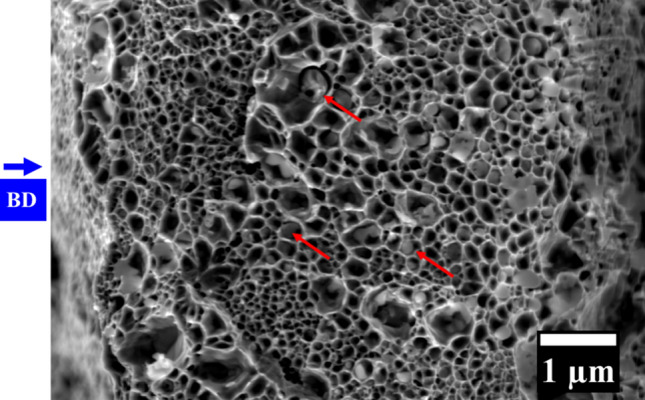
SEM secondary electron image of the fracture surface after a tensile test on a fully recrystallized coating (type F1000), highlighting silica-rich precipitates inside fine dimples (red arrows)
Variety of Microstructures that can be Obtained from a Single Cold Spray Coating after Post-Spraying Heat Treatments
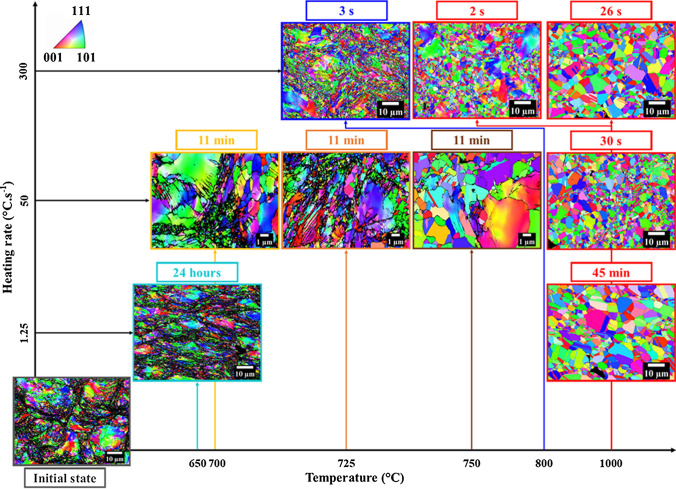
A variety of microstructures were obtained in this study, starting from a single set of coating parameters and by tuning the heat treatment conditions (Fig. 14).
Fig. 14.
Summary of microstructural evolution of coatings with applied post-spraying heat treatment. The holding time at maximum temperature is indicated on the top of each EBSD IPF map. Heating rates (to be read along the vertical axis) and holding temperatures (to be read along the horizontal axis) are set point values. Some heat treatment temperatures have been shifted from their location along the horizontal axis, see arrows linking the EBSD maps to the corresponding set point temperatures (one arrow color per value of temperature)
In summary, at low temperatures (up to 650°C for long-lasting heat treatments and up to 800°C for shorter heat treatments), the microstructural evolution was almost negligible, except that some reduction in defect density was detected by XRD due to the incipient recrystallization of skin regions. Those treatments can be mainly considered for stress relieving purposes, as confirmed by in situ XRD analyses. Moreover, the fraction of HAGBs and the maximum GOS values suggest that only recovery occurs in these conditions in the vast majority of the material.
At higher temperatures, there was a competition between complete recrystallization into fine grains and the appearance of undesired phenomena, such as coarsening of the silica-rich precipitates (F1000, D1000 and G100030s). For those treatments, a homogenized microstructure, with finer grain sizes compared to a forged 316L material (between 50 and 80 µm according to (Ref 21)), was obtained.
The high hardness values of heat-treated coatings, compared to the hardness reported for annealed 316L (i.e., 155 HV (Ref 37)) could be related to a difference in grain size. Moreover, the localization of plastic deformation into the skin areas probably produced a major contribution of defects in these areas to the FWHM, which is evidenced by the detection of its evolution alone in in situ XRD measurements up to 700 °C. Furthermore, the microhardness values reflected a global evolution of the coating (the typical indent size being 14 µm in the case of an as-sprayed coating and 21 µm in the case of F1000 coating, compared to the 1-µm thickness of skin areas) and therefore did not allow for decorrelation of the skin and core areas. On the other hand, the nanohardness measurements made it possible to demonstrate the separate evolution of hardness in these two zones under the effect of heat treatment. The hardness and microstructure of the core and skin zones homogenized once the complete recrystallization of the coating was obtained; this explains the minimal scatter of the microhardness results obtained in the fully recrystallized state.
In order to evaluate the effect of heat treatments on the mechanical properties of those coatings in more detail, 3-point bending and impact toughness tests are currently underway for the most promising treatments presented in this work.
Conclusions
Rationalizing the design of heat treatments applied to 316L cold sprayed coatings requires taking various metallurgical phenomena into account, which affect the microstructural evolution and the resulting mechanical properties. This study first enabled to identify the different temperatures of interest and the mechanisms responsible for the microstructural evolution in 316L stainless steel cold sprayed coatings. It was shown that the cold spray process produced a strongly deformed, heterogeneous, out-of-equilibrium microstructure. Moreover, for each deformed particle in the coating, a microstructural difference between its skin and core regions was highlighted. This induced a difference in the recrystallization behavior of the two zones, as a heritage that was retained even after complete recrystallization. This study provides evidences of the separate evolution of each of these two zones, through local analysis of their nanohardness and microstructure, and of their evolution under the effect of heat treatment.
The microstructural variety achievable with different heat treatments, starting from the same sprayed material, has also been demonstrated. Three main conclusions can be highlighted:
Recovered coatings, with small grains and a hardness around 400 HV0.05, were obtained for treatments at 650 °C for 24 hours and at 800 °C for a few seconds;
Partially recrystallized coatings, with full recrystallization of skin areas, characterized by a lower hardness (around 300 HV0.05) and small grain sizes were obtained by treatments at 1000°C for a few seconds;
Fully recrystallized coatings, with recovered hardness values around 200 HV0.05 and with fine grain size (i.e., maximum G10, G50 and G90 percentiles, respectively, equal to 2.37, 3.65 and 6.65 µm) were obtained through treatments at 800 °C to 1000 °C for holding times from 30 seconds to 45 minutes.
It was also shown that, although a homogenization of the microstructure was achieved after the complete recrystallization of coatings, their fracture properties were still dictated by the presence of precipitates at PPBs. By the way, the nature of the black regions located at particle boundaries in the coating and evolving during heat treatment was elucidated and their size evolution due to coarsening was quantified. These silica-rich nanospheres affected the microstructural evolution, reducing grain boundary mobility during recrystallization. Their presence also deteriorated the ductile fracture behavior of the coating. In fact, silica-rich PPBs were preferential sites for crack initiation and propagation. It is therefore of primary interest to control the powder purity for cold spray repair applications, as the mechanical weakness of the particle–particle interfaces is not the responsibility of the matrix only.
Acknowledgments
The authors would like to thank the ANRT (Association Nationale Recherche Technologie) for financial support under CIFRE grant No. 2018/1182. The authors would like to thank Naval Group and AddUp, partners of this study, for their financial support. Particularly, many thanks to Mr. T. Girard from EDF for spraying coatings; to Mr. A. Le Drou from EDF for his technical support on metallographic characterization and to Mr. N. Brynaert from EDF for the nanohardness measurements. Many thanks also to Dr. C. Monteiro and Dr. S. Dépinoy from MINES ParisTech for their help and discussions regarding XRD analysis.
Footnotes
This article is an invited paper selected from presentations at the 2021 International Thermal Spray Conference, ITSC2021, that was held virtually May 25-28, 2021 due to travel restrictions related to the coronavirus (COVID-19) pandemic. It has been expanded from the original presentation.
Publisher's Note
Springer Nature remains neutral with regard to jurisdictional claims in published maps and institutional affiliations.
References
- 1.Assadi H, Gärtner F, Stoltenhoff T, Kreye H. Bonding Mechanism in Cold Gas Spraying. Acta Mater. 2003;51:4379–4394. doi: 10.1016/S1359-6454(03)00274-X. [DOI] [Google Scholar]
- 2.Adachi S, Ueda N. Effect of Cold-Spray Conditions using a Nitrogen Propellant Gas in AISI 316L Stainless Steel Coating Microstructures. Coat. 2017;7:87–96. doi: 10.3390/coatings7070087. [DOI] [Google Scholar]
- 3.R. Maestracci, Influence de la Microstructure sur les Mécanismes D’endommagement Thermomécanique de Revêtements à base d’acier Inoxydable AISI 316L Réalisés Par Projection Dynamique Par Gaz Froid « cold spray » (Influence of the microstructure on the thermomechanical damage mechanisms of AISI 316L stainless steel coatings produced by cold spray), PhD thesis, MINES ParisTech, 2016, https://pastel.archives-ouvertes.fr/tel-01561419, in French
- 4.Jiang X, Overmann N, Smith C, Ross K. Microstructure, Hardness and Cavitation Erosion Resistance of Different Cold Spray Coatings on Stainless Steel 316 for Hydropower Applications. Mater. Today Commun. 2020;25:101305. doi: 10.1016/j.mtcomm.2020.101305. [DOI] [Google Scholar]
- 5.Widener C, Carter M, Ozdemir O, Hrabe R, Hoiland B, Stamey T, Champagne V, Eden TJ. Application of High Pressure Cold Spray for an Internal Bore Repair if a Navy Valve Actuator. J. Therm. Spray Technol. 2016;25:193–201. doi: 10.1007/s11666-015-0366-4. [DOI] [Google Scholar]
- 6.Champagne V, Helfritch D. Critical Assessment 11 Structural Repairs by Cold Spray. J. Mater. Sci. Technol. 2015;31:627–634. doi: 10.1179/1743284714Y.0000000723. [DOI] [Google Scholar]
- 7.Y. Hu, F. Renteria, C. Cahoon and M. Floyd, U.S. Patent App. 10/930,506, (2006)
- 8.A. Debiccari, J. Haynes, U.S. Patent App. 11/003,140, (2006)
- 9.A. Debiccari, J. Haynes and D. Rutz, U.S. Patent App. 11/019,871, (2006)
- 10.D. Raybould, M.N. Madhava, V. Chung, T.R. Duffy and M. Floyd, U.S. Patent 7,455,881, (2008)
- 11.K. Ogawa, D. Seo, Repair of Turbine Blades using Cold Spray Technique, Advances in Gas Turbine Technology, Dr. Ernesto Benin (Ed.), Intech, p 500-525, (2011) 10.5772/23623
- 12.Huang R, Sone M, Ma W, Fukanuma H. The Effects of Heat Treatments on the Mechanical Properties of Cold-Sprayed Coatings. Surf. Coat. Technol. 2015;261:278–288. doi: 10.1016/2014.11.017. [DOI] [Google Scholar]
- 13.Sundararajan G, Phani PS, Jyothirmayi A, Gundakaram RC. The influence of heat treatment on the microstructural, mechanical and corrosion behaviour of cold sprayed SS 316L coatings. J. Mater. Sci. 2009;44:2320–2326. doi: 10.1007/s10853-008-3200-2. [DOI] [Google Scholar]
- 14.Al-Mangour B, Vo P, Mongrain R, Irissou E, Yue S. Effect of Heat Treatment on the Microstructure and Mechanical Properties of Stainless Steel 316L Coatings Produced by Cold Spray for Biomedical Application. J. Therm. Spray Technol. 2014;23:641–652. doi: 10.1007/s11666-017-0640-8. [DOI] [Google Scholar]
- 15.Dikici B, Yilmazer H, Ozdemir I, Isik M. The Effet of Post-Heat Treatment on Microstructure of 316L Cold-Sprayed Coatings and their Corrosion Performance. J. Therm. Spray Technol. 2016;25:704–714. doi: 10.1007/s11666-016-0402-z. [DOI] [Google Scholar]
- 16.Sundararajan G, Chavan NM, Kumar S. The Elastic Modulus of Cold Spray Coatings: Influence of Inter-Splat Boundary Cracking. J. Therm. Spray Technol. 2014;22:1348–1357. doi: 10.1007/s11666-013-0024-5. [DOI] [Google Scholar]
- 17.Al-Mangour B, Mongrain R, Irissou E, Yue S. Improving the Strength and Corrosion Resistance of 316L Stainless Steel for Biomedical Applications using Cold Spray. Surf. Coat. Technol. 2013;216:297–307. doi: 10.1016/j.surfcoat.2012.11.061. [DOI] [Google Scholar]
- 18.Yin S, Cizek J, Yan X, Lupoi R. Annealing Strategies for Enhancing Mechanical Properties of Additively Manufactured 316L Stainless Steel Deposited by Cold Spray. Surf. and Coat. Technol. 2019;370:353–361. doi: 10.1016/j.surfcoat.2019.04.012. [DOI] [Google Scholar]
- 19.Bagherifard S, Kondas J, Monti S, Cizek J, Perego F, Kovarik O, Lukac F, Gaertner F, Guagliano M. Tailoring Cold Spray Additive Manufacturing of Steel 316L for Static and Cyclic Load-Bearing Applications. Mater. & Des. 2021;203:109575. doi: 10.1016/j.matdes.2021.109575. [DOI] [Google Scholar]
- 20.Stoltenhoff T, Borchers C, Gärtner F, Kreye H. Microstructures and Key Properties of Cold-Sprayed and Thermally Sprayed Copper Coatings. Surf. Coat. Technol. 2006;200(16-17):4947–4960. doi: 10.1016/j.s.2005.05.011. [DOI] [Google Scholar]
- 21.Peckner D, Bernstein IM. Handbook of Stainless Steels. 1. New York: McGraw-Hill; 1977. [Google Scholar]
- 22.Parvathavarthini N, Dayal R, Khatak H, Shankar V, Shanmugam V. Sensitization Behavior of Modified 316N and 316L Stainless Steel Weld Metals After Complex Annealing and Stress Relieving Cycles. J. Nucl. Mater. 2006;355:68–82. doi: 10.1016/j.jnucmat.2006.04.006. [DOI] [Google Scholar]
- 23.Zhang MX, Yang B, Wang SL, Wu HC. Mechanisms of Thermo-Mechanical Process on Grain Boundary Character Distribution of 316L Austenitic Stainless Steel. Mater. Sci. Forum. 2016;850:965–970. doi: 10.4028/www.scientific.net/MSF.850.965. [DOI] [Google Scholar]
- 24.Naghizadeh M, Mirzadeh H. Microstructural Evolutions during Reversion Annealing of Cold-Rolled AISI 316 Austenitic Stainless Steel. Metall. Mater. Trans. A. 2018;49:2248–2256. doi: 10.1007/s11661-018-4583-6. [DOI] [Google Scholar]
- 25.Bertaut F. Signification de la Dimension Crystalline Mesurée d’après la Largeur de raie Debye-Scherrer. Comptes-Rendus Hebdomadaires des Séances de l’Académie des Sciences. 1948;228:187–189. [Google Scholar]
- 26.Li WY, Liao H, Li CJ, Bang HS, Coddet C. Numerical Simulation of Deformation Behavior of Al Particles Impacting on Al Substrate and Effect of Surface Oxide Films on Interfacial Bonding in Cold Spraying. Appl. Surf. Sci. 2007;253:5048–5091. doi: 10.1016/2006.11.020. [DOI] [Google Scholar]
- 27.Guetta S, Berger M-H, Borit F, Guipont V, Jeandin M, Boustie M, Ichikawa Y, Sakaguchi K, Ogawa K. Influence of Particle Velocity on Adhesion of Cold-Sprayed Splats. J. Therm. Spray Technol. 2009;18:331–342. doi: 10.1007/s11666-009-9327-0. [DOI] [Google Scholar]
- 28.Grujicic M, Zhao C, DeRosset W, Helfritch D. Adiabatic Shear Instability based Mechanism for Particles/Substrates Bonding in the Cold-Gas Dynamic Process. Mater. Des. 2004;25:681–688. doi: 10.1016/j.matdes.2004.03.008. [DOI] [Google Scholar]
- 29.Li W-Y, Gao W. Some Aspects on 3D Numerical Modeling of High Velocity Impact of Particles In Cold Spraying by Explicit Finite Element Analysis. Appl. Surf. Sci. 2009;255:7878–7892. doi: 10.1016/j.apsusc.2009.04.135. [DOI] [Google Scholar]
- 30.Ichikawa Y, Tokoro R, Tanno M, Ogawa K. Elucidation of Cold-Spray Deposition Mechanism by Auger Elctron Spectroscopic Evaluation of Bonding Interface Oxide Film. Acta Mater. 2019;164:39–49. doi: 10.1016/j.actamat.2018.09.041. [DOI] [Google Scholar]
- 31.Deng P, Karadge M, Rebak RB, Gupta VK, Prorok BC, Lou X. The Origin and Formation of Oxygen Inclusions in Austenitic Stainless Steels Manufactured by Laser Powder Bed Fusion. Addit. Manuf. 2020;35:101334. [Google Scholar]
- 32.Yang X, Tang F, Hao X, Li Z. Oxide Evolution During the Solidification od 316L Stainless Steel from Additive Manufacturing Powders with Different Oxygen Contents. Metall. Mater. Trans. B. 2021 doi: 10.1007/s11663-021-02191-w. [DOI] [Google Scholar]
- 33.Riabov D, Rashidi M, Hryha E, Bengtsson S. Effect of the Powder Feedstock on the Oxide Dispersion Strengthening of 316L Stainless Steel Produced by Laser Powder Bed Fusion. Mater. Charact. 2020;169:110582. doi: 10.1016/j.matchar.2020.110582. [DOI] [Google Scholar]
- 34.Voisin T, Forien JB, Perron A, Aubry S, Bertin N, Samanta A, Baker A, Wang YM. New Insights on Cellular Structures Strengthening Mechanisms and Thermal Stability of an Austenitic Stainless Steel Fabricated by Laser Powder Bed Fusion. Acta Mater. 2021;203:116476. doi: 10.1016/j.actamat.2020.11.018. [DOI] [Google Scholar]
- 35.Zhou X, An Z, Shen Z, Liu W, Yao C. Particles Control in Selective Laser Melting in situ Oxide Dispersion Strengthened Method. IOP Conf. Series: Materials Sci. Eng. 2017 doi: 10.1088/1757-899X/167/1/012048. [DOI] [Google Scholar]
- 36.F.J. Humphreys, M. Hatherly, A. Rollett, G. S. Rohrer, Recrystallization and Related Annealing Phenomena, 2nd ed., Elsevier. (2004)
- 37.M.F. McGuire, Stainless Steels for Design Engineers, ASM International. (2008)


