Abstract
Four rare 3-decalinoyltetramic acid derivatives, zofielliamides A–D (1–4), were obtained from cultures of kiwi-associated fungus Zopfiella sp. Their structures with absolute configurations were established by extensive spectroscopic methods and single crystal X-ray diffraction. The compounds possessed rare pentacyclic systems that might derive from a polyene precursor via [4 + 2] intramolecular Diels–Alder reactions. Compounds 1, 2, and 4 showed antibacterial activity against plant pathogen Pseudomonas syringae with MIC values of 64, 32, and 64 μg mL−1, respectively.
Four rare 3-decalinoyltetramic acid derivatives, zofielliamides A–D (1–4), were obtained from cultures of kiwi-associated fungus Zopfiella sp.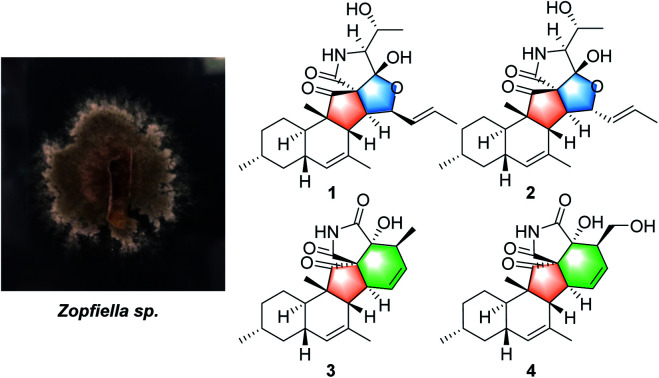
Introduction
For a long time, natural products have been a good source of leading compounds for drug discovery,1 while fungal products with unique and diverse scaffolds are extraordinarily valuable sources.2 It is estimated that there are 2.2 to 3.8 million fungal species.3 However, the number of described fungal species currently stands at around 120 000.3 Therefore, fungi are important biological resources and a huge treasure house for mining active natural products. Endophytic fungi, due to the process of co-evolution with the host plants, produce a series of active secondary metabolites. Our recent chemical investigations on endophytic fungi reported a number of bioactive secondary metabolites including terpenoids, cytochalasans, and epsidones.4–7
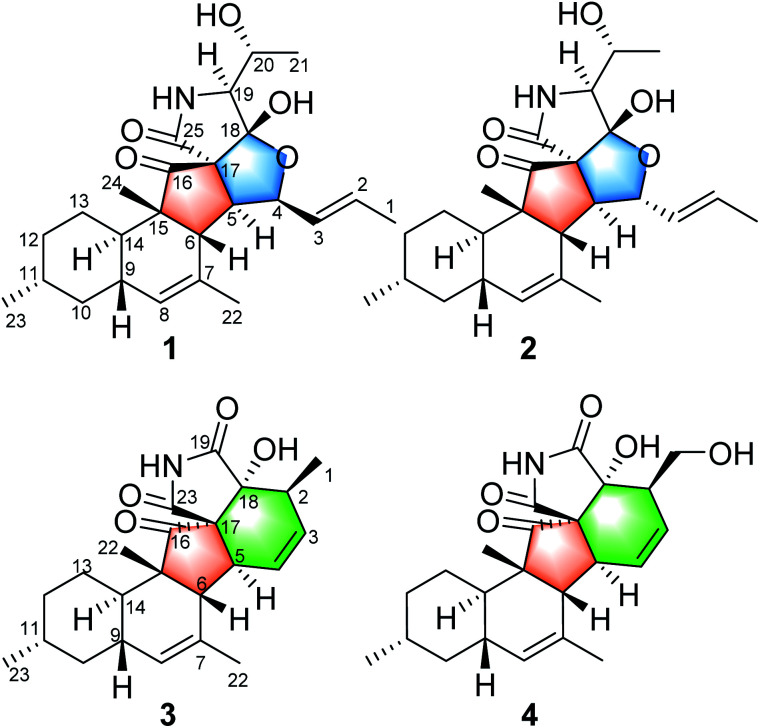
Zopfiella sp. is an endophytic fungus that was isolated from kiwi plant (Actinidia chinensis Planch). A plate face-off method experiment indicated that the fungus Zopfiella sp. could inhibit the growth of Pseudomonas syringae, a well-known pathogen that causes kiwi fruit canker disease.8 In order to discover the antibacterial chemical constituent from this fungus, a chemical investigation on the extract of the fermentation in rice medium was carried out. Previously, bisabolane sesquiterpenoids and α-pyrones were obtained and reported.8 Currently, four 3-decalinoyltetramic acid derivatives, zofielliamides A–D (1–4, Fig. 1), were obtained in the study of the same extract. Their structures were established by extensive spectroscopic methods, and their absolute configurations were established by the single crystal X-ray diffraction. All compounds were evaluated for their antibacterial activity against Pseudomonas syringae. Herein, the isolation, structural elucidation, and the biological activity of these isolates are discussed.
Fig. 1. Compounds 1–4 isolated from Zopfiella sp.
Results and discussion
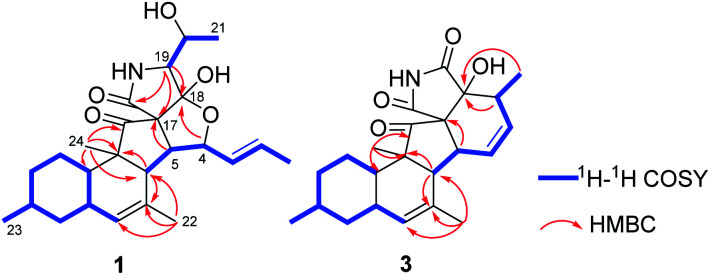
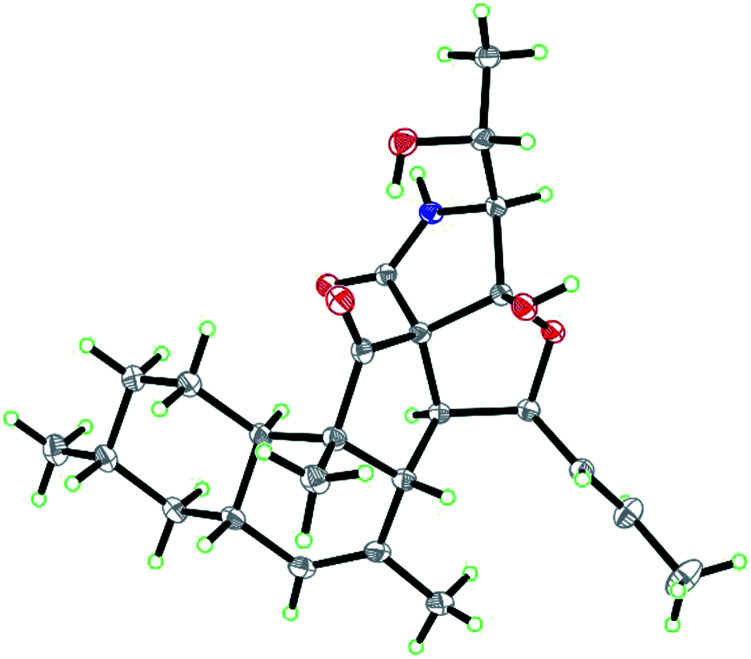
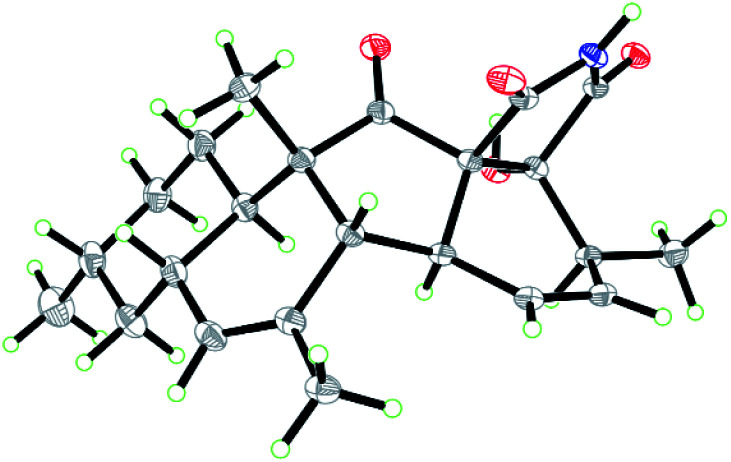
Zofielliamide A (1) was isolated as colorless crystals. Its molecular formula was determined as C25H35NO5 on the basis of HRESIMS at m/z 452.24051 [M + Na]+ (calcd for C25H35NO5Na+, 452.24074), revealing nine degrees of unsaturation. The IR absorption band at 3367, 1734, 1667, 1448 cm−1 revealed the existence of hydroxy, carbonyl, and double bonds. In the 1H NMR spectrum (Table 1), five methyl signals were readily identified including two singlets at δH 1.63 (3H, H3-22), 0.91 (3H, H3-24) and three doublets at δH 1.72 (3H, d, J = 6.5 Hz, H3-1), 1.16 (3H, d, J = 6.5 Hz, H3-21), 0.87 (3H, d, J = 6.6 Hz, H3-23). Three signals for heteroatom-containing carbons at δH 4.88 (1H, m, H-4), 4.10 (1H, qd, J = 6.5, 3.2 Hz, H-20), 3.34 (1H, d, J = 3.2 Hz, H-19) were also detected. In addition, three olefinic protons at δH 5.66 (1H, dd, J = 15.2, 6.5 Hz, H-2), 5.90 (1H, dd, J = 15.2, 9.6 Hz, H-3), 5.18 (1H, br s, H-8) indicated at least two double bonds in the structures. The 13C NMR spectrum afforded 25 carbon resonances that were ascribable for five CH3, three CH2, eleven CH, and six non-protonated carbons according to the DEPT and HSQC spectra (Table 1). Of them, signals at δC 214.4 (C, C-16) and 173.9 (C, C-25) were assigned to two carbonyl carbons, while signals at δC 131.6 (CH, C-2), 132.5 (CH, C-3), 134.3 (C, C-7), and 128.9 (CH, C-8) should be ascribable for carbons in two double bonds. These data indicated that 1 should have a pentacyclic system. The literature investigation,9–16 as well as analysis of HMBC and 1H–1H COSY data (Fig. 2), suggested that 1 should be a 3-decalinoyltetramic acid derivative related to fusarisetin A, an acinar morphogenesis inhibitor from a soil fungus, Fusarium sp. FN080326.9 The significant difference was that three additional skeletal carbons presented in 1. The 1H–1H COSY correlations from H-1 to H-3 and from H-19 to H-21, as well as HMBC correlations from H-1 to C-2 and C-3, and from C-21 to C-20 and C-19, suggested that two additional carbons (C-1 and C-2) linked to C-3 and one additional carbon (C-21) linked to C-20. Detailed analysis of 2D NMR data suggested that the other parts of 1 were the same to those of fusarisetin A.9 After attempts, a single crystal of 1 was afforded, while the single crystal X-ray diffraction not only confirmed the planar structure of 1 but also determined the absolute configuration of 1 as shown in Fig. 3 (Flack parameter = −0.03(5); CCDC: 2070473†).
1H (600 MHz) and 13C (150 MHz) data for compounds 1–4 (δ in ppm, J in Hz).
| Entry | 1a | 2a | 3b | 4a | ||||
|---|---|---|---|---|---|---|---|---|
| δ H | δ C, type | δ H | δ C, type | δ H | δ C, type | δ H | δ C, type | |
| 1 | 1.72, d (6.5) | 17.9, CH3 | 1.68, d (6.5) | 17.7, CH3 | 1.25, d (7.4) | 14.6, CH3 | 3.96, dd (10.8, 4.6) | 61.1, CH2 |
| 3.54, dd (10.8, 8.3) | ||||||||
| 2 | 5.66, dd (15.2, 6.5) | 131.6, CH | 5.76, dd (15.2, 6.5) | 130.8, CH | 2.52, m | 41.6, CH | 2.44, m | 51.2, CH |
| 3 | 5.90, dd (15.2, 9.6) | 132.5, CH | 5.40, dd (15.2, 9.6) | 132.0, CH | 5.59, dd (8.9, 2.7) | 132.9, CH | 5.84, dd (9.2, 2.9) | 129.8, CH |
| 4 | 4.88, m | 86.6, CH | 4.83, dd (9.6, 4.2) | 89.7, CH | 6.49, dd (8.9, 3.4) | 134.5, CH | 6.52, dd (9.2, 3.5) | 136.1, CH |
| 5 | 3.18, dd (9.4, 9.0) | 56.2, CH | 2.70, dd (9.7, 4.2) | 58.8, CH | 2.82, dd (10.6, 3.4) | 44.3, CH | 2.81, ddd (12.3, 3.5) | 45.5, CH |
| 6 | 2.44, d (9.4) | 48.8, CH | 2.30, d (9.7) | 55.6, CH | 3.28, d (10.6) | 48.5, CH | 3.17, d (12.3) | 49.9, CH |
| 7 | 134.3, C | 133.8, C | 132.2, C | 133.9, C | ||||
| 8 | 5.18, br s | 128.9, CH | 5.20, br s | 128.2, CH | 5.24, br s | 127.9, CH | 5.26, br s | 128.5, CH |
| 9 | 1.87, m | 37.2, CH | 1.61, m | 37.8, CH | 1.89, m | 37.2, CH | 1.92, m | 38.4, CH |
| 10 | 1.75, m; 0.77, m | 43.4, CH2 | 1.78, m; 0.78, m | 43.3, CH2 | 1.81, m; 0.73, m | 42.4, CH2 | 1.81, m; 0.74, m | 43.5, CH2 |
| 11 | 1.40, m | 34.0, CH | 1.42, m | 34.1, CH | 1.45, m | 32.8, CH | 1.44, m | 34.1, CH |
| 12 | 1.65, m; 0.93, m | 36.2, CH2 | 1.65, m; 0.93, m | 36.2, CH2 | 1.75, m; 0.87, m | 35.4, CH2 | 1.71, m; 0.85, m | 36.4, CH2 |
| 13 | 1.27, m; 0.99, m; | 26.2, CH2 | 1.30, m; 1.02, m; | 26.3, CH2 | 1.77, m; 1.16, m | 25.1, CH2 | 1.76, m; 1.14, m | 26.1, CH2 |
| 14 | 1.76, m | 37.6, CH | 1.81, m | 38.2, CH | 1.17, m | 40.2, CH | 1.26, m | 40.6, CH |
| 15 | 58.8, C | 57.7, C | 53.8, C | 54.7, C | ||||
| 16 | 214.4, C | 214.4, C | 212.5, C | 211.9, C | ||||
| 17 | 76.4, C | 76.0, C | 74.0, C | 75.8, C | ||||
| 18 | 110.7, C | 111.4, C | 80.2, C | 79.8, C | ||||
| 19 | 3.34, d (3.2) | 68.3, CH | 3.36, d (3.5) | 68.5, CH | 175.8, C | 179.2, C | ||
| 20 | 4.10, qd (6.5, 3.2) | 66.3, CH | 4.10, qd (6.5, 3.5) | 66.5, CH | 1.88, s | 23.5, CH3 | 1.88, s | 23.7, CH3 |
| 21 | 1.16, d (6.5) | 20.4, CH3 | 1.19, d (6.5) | 20.9, CH3 | 0.88, d (6.2) | 22.5, CH3 | 0.88, d (6.6) | 22.8, CH3 |
| 22 | 1.63, s | 24.7, CH3 | 1.72, s | 23.6, CH3 | 1.08, s | 16.7, CH3 | 1.01, s | 16.9, CH3 |
| 23 | 0.87, d (6.6) | 22.8, CH3 | 0.88, d (6.6) | 22.8, CH3 | 170.6, C | 174.4, C | ||
| 24 | 0.91, s | 14.3, CH3 | 0.90, s | 14.3, CH3 | ||||
| 25 | 173.9, C | 173.9, C | ||||||
| 18-OH | 3.27, s | 3.33, s | ||||||
Measured in methanol-d4.
Measured in CDCl3.
Fig. 2. Key 1H–1H COSY and HMBC correlations for 1 and 3.
Fig. 3. ORTEP diagram of 1.
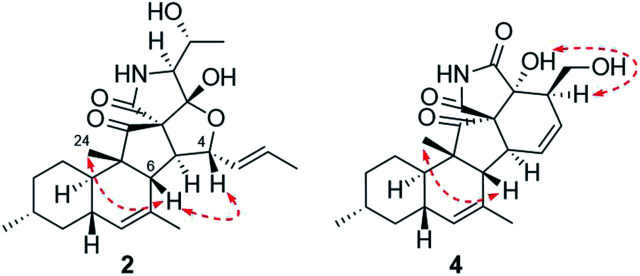
Zofielliamide B (2) was isolated as white powder. Its molecular formula was determined as C25H35NO5 by the HRESIMS data at m/z 452.24025 [M + Na]+ (calcd for C25H35NO5Na+, 452.24074), the same to that of 1. All spectroscopic data of 2 displayed similar patterns to those of 1. Detailed analysis of 2D NMR data suggested that 2 had the same planar structure to that of 1. The ROESY spectrum also display similar patterns to that of 1. However, the correlations of H-4/H-6 and H-6/H-24 suggested that H-4 should be β oriented (Fig. 4), differing from that in 1. The CD spectrum also displayed similar curve to that of 1 (see ESI†), revealing the absolute configuration as shown in Fig. 1.
Fig. 4. Key ROESY correlations for 2 and 4.
Zofielliamide C (3) was isolated as colorless crystals. The molecular formula was identified as C23H29NO4 by the HRESIMS data at m/z 406.19880 [M + Na]+ (calcd for C23H29NO4Na+, 406.19888). All the spectroscopic data suggested that 3 should also be a 3-decalinoyltetramic acid derivative. A literature investigation, as well as analysis of 2D NMR data, suggested that 3 was similar to that of phomopsichalasin.17 The significant difference was that the degradation of the p-hydroxy-benzyl group at C-19 in 3, which was replaced by a carbonyl carbon at C-19 (δC 175.8, C). In addition, two methyls at C-3 and C-9 in phomopsichalasin were degraded in 3 as supported by the HMBC and 1H–1H COSY data (Fig. 2). The single crystal X-ray diffraction supported the planar structure of 3 and determined its absolute configuration as shown in Fig. 5 (Flack parameter = 0.04(9); CCDC: 2070474†).
Fig. 5. ORTEP diagram of 3.
Zofielliamide D (4) was isolated as white powder. The molecular formula was established as C23H29NO5 according to HRESIMS data at m/z 422.19327 [M + Na]+ (calcd. for C23H29NO5Na+, 422.19379). All spectroscopic data suggested that 4 was similar to 3. A significant modification was that the methyl of C-1 in 3 was oxidized into a hydroxymethylene in 4. It was supported by the HMBC correlations from δH 3.96 (1H, dd, J = 10.8, 4.6 Hz, H-1a) and 3.54 (1H, dd, J = 10.8, 8.3 Hz, H-1b) to δC 51.2 (CH, C-2), 129.8 (CH, C-3), and 79.8 (C, C-18), as well as the 1H–1H COSY cross peak between H-1 and H-2. The ROESY data between H-2 and OH-18 suggested that H-2 should be α oriented (Fig. 4), the same to that of 3. In addition, the similar CD curve of 4 with that of 3 also suggested the absolute configuration of 4 as shown in Fig. 1 (see ESI†).
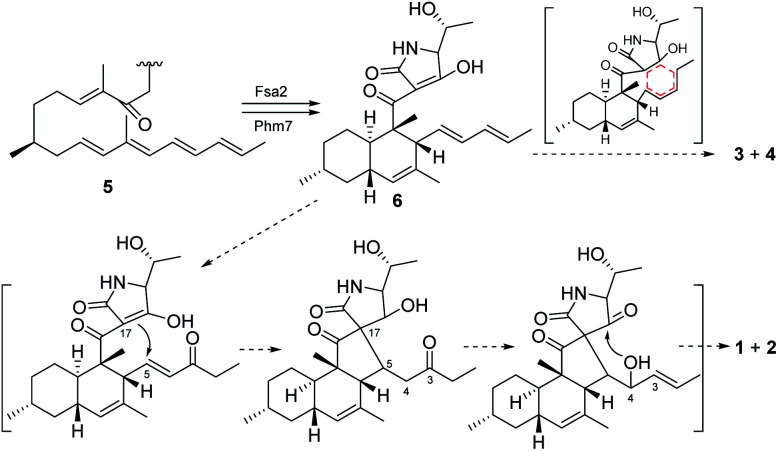
3-Decalinoyltetramic acids are a kind of special tetramic acid derivatives featured with decalin and pyrrolidine-2,4-diketone units. Due to its complex and diverse structure with good biological activity, 3-decalinoyltetramic acids have become a research focus. The structures of compounds 1–4 are intriguing because of the possibility that they might arise via a biosynthetic pathway involving a pair of net [4 + 2] intramolecular Diels–Alder reactions commencing from the polyene precursor 5 (Fig. 6). The trans-decalin formation (6) has been demonstrated as catalyzed by Fsa2-family enzymes.18 A further [4 + 2] intramolecular Diels–Alder reaction might give the final pentacyclic skeleton of 3 and 4. Compounds 1 and 2 might derive from 6via a Michael addition to give a new carbon bond between C-5 and C-17. Then a nucleophilic addition gave a hemiketal at C-18 (Fig. 6).
Fig. 6. Proposed biosynthesis for compounds 1–4.
Compounds 1–4 were evaluated for their antibacterial activity against Pseudomonas syringae. As a result, compounds 1, 2, and 4 showed antibacterial activity with MIC values of 64, 32, and 64 μg mL−1, respectively. To the best of our knowledge, this is the first report of the antibacterial activity of 3-decalinoyltetramic acid derivatives against P. syringae.
Conclusions
In summary, four new 3-decalinoyltetramic acid derivatives with rare carbon skeletons have been identified from cultures of the fungus Zopfiella sp. Their structures with absolute configurations were established. Compounds 1, 2, and 4 exhibited antibacterial activity against plant pathogen Pseudomonas syringae.
Experimental section
General experimental procedures
Optical rotations were measured on a Rudolph Autopol IV polarimeter. UV spectra were obtained on a UH5300 UV-VIS Double Beam Spectrophotometer. IR spectra were obtained by using a Shimadu Fourier Transform Infrared spectrometer with KBr pellets. NMR spectra were acquired with a Bruker Avance III 600 instrument. ECD spectra were recorded with an Applied Photophysics Chirascan-Plus spectrometer. High resolution electrospray ionization mass spectra (HRESIMS) were recorded on a LC-MS system consisting of a Q Exactive™ Orbitrap mass spectrometer with an ESI ion source used in ultra-high resolution mode (140 000, at m/z 200) and a Dionex UltiMate 3000 RSLC UPLC system. Silica gel (200–300 mesh and 500–800 mesh), RP-18 gel (40–75 μm) and Sephadex LH-20 were used for column chromatography. Preparative HPLC was performed on an Agilent 1260 liquid chromatography system with a Zorbax SB-C18 (5 μm, 9.4 × 150 mm) column and a DAD detector.
Fungal material and cultivation conditions
The endophytic fungus Zopfiella sp. was isolated from healthy tissue of kiwi plant (Actinidia chinensis Planch). It was identified as a species of the genera Zopfiella by ITS sequencing with an accession number KR154941.1. A further identification on this fungus is ongoing. Culture medium consists of glucose (5%), pork peptone (0.15%), yeast (0.5%), KH2PO4 (0.05%) and MgSO4 (0.05%). Initial pH was adjusted to 6.0, the fermentation was initially implemented on an Erlenmeyer flask for 6 days until the mycelium biomass reached to the maximum. Then it was transferred to rice medium for 24 °C in dark culture for 30 days. Rice medium: 75 g of rice, 75 mL of water, placed in a 250 mL Erlenmeyer flask, sterilized at 121 °C for 15 min, a total of 200 bottles.
Extraction and isolation
The rice cultural broth (15 kg) was extracted five times with EtOAc. The EtOAc layer was concentrated under reduced pressure to give an oily crude extract (200 g). The extract (200 g) was subjected to column chromatography on silica gel (200–300 mesh) with a gradient of CHCl3/MeOH (1 : 0, 40 : 1, 20 : 1, 10 : 1, 5 : 1, 2 : 1, 0 : 1, v/v) to obtain seven fractions (A–G). Fraction D (35 g) was subjected to MPLC, eluted with a stepwise gradient of MeOH/H2O (10 : 90–100 : 0, v/v) to afford fractions D1–D15. Fraction D6 (5 g) was fractionated by silica gel column chromatography eluting with a stepwise gradient of petroleum ether/acetone (6 : 1, 5 : 1, 4 : 1, 3 : 1, 2 : 1, 1 : 1, v/v) to yield thirteen subfractions D6-1 to D6-13. Subfraction D6-3 (82 mg) was purified on a preparative C18 HPLC column (MeCN/H2O from 30/70 to 40/60 in 25 min, 4 mL min−1) to yield 1 (6.0 mg, retention time (tR) = 12.1 min) and 2 (3.2 mg, tR = 14.4 min). Fraction E (18 g) was subjected to MPLC, eluted with a stepwise gradient of MeOH/H2O (10 : 90–100 : 0, v/v) to afford fractions E1–E8. Fraction E3 (390 mg) was isolated by silica gel eluted with petroleum ether/acetone (6 : 1) to give colorless crystals 3 (16 mg) and a mixture. The mixture was purified on a preparative C18 HPLC column (MeCN/H2O from 25/75 to 35/65 in 25 min, 4 mL min−1) to yield 4 (2.8 mg).
Zofielliamide A
Colorless crystals, mp: 273–275 °C; [α]20D = +44.4 (c 0.10, MeOH); ECD (MeOH) λmax (Δε) 224 (+11.2), 298 (+6.8) nm; IR (KBr) νmax 3367, 2947, 2833, 1734, 1667, 1448, 1031 cm−1; 1H (600 MHz) and 13C (150 MHz) NMR data, see Table 1; HRESIMS: m/z 452.24051 [M + Na]+ (calcd for C25H35NO5Na+, 452.24074).
Zofielliamide B (2)
White powder; [α]20D = +35.3 (c 0.15, MeOH); ECD (MeOH) λmax (Δε) 226 (+17.8), 298 (+6.9) nm; IR (KBr) 3400, 2949, 2837, 1731, 1651, 1454, 1018 cm−1; 1H (600 MHz) and 13C (150 MHz) NMR data, see Table 1; HRESIMS: m/z 452.24025 [M + Na]+ (calcd for C25H35NO5Na+, 452.24074).
Zofielliamide C (3)
Colorless crystals, mp: 263–270 °C; [α]20D = +94.5 (c 0.18, MeOH); ECD (MeOH) λmax (Δε) 204 (+44.2), 232 (+24.8), 317 (+8.1) nm; IR (KBr) 3491, 3232, 2947, 1735, 1699, 1215, 1132, 1091 cm−1; 1H (600 MHz) and 13C (150 MHz) NMR data, see Table 1; HRESIMS: m/z 406.19880 [M + Na]+ (calcd for C23H29NO4Na+, 406.19888).
Zofielliamide D (4)
White powder; [α]20D = +6.84 (c 0.65, MeOH); ECD (MeOH) λmax (Δε) 202 (+16.3), 233 (+6.8), 317 (+3.5) nm; IR (KBr) νmax 3390, 2949, 2835, 1732, 1653, 1452, 1031 cm−1; 1H (600 MHz) and 13C (150 MHz) NMR data, see Table 1; HRESIMS: m/z 422.19327 [M + Na]+ (calcd. for C23H29NO5Na+, 422.19379).
X-ray crystallographic data for zofielliamide A
A colorless cube. C25H35NO5, M = 429.54, a = 17.6760(4) Å, b = 17.6760(4) Å, c = 13.1360(4) Å, α = 90.00°, β = 90.00°, γ = 120.00°, V = 3554.36(19) Å3, T = 156(2) K, space group P65, Z = 6, μ(CuKα) = 1.54178 mm−1, 83 650 reflections measured, 5041 independent reflections (Rint = 0.049). The final R1 values were 0.0164 (I > 2σ(I)). The final R1 values were 0.0285 (all data). The final wR(F2) values were 0.0688 (all data). The goodness of fit on F2 was 1.077. Flack parameter = −0.03(5). CCDC: 2070473 (http://www.ccdc.cam.ac.uk).†
X-ray crystallographic data for zofielliamide C (3)
Light colorless BLOCK-like. C23H29NO4, M = 383.47, a = 6.8544(3) Å, b = 43.8920(19) Å, c = 6.7683(3) Å, α = 90.00°, β = 90.00°, γ = 90.00°, V = 2036.27(15) Å3, T = 150(2) K, space group P212121, Z = 4, μ(CuKα) = 1.54178 mm−1, 22 455 reflections measured, 4309 independent reflections (Rint = 0.0597). The final R1 values were 0.0503 (I > 2σ(I)). The final R1 values were 0.0581 (all data). The final wR(F2) values were 0.1593 (all data). The goodness of fit on F2 was 1.110. Flack parameter = 0.04. CCDC: 2070474 (http://www.ccdc.cam.ac.uk).†
Antibacterial assay
The tested bacterium Pseudomonas syringae was donated to Northwest Agricultural & Forest University. It was cultured in Mueller Hinton broth (MHB) (Guangdong Huankai Microbial Sci. &Tech. Co., Ltd.) at 37 °C overnight with shaking (200 rpm). A sample of each culture was then diluted 40-fold in fresh MHB broth and incubated with shaking (200 rpm) at 37 °C for 2.5 h. The resultant mid-log phase cultures were diluted to a concentration of 5 × 10⁵ CFU mL−1, then 50 mL was added to each well of the compound-containing plates. The minimum inhibition concentration (MIC) was determined by measuring bacterial growth after 24 h on performing 1 : 2 serial dilutions of each compound ranging from 1 to 128 μg mL−1. Since there is no effective antibiotic drug on Pseudomonas syringae, no positive control was included in this experiment.
Conflicts of interest
There are no conflicts to declare.
Supplementary Material
Acknowledgments
The work is financially supported by the Anhui Province College Excellent Young Talents Fund (gxyqZD2019035) and the Fundamental Research Funds for the Central Universities, South-Central University for Nationalities (CZP21001). The authors thank Analytical & Measuring Centre, South-Central University for Nationalities for the spectra measurements.
Electronic supplementary information (ESI) available. CCDC 2070473 and 2070474. For ESI and crystallographic data in CIF or other electronic format see DOI: 10.1039/d1ra02120f
Notes and references
- Newman D. J. Cragg G. M. J. Nat. Prod. 2016;79:629–661. doi: 10.1021/acs.jnatprod.5b01055. [DOI] [PubMed] [Google Scholar]
- Schueffler A. Anke T. Nat. Prod. Rep. 2014;31:1425–1448. doi: 10.1039/C4NP00060A. [DOI] [PubMed] [Google Scholar]
- Hawksworth D. L. and Lücking R., The Fungal Kingdom, 2017, pp. 79–95, 10.1128/9781555819583.ch4 [DOI] [Google Scholar]
- Yang H.-X. Ai H.-L. Feng T. Wang W.-X. Wu B. Zheng Y.-S. Sun H. He J. Li Z.-H. Liu J.-K. Org. Lett. 2018;20:8069–8072. doi: 10.1021/acs.orglett.8b03735. [DOI] [PubMed] [Google Scholar]
- Wang W. X. Lei X. X. Ai H. L. Bai X. Li J. He J. Li Z. H. Zheng Y. S. Feng T. Liu J. K. Org. Lett. 2019;21:1108–1111. doi: 10.1021/acs.orglett.9b00015. [DOI] [PubMed] [Google Scholar]
- He J. Yang M. S. Wang W. X. Li Z. H. Elkhateeb W. A. M. Wen T. C. Ai H. L. Feng T. RSC Adv. 2019;9:128–131. doi: 10.1039/C8RA09861A. [DOI] [PMC free article] [PubMed] [Google Scholar]
- Chen Y. Sun L.-T. Yang H.-X. Li Z.-H. Liu J.-K. Ai H.-L. Wang G.-K. Feng T. Fitoterapia. 2020;141:104483. doi: 10.1016/j.fitote.2020.104483. [DOI] [PubMed] [Google Scholar]
- Sun L.-T. Chen Y. Yang H.-X. Li Z.-H. Liu J.-K. Wang G.-K. Feng T. Phytochem. Lett. 2020;37:29–32. doi: 10.1016/j.phytol.2020.03.008. [DOI] [Google Scholar]
- Jang J.-H. Asami Y. Jang J.-P. Kim S.-O. Moon D. O. Shin K.-S. Hashizume D. Muroi M. Saito T. Oh H. Kim B. Y. Osada H. Ahn J. S. J. Am. Chem. Soc. 2011;133:6865–6867. doi: 10.1021/ja1110688. [DOI] [PubMed] [Google Scholar]
- Yamada T. Kikuchi T. Tanaka R. Tetrahedron Lett. 2015;56:1229–1232. doi: 10.1016/j.tetlet.2015.01.066. [DOI] [Google Scholar]
- Ueno M. Someno T. Sawa R. Iinuma H. Naganawa H. Ishizuka M. Takeuchi T. J. Antibiot. 1993;46:1020–1023. doi: 10.7164/antibiotics.46.1020. [DOI] [PubMed] [Google Scholar]
- Ueno M. Amemiya M. Yamazaki K. Iijima M. Osono M. Someno T. Iinuma H. Hamada M. Ishizuka M. Takeuchi T. J. Antibiot. 1993;46:1156–1162. doi: 10.7164/antibiotics.46.1156. [DOI] [PubMed] [Google Scholar]
- Ueno M. Yoshinaga I. Amemiya M. Someno T. Iinuma H. Ishizuaki M. Takeuchi T. J. Antibiot. 1993;46:1390–1396. doi: 10.7164/antibiotics.46.1390. [DOI] [PubMed] [Google Scholar]
- Ueno M. Amemiya M. Iijima M. Osono M. Masuda T. Kinoshita N. Ikeda T. Iinuma H. Hamada M. et a. J. Antibiot. 1993;46:719–727. doi: 10.7164/antibiotics.46.719. [DOI] [PubMed] [Google Scholar]
- Ueno M. Someno T. Sawa R. Iinuma H. Naganawa H. Ishizuka M. Takeuchi T. J. Antibiot. 1993;46:979–984. doi: 10.7164/antibiotics.46.979. [DOI] [PubMed] [Google Scholar]
- Yamada T. Tanaka A. Nehira T. Nishii T. Kikuchi T. Mar. Drugs. 2019;17:218. doi: 10.3390/md17040218. [DOI] [PMC free article] [PubMed] [Google Scholar]
- Horn W. S. Simmonds M. S. J. Schwartz R. E. Blaney W. M. Tetrahedron. 1995;51:3969–3978. doi: 10.1016/0040-4020(95)00139-Y. [DOI] [Google Scholar]
- Kato N. Nogawa T. Takita R. Kinugasa K. Kanai M. Uchiyama M. Osada H. Takahashi S. Angew. Chem., Int. Ed. 2018;57:9754–9758. doi: 10.1002/anie.201805050. [DOI] [PubMed] [Google Scholar]
Associated Data
This section collects any data citations, data availability statements, or supplementary materials included in this article.


