Abstract
An effective adsorbent of methylene blue was synthesized from coal fly ash (FA; waste material from a coal power plant) by a denaturing process with an alkaline solution at 90 °C. The denatured fly ash (D-FA) has a surface area and pore volume of 66.39 m2 g−1 and 15.33 cm3 g−1, respectively, whereas the values of the original FA are negligible, i.e., 3.55 m2 g−1 and 0.02 cm3 g−1. The removal of methylene blue (MB) in aqueous solution by D-FA was increased in the range of initial MB concentration (10–20 mg L−1); contact time (0–120 min); pH (2–8); D-FA dosage (1–4 g L−1). However, a larger value of those operational parameters would not improve the removal activity. Furthermore, the methylene blue adsorption on the denatured FA was fitted with the Langmuir model with R2 = 0.9991; the maximum adsorption capacity was determined as 28.65 mg g−1 from the model. Overall, the highest removal efficiency of MB using D-FA with the dosage of 4 g L−1 was 97.1% in 30 mg L−1 solution of methylene blue at pH = 7. The alkaline hydrothermal denaturation of waste FA is a promising approach to produce an adsorbent with beneficial environmental engineering applications.
High efficiency of methylene blue adsorbent from waste coal fly ash by treatment with alkaline thermal hydrolysis.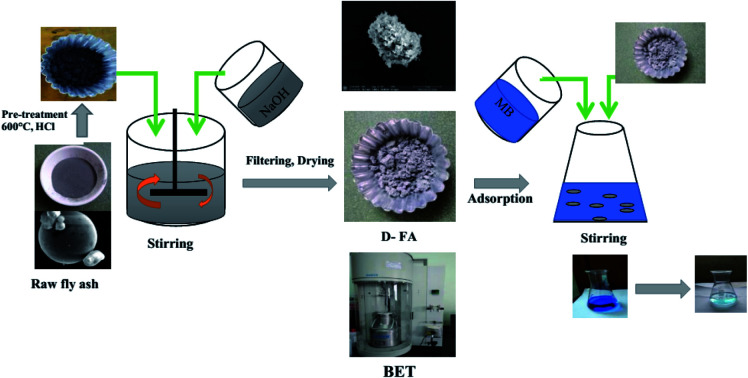
Introduction
Coal is one of the main fossil fuel sources used for energy production in the last few centuries. During coal consumption, a large amount of particulate matter such as fly ash (FA) and CO2 can be emitted into the atmosphere.1 For sustainable development, low CO2 or particulate matter emission into the atmosphere is required. Unfortunately, to date, coal power plants are still a critical source for power generation, especially in developing countries,2e.g., about 750 Mt of ash per year is discharged from coal-burning power plants in the world.3,4 Consequently, the prevention of hazardous material emission during coal usage and simultaneously developing renewable energy to replace fossil fuel use is a proposal.
FA contains inorganic matter, mainly aluminosilicate compounds in amorphous form, metallic oxides, calcium oxides, and other trace elements.5–7 Therefore, it has been recycled in several fields, such as enhancing the quality of concrete and ceramic, supporting catalyst process, and producing adsorbents.3,8–10 However, a tremendous amount of FA has been produced from power stations, suggesting larger amount of waste. At present, dumping at a landfill and storing in open areas are primary disposal methods for this waste. However, those methods can cause harmful effects on the environment and human health. Particularly, FA particles can be blown into the atmosphere by the wind, thereby cause air pollution and harm the human respiratory system, eyes, and skin.1 Moreover, the unsanitary landfill can change the soil salinity, contaminate groundwater, and release toxic compounds into the soil.3,11,12
Researchers have been focusing on developing new techniques for recycling coal FA waste to use in production and life toward sustainable development goals. One of them is coal FA that has been used to produce zeolite and geopolymers, further applied in environmental remediation such as wastewater treatment and air pollution treatment.13,14 Specifically, up to date, many reports have been carried out on using FA for the treatment of dye and textile wastewater,14–17 heavy metal,18–20 toxic gases,21 and other organic matters.22 However, original FA presents a low adsorption capacity; consequently, the original FA must be modified to improved adsorption ability. To obtain this purpose, FA has been modified by physical processes such as remove unburn carbon23 and gravity separation to collect different fragments of the FA,24 chemical processes,25,26 combined treatments by alkaline fusion with hydrothermal treatment,27 and alkaline ultrasonification.28 Among the chemical methods, the FA can be treated based on acidic, basic, metallic, and non-metallic addition by using numerous compounds such as NaOH, Na2SiO3, HCl, NH4HCO3, EDTA, Al2O3, Fe3O4.25,26,29,30 Meanwhile, other approaches are based on the assistance of hydrothermal treatment, fusion, microwave, ultrasonic, and a combined method, which have been widely applied for the modification of fly ash.25,26,29,30
Dyed products are very common in the modern fife. Dyes are essential for many industrial fields such as textile, paper, plastic, and leather industries.31 It was reported that the annual dye demands in the world were 7 × 10⁵ tonnes, in which 10 × 103 dyes were used for the textile industry. However, only approximately 70–85% of the utilized dyes could convert to products, and the left amount followed the wastewater stream of the factories.32,33 Many evidences described the issues related to dyes exposure, such as cancer, eye injury, skin damage, and other organs destruction.34,35 In addition, the discharge of uncompleted treatment of textile wastewater to the environment could negatively affect the water quality and aquatic organisms.32 The treatment of textile effluent to achieve the required standard is obligatory in every country. The common technologies for removal dyes include advanced oxidations,36,37 catalyses,38,39 adsorptions,31,40,41 and membrane filtration.42 Among them, the finding of low-cost materials conjugated with a high removal efficiency for the treatment of dyes has been attractive by experts in the catalyst and adsorption processes. Successful removal of malachite green dye by Z-scheme heterojunction photocatalysts Ag3PO4@MWCNTs@Cr:SrTiO3 was achieved, i.e., the efficiency of 100% obtained at a dosage catalyst of 100 mg g−1, contact time of 6 min at natural solar radiation and 10 min at visible light irradiation.38 Wu et al.39 developed LaFeO3 perovskite and its combination with other supported chemicals such as Al2O3, CeO2, SiO2, and TiO2 to be catalysts and applied in removing of Acid Orange 7 dye. The result indicated that LaFeO3/Al2O3 showed the highest efficiency as 86.2%. In another research, the removal of acid green 25 by using adsorbent modified from oyster shells, the experiment was carried out at 40 °C and achieved the maximum adsorption capacity as 34.1 mg g−1 with the experimental conditions were pH = 11.0, adsorbent dose = 2.0 g L−1, dye concentration = 70 mg L−1.40
Methylene blue (MB, C16H18ClN3S) is a cationic dye that has been widely used in the dyeing of such products as wood, cotton, wool, silk, and other fields, including construction, art, and painting.31,34,43 This compound is toxic and long existence in the environment. It has been confirmed that MB poisoning symptoms include vomiting, hypertension, anemia, mental and skin damage.32,33 Therefore, MB has been usually chosen by scientists to be the target pollutant in developing new technologies for the treatment of colorants. Among the typical technologies for the treatment of MB, adsorption has been considered as the most feasible process because of such advantages as high efficiency, low cost, and simple operation.41 Till now, many feasible adsorbents have been suggested to remove MB in aqueous solution, including pozzolana,34 activated charcoal,33,44,45 silica composite,41 and fly ash.29,32 In recent years, there have been several researchers applied FA or its modification in the removal of MB. Alouani and colleagues modified the FA by alkali silicate solution and produced the geopolymer with a maximum adsorption capacity of 37.08 mg g−1 in MB removal.29 The change of adsorption capacity from 23.70 to 50.51 mg g−1 was obtained with the FA treated with NaOH solution.32
This work aimed to synthesize adsorbent material for MB removal from coal FA, waste from a power plant located in the south of Vietnam. The denaturation of the FA was performed by alkaline thermal hydrolysis at 90 °C within 3 h. To determine the properties of FA adsorbents, the morphology, structure, and chemical composition were examined by several techniques, given in the method section. The result indicated that a poor MB adsorption on raw FA was increased significantly after the treatment, owing to the increased volume pore and mesopore structure of the treated FA. Furthermore, the dependence of MB adsorption of the FA on conditioned parameters was also examined, namely an initial MB concentration, contact time, and pH. As a result, the high-performance MB adsorption by the treated FA makes it a promising adsorbent material for removing MB in wastewater.
Materials and methods
Materials and chemicals
In this work, the FA was provided by a power plant (Duyen Hai power plant) located in Tra Vinh province, Vietnam. The FA was collected from different points of the fly ash heap and homogenized before seizing to 100 mesh and using for the experiment. Other chemicals with analytical grades were used for the experiments, including sodium hydroxide (NaOH), hydrochloric acid (36.5%), methylene blue (Merck, Germany). Meanwhile, distilled water was produced by Aquatron water still - A8000 (Stuart, England) in the laboratory.
Experimental procedures
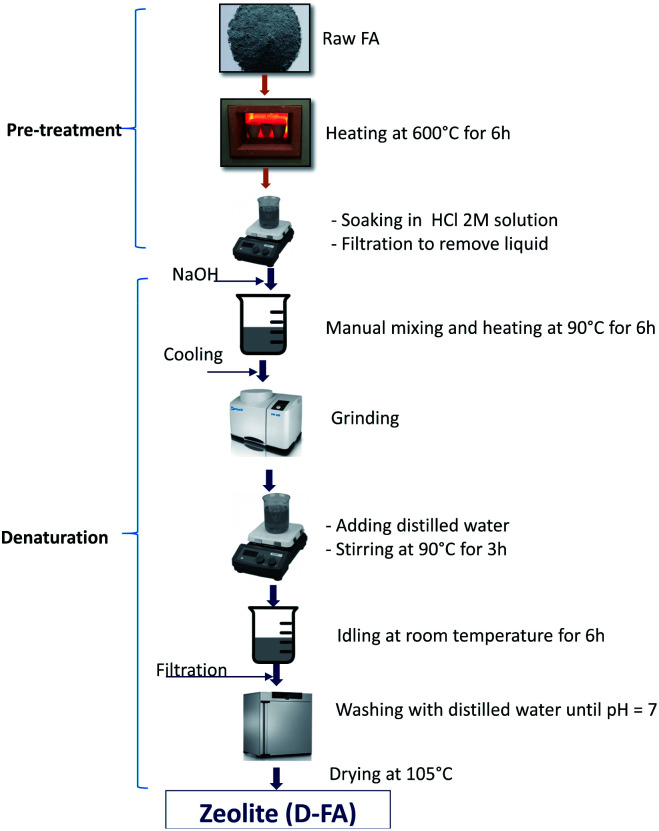
The pre-treatment and denaturation of the FA are shown in Fig. 1. Specifically, before being denatured, the raw FA was pre-treated by heating at 600 °C for 6 h to remove any possible impurities. Consequently, the sample was further soaked in 2 M HCl solution to remove contaminated metal elements or their metal oxides on the surface to increase surface activity. The denaturation process of the FA consisted of several stages. At First, the pre-treated FA was mixed with the NaOH solid form with a ratio of 1.5 : 1 (by weight). Secondly, the mixture was manually mixed for homogenizing and heated at 90 °C for 6 h and then cooled to ambient temperature.26,29,32 Thirdly, the samples were grounded, then mixed with distilled water with the ratio of 10 : 1 (ml g−1) and stirred at 200 rpm for 3 h at 90 °C. The slurry was kept idling at room temperature for 6 h and then filtered to get the remained solid. Finally, the solid was washed with distilled water until it reached the pH = 7 and dehydrated at 105 °C until the stable mass. The obtained solid sample is output zeolite (denatured fly ash, D-FA).26 The zeolite samples were further used to analyse their characteristics and adsorption properties.
Fig. 1. Procedure for the pre-treatment and denaturation of the fly ash.
Material characterization
The fly ashes were analyzed with XRD (X-ray powder diffraction spectrometry), SEM (Scanning electron microscopy), BET (Brunauer–Emmett–Teller), and FTIR (Fourier Transform Infrared Spectroscopy) to determine their characteristics and properties. XRF (X-ray fluorescence spectroscopy, Thermo Scientific Niton Co., US) was used for determining the chemical composition of FA and D-FA. The XRD patterns were recorded by an anode filtered Cu-Ka radiation; specifically, the samples were scanned under conditions of radiation wavelength of 1.5406 Å, accelerating voltage of 30 kV, 2θ range from 5° to 100°, and a time constant of 66 s. The specific surface area of samples was determined using a BET machine (SURFER, Thermo Fisher Scientific Co., US). The BET measuring procedure included the following steps: (1) the samples were degassed at 250 °C for 12 h; (2) the N2 gas was injected for adsorption and isotherms of samples was determined by NPLT (Next Point Logarithm Triangulation) method; (3) calculation of the surface and export of the result. The FTIR analysis was carried out using Nicolet IS5 in which the samples were prepared with KBr on a mass ratio of 2/8; the measurements were performed at room temperature using 264 scans in a wavenumber range between 4000 and 500 cm−1. The SEM analysis was processed using Quanta 250 at 10 kV. Before the imaging, samples were fabricated on Carbon stubs and coated with a thin film of Pt–Au under 5 mA sputtering to make them conductive (Thermo Fisher Scientific Co., US).
Practical blue dye adsorption by the fly ashes
The capability of fly ash-based adsorbents in removing dye was investigated via a batch test in 250 ml Erlenmeyer flasks. Briefly, the 50 ml of methyl blue dye solution with a specific concentration was injected into a flask. Consequently, a desired amount of the adsorbents was added to the dye solution, and the mixture was shaken gently while adjusting the pH to the designed value. The mixture was stirred at 120 rpm at ambient temperature during the test. During this process, the operational factors were also inspected, such as contact time, initial adsorbate concentration, adsorbent dosage, and pH. Here, it should be noted that the counting of contact time started after the complete mixing of adsorbent into MB solution (2–3 min). As a result, the samples were extracted and centrifuged to obtain the adsorbents. The MB concentration was determined by UV/VIS spectrophotometer at a wavelength of 664 nm using the calibration curve method (UV-VIS, Evolution 350, Thermo Scientific Niton Co., US).
Results and discussion
A. Effects of denaturation process on the physical/chemical properties of the fly ash
Several material analyses, i.e., XRF, XRD, SEM, and FTIR, examined the effects of the denatured process on the fly ash. The comparison between the FA and D-FA demonstrated the changes in physical properties, chemicals component, and fly ash structures during the denatured process.
X-ray fluorescence spectroscopy (XRF)
According to the XRF analysis, the chemical composition of FA and D-FA is given in Table 1. It presented that before and after the denatured process of fly ash, they mainly contained SiO2 and Al2O3 along with plenty of components, including Fe2O3, CaO, TiO2, and some other trace compounds. Based on the fly ash classification following ASTM standards, both fly ashes belong to class F since the total percentage of SiO2, Al2O3, and Fe2O3 was 91.41% (FA) and 79.69% (D-FA), both over 70%.46 However, after the denaturation process, the total amount of these compounds in D-FA decreased by 11.7%, and their order still remained SiO2 > Al2O3 > Fe2O3. The ratio of SiO2/Al2O3 was slightly increased from 2.25 to 2.33 after the modification. However, the percentage of Fe2O3 was decreased 1.83 times. Interestingly, the Na2O was present with a trace level in FA but became a considerable amount of 15.38% in D-FA. This result indicated that the composition of FA was changed under the alkaline hydrothermal treatment, which was also observed in the previous study.29 Alouani and colleagues obtained a significant increase in SiO2/Al2O3 ratio after modifying FA by Na2SiO3 and NaOH reagent.29 The decreased of iron element due to the acidic pre-treatment was revealed.47
The composition of original and denatured fly ash.
| Composition | FA (%) | D-FA (%) |
|---|---|---|
| SiO2 | 57.65 | 52.63 |
| Al2O3 | 25.56 | 22.58 |
| Fe2O3 | 8.20 | 4.48 |
| CaO | 3.29 | 1.98 |
| TiO2 | 1.92 | 1.16 |
| Na2O | — | 15.38 |
| Other (SO3, K2O, …) | 3.38 | 1.79 |
X-ray powder diffraction spectrometry (XRD)
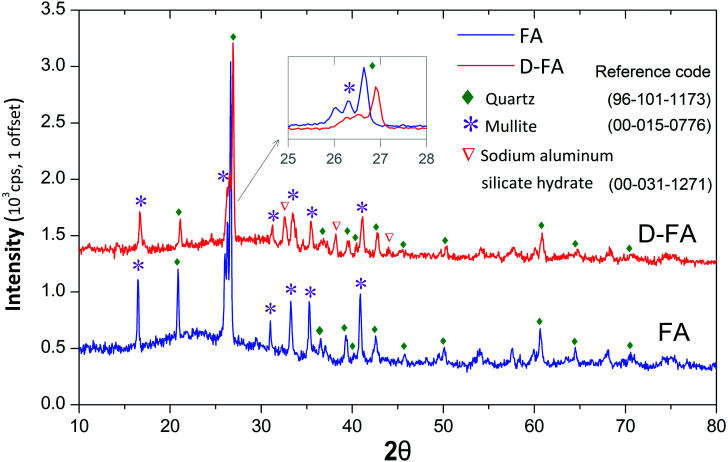
Fig. 2 shows the XRD patterns of FA and D-FA. It is observed that raw fly ash displayed many strong characteristic peaks of quartz (Q-SiO2, reference code: 96-101-1173) and mullite (M-3Al2O3·2SiO2, reference code: 00-015-0776). This result demonstrated that those compounds were mainly in the crystalline form. After the denaturation, the peak intensity of Q and M lowered, further confirming that the original fly ash structure was changed, sodium aluminum silicate hydrate with a reference code of 00-031-1271. This phenomenon can be explained by operations under the strong alkaline conjugated with high-temperature conditions. The sodium hydroxide solution breaks the bonds in the crystal lattice causing the bonds to be no longer ordered as in the original crystal structure. The occurrence of chemical reactions led to the change of FA amorphous structure and produced Na2O component in D-FA. Previous studies elucidated zeolite synthesis mechanisms using FA in alkaline solution under high temperature following several steps.19,26,48 Firstly, Si and Al were released from FA. Secondly, the chemical reaction between those elements occurred at the solid–liquid interface to produce the intermediate form of amorphous aluminosilicate. Finally, the intermediate product was crystallized to be zeolite.
Fig. 2. A comparison between XRD pattern of the fly ash (FA) and denatured fly ash (D-FA) samples.
Scanning electron microscopy (SEM) results
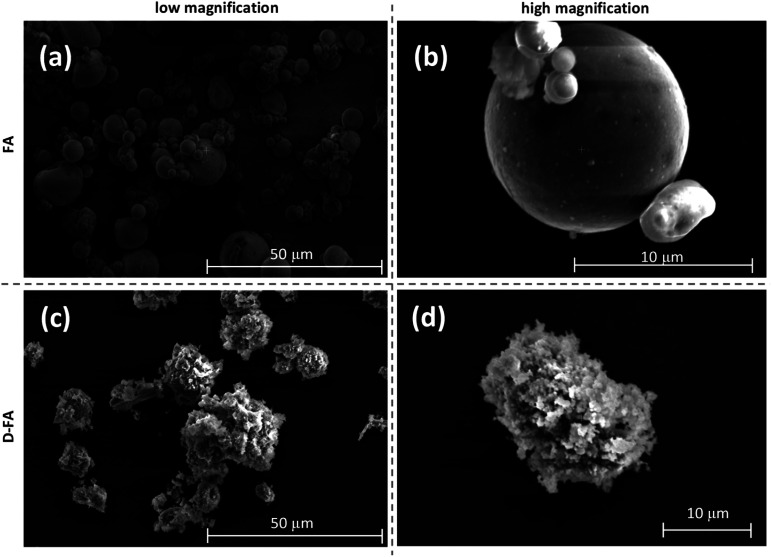
SEM is a potential method for determining the external morphology and placement of materials.2 In the present study, the morphology of FA and D-FA is illustrated in Fig. 3. It shows that the initial fly ash shape consisted of spherical particles of various sizes (Fig. 3(a)). Additionally, FA had remaining impurities, mainly unburned coal. At higher magnification (Fig. 3(b)), it is observed that the spherical particles of FA are smooth surfaces. Perhaps, fly ash existed mainly in amorphous form, leading to the limited presence of pores. This characteristic was the cause of the low surface area in the original samples. Fig. 3(c and d) shows the fly ash product after being denatured with NaOH solution at different degrees of magnification. It is clearly recognized that the shape of the original fly ash was significantly changed. It was no longer specific spheres like the original fly ash. Instead, the outer shell was lost and appeared with numerous scales and pores. The surface seemed to be deformed and created large and small uneven gaps instead of a smooth appearance. This means that the alkaline solution coupled with the hydrothermal condition impacted the surface, penetrated internal components, consequently reacted with SiO2 and Al2O3 to form silicate salts, and broke the bonds between silicates and aluminum in the quartz crystal structure (SiO2) and mullite (3Al2O3·2SiO2). Sarbak and Kramer-Wachowiak explicated in their research that under the influence of sodium hydroxide treatment, fly ash underwent deformation leading to the presence of abundant plates and tiny fibers.25
Fig. 3. SEM images of fly ash (a, b) and denatured fly ash (c, d) samples (low magnification: a and c; high magnification: b and d).
Fourier Transform Infrared Spectroscopy (FTIR) Analysis
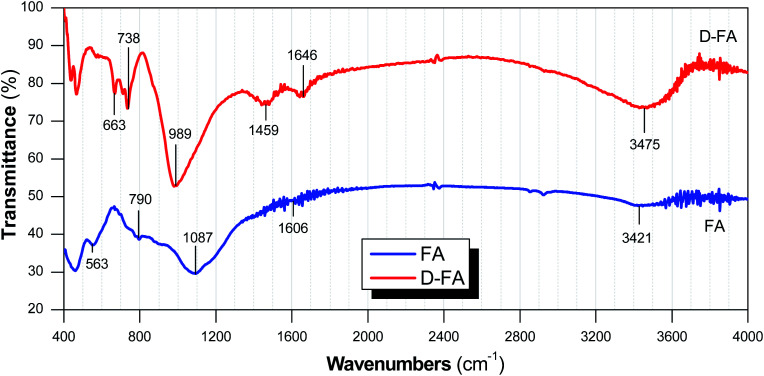
FTIR is an analytical technique to define functional groups on the surface; consequently, the characteristics and adsorption potential of the adsorbent can be evaluated based on the functional groups at the surface. Furthermore, the vibrational bands are useful for determining functional groups and chemical bonds of material.49 FTIR spectra of FA and D-FA samples are presented in Fig. 4. It clearly shows that the common peaks of FA and D-FA are 738–790, 989–1087, 1606–1646, and 3421–3475 cm−1. The wavenumber range of around 3400–3500 cm−1 can be generated by O–H stretching vibrations, while the ∼1600 cm−1 band belongs to (H–O–H) bending vibrations. In addition, the bands at 798–869 and 447–465 cm−1 were characteristic for Si–O–Si linkage and Si–O–Al bonds, respectively.19,29 Interestingly, the intensity of those peaks was different in FA and D-FA samples, indicating the change of FA after the denaturation. Specifically, some vibrational bands were only detected in the D-FA sample, i.e., peaks at 663 and 1459 cm−1. The pick belonged to the range of 650–720 cm−1 that was attributed to Al–O bands stretching vibrations.50,51 In the case of 1459 cm−1 peak, it can be denoted to O–C–O bonds. The appearance of O–C–O bonding in alkaline denatured fly ash samples implies the existence of sodium bicarbonate on the surface of the zeolite.29,51 Another study suggested that the vibration peak in the wavenumber range of 400–1600 cm−1 indicated the presence of Si–O–T (Si or Al) bonds.6
Fig. 4. The FTIR spectra of fly ash (FA) and denatured fly ash (D-FA) samples.
B. Enhancing adsorption performance of fly ash by denaturation process
Effects of the denatured process on the adsorption performance of the fly ash were examined through BET analysis and methylene blue adsorption test. The results are discussed below.
Brunauer–Emmett–Teller (BET) analysis
The Brunauer–Emmett–Teller works on the principle of noting the changes in pressure between points during the nitrogen adsorption and desorption in a liquid nitrogen medium at −196 °C. When the equilibrium state was reached, the data was analyzed and calculated for the surface area that defined the characteristics of materials.52,53
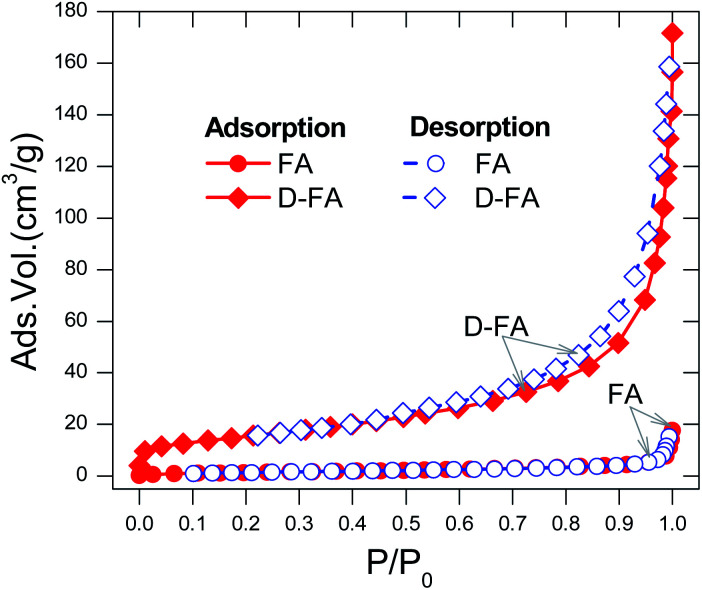
The N2 adsorption and desorption isotherms of the raw fly ash (FA) and denatured fly ash (D-FA) are described in Fig. 5. The curves of FA ash illustrated those processes were concave to the P/Po axis, which indicated the enhancement of the interactions in narrow micropores. In addition, the isotherms of adsorption and desorption of FA almost overlapped, suggesting the N2 adsorption on the raw fly ash belonged to Type I adsorption. This phenomenon can be explained by adsorption on the microporous materials, which were usually followed by surface adsorption.52,54 From the adsorption and desorption behavior, it can be confirmed that the raw FA had a smooth surface with a small area; this result agrees with the surface image of the fly ash (Fig. 3a and b). The intensity of adsorption/desorption isotherms of D-FA was higher than that of FA at the same P/Po. Suggesting the D-FA had a larger surface area and pore volume than FA, resulting in more N2 gas accumulation. Moreover, from the value of P/Po > 0.8, the curved isotherms were clearly distinguished between adsorption and desorption. This result indicated the characteristic of the adsorption–desorption process on mesopores of the material, which happened in two stages. In the early stage, the adsorption and desorption lines almost overlapped, demonstrating the monolayer and multilayer adsorption process occurred in an adsorbent. In the later stage, those lines were distinguished, corresponding to the blocking of mesopores in the adsorbent by the capillary condensation process.55–57 The difference between FA and D-FA isotherms demonstrated that the hydrothermal denaturation using NaOH solution changed the porous properties of the raw fly ash and produced more mesopores on the surface of the fly ash.
Fig. 5. N2 adsorption and desorption isotherms of fly ash (FA) and denatured fly ash (D-FA).
After analyzing nitrogen gas adsorption–desorption isotherms, the surface area and the pore volume of FA and D-FA were determined using the BET Surfer Thermo Scientific machine. This presents the raw fly ash had a small surface area (3.55 m2 g−1) and ignorable pore volume (0.02 cm3 g−1). However, the surface area and pore volume were improved significantly after the modification by NaOH solution. Particularly, D-FA possessed a surface area and pore volume of 66.39 m2 g−1 and 15.33 cm3 g−1, respectively. The result disclosed that the denaturation process strongly impacted the original structure of raw fly ash and created many capillaries leading to the enhancement of the adsorbent property.
Comparison between before/after treatment of fly ash for methylene blue adsorption
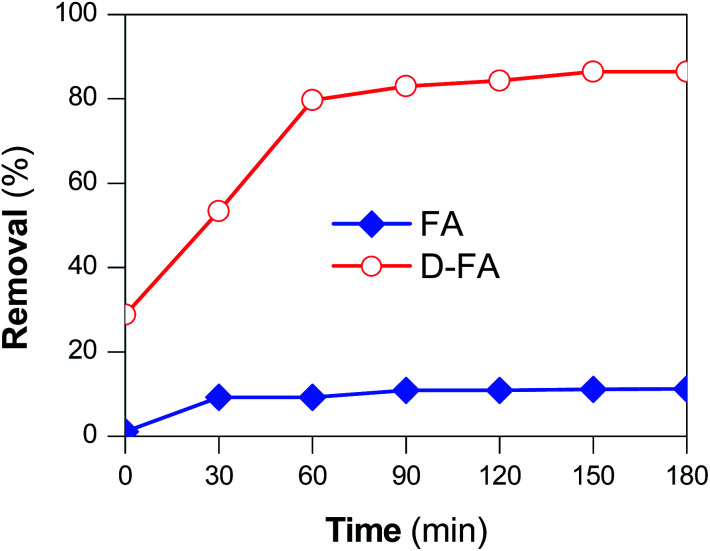
The difference in MB adsorption capacity between untreated and treated fly ash was investigated by adding 0.05 g adsorbent material into 50 ml MB (10 mg L−1; pH = 7) and recording the adsorption for 180 min; the result was shown in Fig. 6. The original FA barely adsorbed MB with an absorption efficiency of 11.2%. Meanwhile, the D-FA exhibited a higher efficiency. Particularly, D-FA possessed an adsorption efficiency of around 86.4%. This might be due to the difference in morphology. Specifically, the poor adsorption performance of the untreated FA resulted from smooth spheres with a small specific surface area of 3.55 m2 g−1 that conjugated a less porous structure. The large specific surface area and pore volume obtained with the treated FA, as mentioned above, led to the enhanced performance of MB adsorption. As shown in SEM results (Fig. 3), in comparison to FA, the D-FA surface was rougher, with more voids generated, leading to the presence of more adsorption sites. This finding agrees with the previous observations in other studies.58,59 To sum up, there is a correlative relationship between surface morphology and porous structure of the fly ashes with their adsorption performance.
Fig. 6. Adsorption efficiency of FA and D-FA to MB (initial MB concentration = 10 mg L−1; pH = 7).
C. Dependence of MB adsorption performance of D-FA on process parameters
The adsorption performance of D-FA was investigated under various variations of the process parameters such as contact time, initial concentration, adsorbent dosage, and pH. Experiments were carried out at room temperature (∼26 °C) with the expectation that the results obtained from the study could be facilitated the practical application of the adsorbent, i.e., no require energy consumption to heating waste water.
Effect of initial concentration coupled with contact time
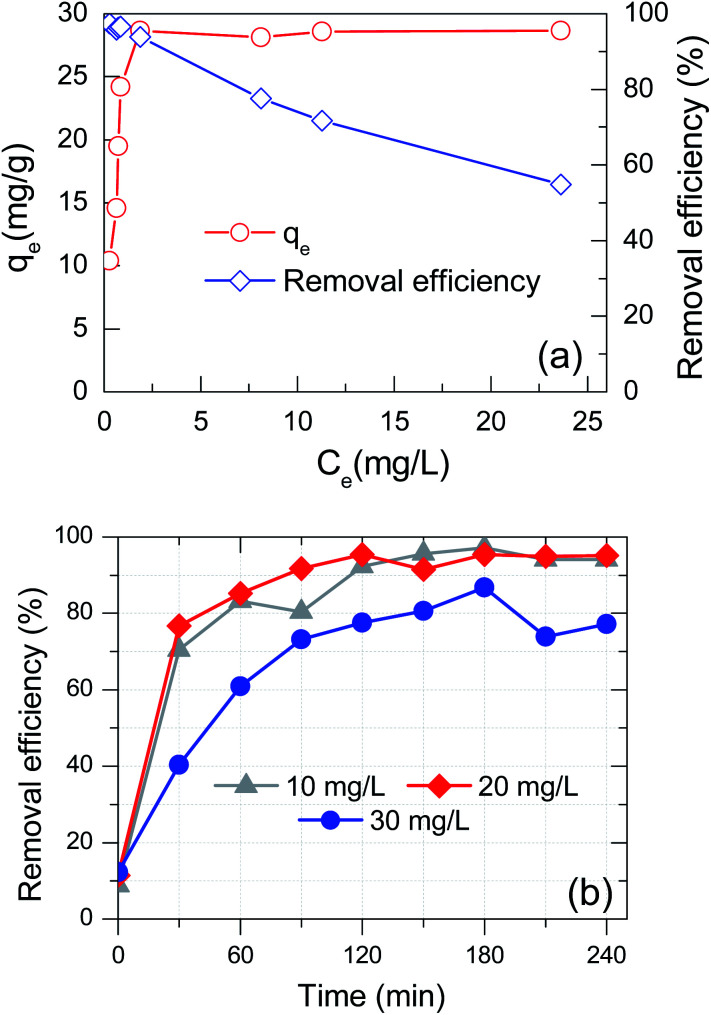
In exploring the effect of initial concentration on MB adsorption, the adsorbent dosage was maintained at 1 g D-FA in one litter solution. Based on the literature review, real textile wastewater had pH in the range of slight alkalinity as 7–8.5.60–62 Therefore, in this experiment, the pH of the solution was adjusted to 7, which is the safe value for the receiving environment and saving cost for the treatment. Such values of MB initial concentration of MB were investigated as 10, 15, 20, 25, 30, 35, 40, and 50 mg L−1. The relationship between adsorption capacity and removal efficiency with MB equilibrium concentration corresponding to each initial concentration is shown in Fig. 7(a). As expected, the amount of adsorption at equilibrium increased with the increase of the initial amount of the dye. Particularly, the adsorption capacity rose from 10.19 mg g−1 to 27.12 mg g−1, corresponding to the increase of concentration from 10 to 35 mg L−1, respectively. Nevertheless, beyond the dye concentration up to 50 mg L−1 did not significantly affect the equilibrium adsorption amount. The removal efficiency was over 96.62% in the range of C0 at 10–30 mg L−1, and then sharply dropped with the MB concentration increase from 35 to 50 mg L−1. It is straightforward, suggesting the reached-up boundary adsorption ability of MB on the D-FA. That means the constant adsorption sites would be in correlation with a certain maximum amount of dye adsorbed. Once the adsorption is saturated, augmenting the initial concentration of MB would diminish the adsorption efficiency.63 Consequently, the MB initial concentration of up to 30 mg L−1 was chosen to study the effect of contact time on MB removal.
Fig. 7. Effect of (a) initial concentration and (b) contact time under various initial concentration on MB adsorption of D-FA (pH = 7).
The MB adsorption by D-FA was performed with a contact time from 0 to 240 min with the sample interval around 30 min under the initial concentrations in the range of 10–30 mg L−1. While the D-FA dose and pH were kept the same value as the previous experiment. The MB removal efficiency of D-FA augmented with the increase of time, especially in the first 60 min for all 3 concentrations, as shown in Fig. 7(b). The maximum removal of MB attained at around 120 min for 10 and 20 mg L−1, while the adsorption reached maximum value after 180 min for 30 mg L−1. During the first 60 min, the MB adsorption was fast and almost complete in the case of 10 and 20 mg L−1 due to the abundance of adsorption sites, which facilitated the diffusion of the dyes into the D-FA.64 For 30 mg L−1, the removal efficiency was decreased; the adsorption slowed down from 60 to 180 min, which is attributed to hindering interaction between the available adsorption sites (inside pores) with the dye diffusion, i.e., due to high initial concentration is therefore rapid saturated adsorption of the surface cites and reducing open space for dye diffusion into inside the adsorbent. Indeed, the maximum removal efficiency was 97.1, 95.4, and 86.8%; however, the adsorption capacity was calculated at the equilibrium stage, and it was found to be 10.26, 20.12, and 26.03 mg g−1 corresponding to the initial MB concentration of 10, 20, and 30 mg L−1, respectively. These adsorption capacities by the D-FA are comparable to those in the previous reports.14,29,32
Effect of pH
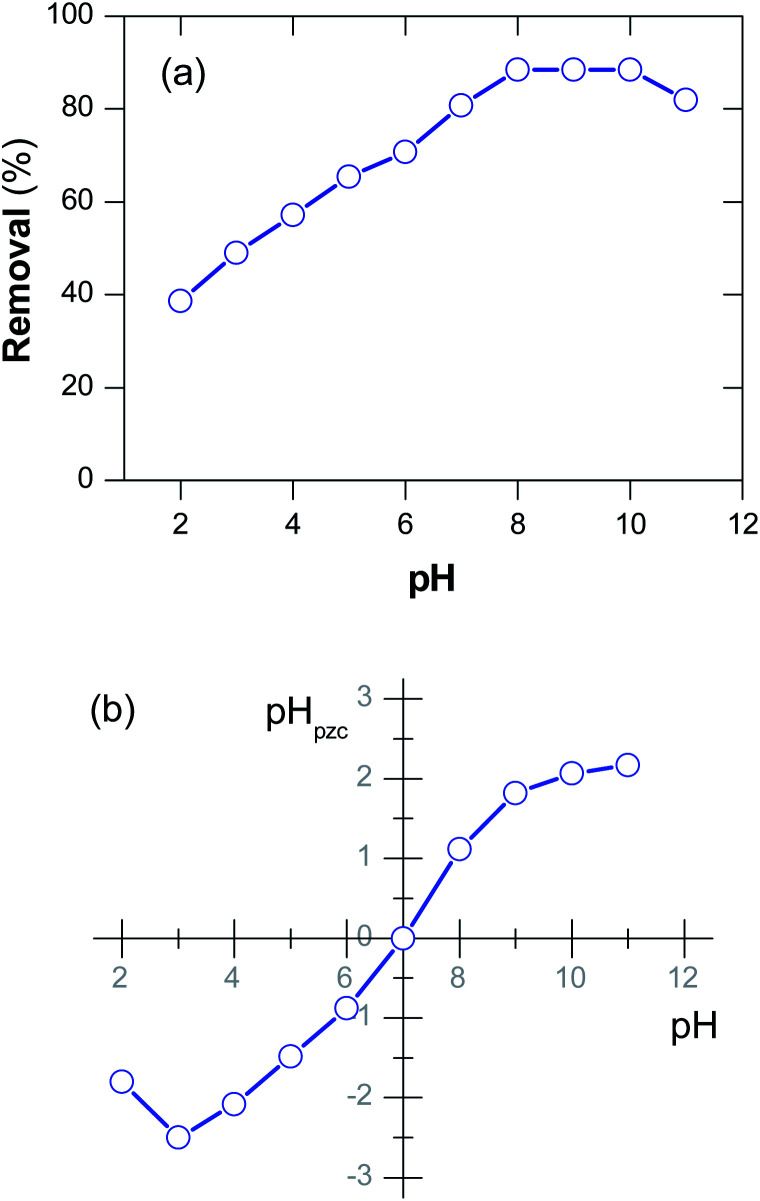
One of the crucial parameters that would affect the adsorption capability of an adsorbent is the pH of dye solution, especially towards charged adsorbate.65 In that aspect, the adsorption of a cationic dye, as Methylene blue, should be impacted by pH. Herein, the effect of pH on the MB adsorption using D-FA was investigated by carrying out the process at a pH range of 2–11 and the initial MB concentration of 30 mg L−1. The adsorption efficiency was significantly affected by pH value, as shown in Fig. 8(a). Specifically, the adsorption efficiency increased from 38.6% to around 88.4% when pH varied from 2 to 8; it was maintained at ∼88.4% in the pH range of 8–10. However, the dye removal efficiency reduced to 82.0% while further increasing the pH value to 11. Hence, it was considered pH of 8 as the suitable value for the adsorption of MB using the D-FA. This pH value is also similar to the actual textile wastewater; thus, it may be feasible to treat the textile effluent and safe for the reserving environment after treatment.
Fig. 8. (a) Effect of pH on MB adsorption efficiency and (b) pH at point of zero charge of D-FA (initial MB concentration = 30 g L−1).
To clarify these observations, pHpzc, the pH value of solution obtained after neutralization of particle surface (the total net charge is zero), was also determined. It is clear from Fig. 8(b) that the pHpzc of the D-FA was 7 for the case of MB solution. Previous reports revealed that at pH < pHpzc, the adsorbent surface might get positively charged.66,67 Therefore, the adsorption capability of cationic MB dye was limited at pH < 7. In contrast with pH > pHpzc, the surface became negatively charged, resulting in more electrostatic interactions between dye and adsorbent, thereby enhancing the adsorption amount.67 Unfortunately, at a too high pH value (pH ∼ 11), the adsorption efficiency would decrease due to increased ionic strength resulting from a high NaOH concentration.
Effect of adsorbent dosage
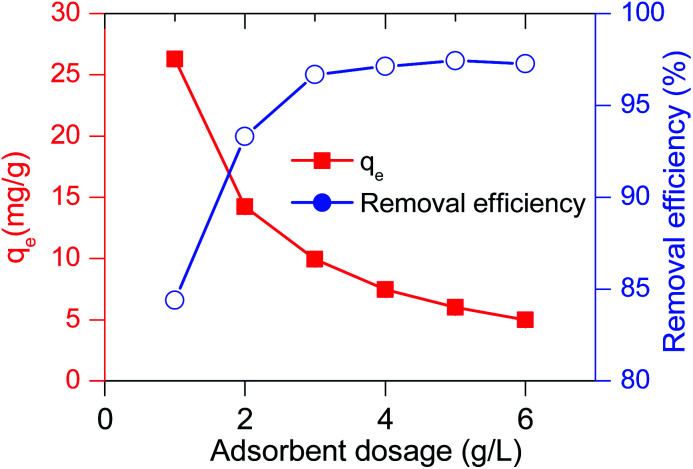
The adsorbent dosage is the parameter that determines not only the maximum amount of adsorbate adsorbed, but also the economics of the adsorption process. The effect of adsorbent dosage on the adsorption capacity was also examined in the range of 1–6 g adsorbent per one littler solution; the experiment was conducted at the MB initial concentration of 30 mg L−1 and pH of 7. General, the increasing adsorbent dosage leads to the increased available surface area, which results in higher removal efficiency.68 Consistently, as can be seen in Fig. 9, the MB removal efficiency increased from 85.3% to 97.1% when increasing the used amount of adsorbent from 1 to 4 g L−1. However, keeping increasing the adsorbent dosage further to 6 g L−1, it was observed that the efficiency almost remained constant. This is due to the availability of a huge amount of surface-active sites in comparison to limited quantity of adsorbate. This also means the adsorption capacity per adsorbent mass unit decreases. This finding is in good accordance with the previously reported results.69 In short, 4 g L−1 was the best adsorbent dose to be used to obtain a removal efficiency of 97.1%. It should be noted that our results were better than several published studies; for instance, Rao et al.63 found that their fly ash could adsorb up to 96% in the case of using an adsorbent dose of 12 g L−1. Therefore, the 4 g adsorbent in a litter of solution containing MB (C0 = 30 mg L−1) is the suggested dosage for this case study.
Fig. 9. Effect of adsorbent dosage on MB adsorption capacity and removal efficiency of D-FA (initial MB concentration = 30 g L−1).
D. Adsorption isotherms
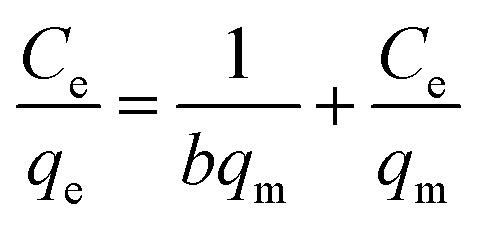
To apprehend MB adsorption's mechanism onto the D-FA surface, adsorption isotherms, namely Langmuir and Freundlich, were established in this study. According to Irving Langmuir, the Langmuir model is constructed with the assumptions including (i) the adsorption occurs at specified positions on the surface of the adsorbent; (ii) all adsorption sites on the adsorbent surface are equivalent; (iii) the adsorbate attachment is monolayer and (iv) there is no interaction between adjacent adsorbates. Meanwhile, Freundlich is appropriate for modelling multilayer adsorption on heterogeneous sites.70 The Langmuir (1) and Freundlich (2) models equation are indicated below:
 |
1 |
 |
2 |
where Ce and qe are the adsorbate concentration (mg L−1) and adsorption capacity (mg g−1) of at the equilibrium stage, respectively; qm, b, and KF are adsorption constants (L mg−1); n, the adsorbent intensity.
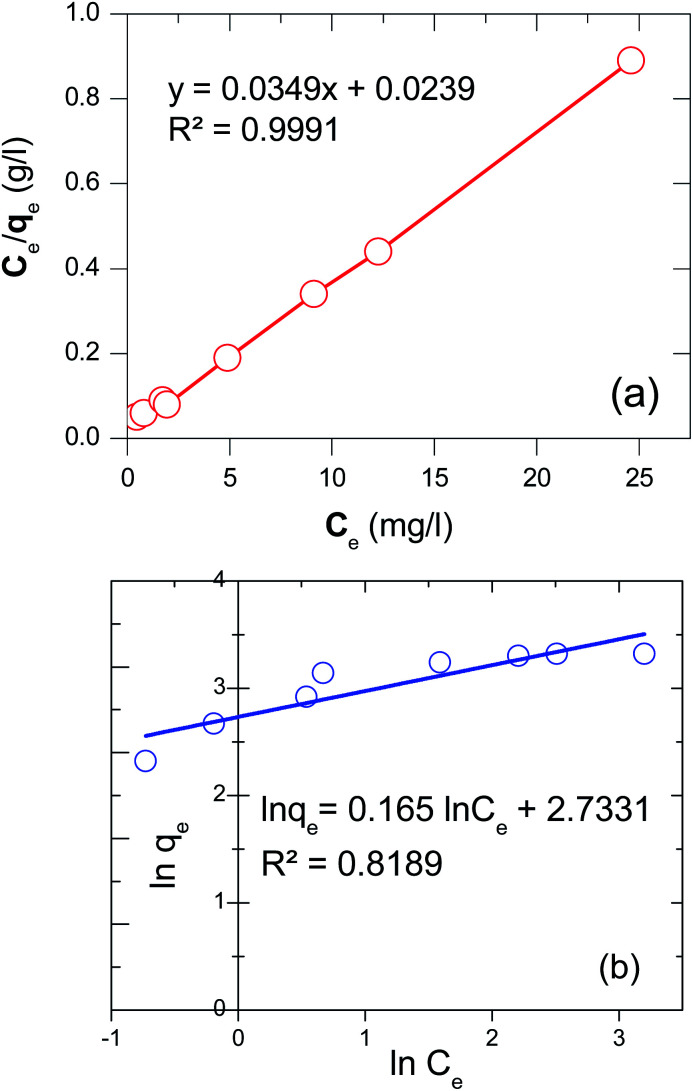
Based on the Langmuir equation, a linear relationship between Ce and q was established (data is not shown). The straight line of Ce/qeversus Ce was gained as y = 0.0349x + 0.0239 with a correlation coefficient of 0.9991 (Fig. 10(a)). As a result, the qm was determined as 28.65 mg g−1; the energy constant (b) was also obtained as 1.46 L mg−1 demonstrated the high adsorption energy; it means that the adsorption process happens quickly at low adsorbate concentrations.71 And this finding is similar to the output of the experiment about the effect of initial concentration on MB removal (Fig. 7(b)). Moreover, the adsorption trend (RL) that equals 1/(1 + bC0) was found to be 0.022. The value of 0 < RL < 1 suggesting the adsorption was favorable in the investigated concentration range.72 In contrast, the Freundlich model illustrated that the correlation coefficient was very low (R2 = 0.8189) (Fig. 10(b)). Therefore, it can be said that the adsorption experiment, in this case, was matched with Langmuir isotherm and the adsorption of MB on D-FA belonged to the monolayer type. The better competition of the Langmuir model Freundlich in the adsorption isotherms of several adsorbents was also confirmed in the previous studies about MB treatment.32,73
Fig. 10. Adsorption isotherms of MB onto D-FA: (a) Langmuir and (b) Freundlich.
E. Preliminary cost analysis
The processing cost is one of the majors considering applying a material or technology for wastewater treatment in the industry.74 Based on the flow chart of the fly ash denaturation process, the expenses for DFA production was including chemical purchase, energy consumption, manpower, and facility depreciation. The raw fly ash was provided by a thermal power plant without paying. As a result, the cost of DFA was calculated as about 3.1 USD per kg. This cost was almost equal to the local commercial activated carbon and much cheaper than the imported product in Vietnam. Therefore, it is possible to consider applying this technology to make zeolite-based FA on a large scale. In addition, the adsorbent production from waste ash fly ash is a targeted approach for sustainable development in Vietnam and around the world. Till now, there have been several studies reported the cost of different wastewater treatment technology.75,76 The economic analysis of different levels in wastewater treatment plants was carried out and demonstrated that the whole budget of a plant significantly relies on the treatment step; the equipment fee has predominated the investment of the preliminary treatment plant whereas, the construction consumed high cost for the tertiary one.77 It was implemented the cost analysis of wastewater treatment by advanced oxidation processes and revealed that ozone, O3/H2O2 (0.005 M), Fenton, was commendably used in the business.76,78 However, there has been limited publish about the economic analysis of producing zeolite from waste fly ash.
Conclusions
In this study, a green adsorbent was successfully fabricated by thermally denaturing coal fly ash with NaOH solution, with an estimated 3.1 USD per kg synthesis cost. The morphology and properties of the FAs were characterized by XRD, FT-IR, SEM, and BET methods. Treatment of fly ash via alkaline thermal hydrolysis led to a significant rise of surface area and pore volume, resulting in enhancing its adsorption capacity. Particularly, methylene blue removal efficiency using the original fly ash was only 11.23%, while the removal efficiency of denatured fly ash was 86.4%, improving 7.7 times. In this study, the optimization contact time for the methylene blue removal by the denatured fly ash at pH = 7 was 120 min for C0 = 10–20 mg L−1 and 180 min for C0 = 30 mg L−1; the 4 g adsorbent in a litter of solution containing MB (C0 = 30 mg L−1) is the suggested dosage for this case study. The dye's adsorption onto the denatured fly ash surface preferably followed the Langmuir model with correlation coefficient values (R2) equal to 0.9991, the maximum adsorption capacity of 28.65 mg g−1 was obtained from this model. The high methylene blue removal efficiency has proved our denatured fly ash to be a promising novel adsorbent for treating wastewater.
Author contributions
Nga Thi Dinh: investigation, methodology, writing – original draft, and supervision. Linh Ngoc Hoang Vo: investigation, writing – original draft. Ngoc Thi Thanh Tran: investigation. Tuan Dinh Phan: investigation, funding acquisition. Duc Ba Nguyen: visualization, writing – review & editing.
Conflicts of interest
There are no conflicts to declare.
Supplementary Material
Acknowledgments
The authors would like to acknowledge Ministry of Science and Technology for the financial support through the program of “Science and Technology for Sustainable Development in the Southwest Region of Vietnam”, under the research grant KHCN-TNB.ĐT/14-19/C24.
Notes and references
- Wang N. Sun X. Zhao Q. Yang Y. Wang P. J. Hazard. Mater. 2020;396:122725. doi: 10.1016/j.jhazmat.2020.122725. [DOI] [PubMed] [Google Scholar]
- Asl S. M. H. Javadian H. Khavarpour M. Belviso C. Taghavi M. Maghsudi M. J. Cleaner Prod. 2019;208:1131–1147. doi: 10.1016/j.jclepro.2018.10.186. [DOI] [Google Scholar]
- Xing Y. Guo F. Xu M. Gui X. Li H. Li G. Xia Y. Han H. Powder Technol. 2019;353:372–384. doi: 10.1016/j.powtec.2019.05.037. [DOI] [Google Scholar]
- Yao Z. Ji X. Sarker P. Tang J. Ge L. Xia M. Xi Y. Earth-Sci. Rev. 2015;141:105–121. doi: 10.1016/j.earscirev.2014.11.016. [DOI] [Google Scholar]
- Xu G. Shi X. Resour., Conserv. Recycl. 2018;136:95–109. doi: 10.1016/j.resconrec.2018.04.010. [DOI] [Google Scholar]
- Zhao X. Liu C. Wang L. Zuo L. Zhu Q. Ma W. Cem. Concr. Compos. 2019;98:125–136. doi: 10.1016/j.cemconcomp.2019.02.009. [DOI] [Google Scholar]
- Kang D. Yoo Y. Park J. J. Ind. Eng. Chem. 2021;94:472–481. doi: 10.1016/j.jiec.2020.11.019. [DOI] [Google Scholar]
- Shi Y. Jiang K. X. Zhang T. A. Guo J. H. Zhao A. C. J. Hazard. Mater. 2020;393:122371. doi: 10.1016/j.jhazmat.2020.122371. [DOI] [PubMed] [Google Scholar]
- Hosseini Asl S. M. Javadian H. Khavarpour M. Belviso C. Taghavi M. Maghsudi M. J. Cleaner Prod. 2019;208:1131–1147. doi: 10.1016/j.jclepro.2018.10.186. [DOI] [Google Scholar]
- Pan J. Nie T. Vaziri Hassas B. Rezaee M. Wen Z. Zhou C. Chemosphere. 2020;248:126112. doi: 10.1016/j.chemosphere.2020.126112. [DOI] [PubMed] [Google Scholar]
- Neupane G. Donahoe R. J. Fuel. 2013;104:758–770. doi: 10.1016/j.fuel.2012.06.013. [DOI] [Google Scholar]
- Wang Z. Zhu H. Wu X. Wei B. Zhou H. Xu S. Wang Z. Zhu H. Wu X. Wei B. Environ. Eng. Res. 2020;26:200256. doi: 10.4491/eer.2020.256. [DOI] [Google Scholar]
- Zhang S. Ravi S. Lee Y.-R. Ahn J.-W. Ahn W.-S. J. Ind. Eng. Chem. 2019;72:241–249. doi: 10.1016/j.jiec.2018.12.024. [DOI] [Google Scholar]
- Acisli O. Acar I. Khataee A. J. Ind. Eng. Chem. 2020;83:53–63. doi: 10.1016/j.jiec.2019.11.012. [DOI] [Google Scholar]
- Zhou C. Gao Q. Luo W. Zhou Q. Wang H. Yan C. Duan P. J. Taiwan Inst. Chem. Eng. 2015;52:147–157. doi: 10.1016/j.jtice.2015.02.014. [DOI] [Google Scholar]
- Pengthamkeerati P. Satapanajaru T. Chatsatapattayakul N. Chairattanamanokorn P. Sananwai N. Desalination. 2010;261:34–40. doi: 10.1016/j.desal.2010.05.050. [DOI] [Google Scholar]
- Chakraborty S. Mukherjee A. Das S. Raju Maddela N. Iram S. Das P. Environ. Eng. Res. 2021;26:190372. [Google Scholar]
- Fu B. Liu G. Mian M. M. Sun M. Wu D. Fuel. 2019;251:593–602. doi: 10.1016/j.fuel.2019.04.055. [DOI] [Google Scholar]
- Kobayashi Y. Ogata F. Nakamura T. Kawasaki N. J. Environ. Chem. Eng. 2020;8:103687. doi: 10.1016/j.jece.2020.103687. [DOI] [Google Scholar]
- Soni R. Shukla D. P. Chemosphere. 2019;219:504–509. doi: 10.1016/j.chemosphere.2018.11.203. [DOI] [PubMed] [Google Scholar]
- Ji L. Yu H. Zhang R. French D. Grigore M. Yu B. Wang X. Yu J. Zhao S. Fuel Process. Technol. 2019;188:79–88. doi: 10.1016/j.fuproc.2019.01.015. [DOI] [Google Scholar]
- Singh A. Sonal S. Kumar R. Mishra B. K. Environ. Eng. Res. 2020;25:205–211. doi: 10.4491/eer.2018.412. [DOI] [Google Scholar]
- Soong Y. Schoffstall M. R. Gray M. L. Knoer J. P. Champagne K. J. Jones R. J. Fauth D. J. Sep. Purif. Technol. 2002;26:177–184. doi: 10.1016/S1383-5866(01)00162-9. [DOI] [Google Scholar]
- Maroto-Valer M. M. Taulbee D. N. Hower J. C. Energy Fuels. 1999;13:947–953. doi: 10.1021/ef990029s. [DOI] [Google Scholar]
- Sarbak Z. Kramer-Wachowiak M. Powder Technol. 2002;123:53–58. doi: 10.1016/S0032-5910(01)00431-4. [DOI] [Google Scholar]
- Ojha K. Pradhan N. C. Samanta A. N. Bull. Mater. Sci. 2004;27:555–564. doi: 10.1007/BF02707285. [DOI] [Google Scholar]
- Dindi A. Quang D. V. Nashef E. Zahra M. R. M. A. Energy Procedia. 2017;114:2243–2251. doi: 10.1016/j.egypro.2017.03.1361. [DOI] [Google Scholar]
- Al-Harahsheh M. S. Al Zboon K. Al-Makhadmeh L. Hararah M. Mahasneh M. J. Environ. Chem. Eng. 2015;3:1669–1677. doi: 10.1016/j.jece.2015.06.005. [DOI] [Google Scholar]
- Alouani M. Alehyen S. Achouri M. Taibi M. J. Mater. Environ. Sci. 2018;9:32–46. [Google Scholar]
- Asmaly H. A. Ihsanullah Abussaud B. Saleh T. A. Laoui T. Gupta V. K. Atieh M. A. Desalin. Water Treat. 2016;57:6801–6808. doi: 10.1080/19443994.2015.1010238. [DOI] [Google Scholar]
- Temel F. Turkyilmaz M. Kucukcongar S. Eur. Polym. J. 2020;125:109540. doi: 10.1016/j.eurpolymj.2020.109540. [DOI] [Google Scholar]
- Sun Z. Li C. Wu D. J. Chem. Technol. Biotechnol. 2010;85:845–850. doi: 10.1002/jctb.2377. [DOI] [Google Scholar]
- Geed S. R. Samal K. Tagade A. J. Environ. Chem. Eng. 2019;7:103439. doi: 10.1016/j.jece.2019.103439. [DOI] [Google Scholar]
- Titchou F. E. Akbour R. A. Assabbane A. Hamdani M. Groundwater Sustainable Dev. 2020;11:100405. doi: 10.1016/j.gsd.2020.100405. [DOI] [Google Scholar]
- Sakr F. Alahiane S. Sennaoui A. Dinne M. Bakas I. Assabbane A. Mater. Today: Proc. 2020;22:93–96. [Google Scholar]
- Kothai A. Sathishkumar C. Muthupriya R. sankar K. S. Dharchana R. Mater. Today: Proc. 2021;45:1411–1416. [Google Scholar]
- Kiani R. Mirzaei F. Ghanbari F. Feizi R. Mehdipour F. J. Water Process Eng. 2020;38:101623. doi: 10.1016/j.jwpe.2020.101623. [DOI] [Google Scholar]
- Lin Y. Wu S. Li X. Wu X. Yang C. Zeng G. Peng Y. Zhou Q. Lu L. Appl. Catal., B. 2018;227:557–570. doi: 10.1016/j.apcatb.2018.01.054. [DOI] [Google Scholar]
- Wu S. Lin Y. Yang C. Du C. Teng Q. Ma Y. Zhang D. Nie L. Zhong Y. Chemosphere. 2019;237:124478. doi: 10.1016/j.chemosphere.2019.124478. [DOI] [PubMed] [Google Scholar]
- Inthapanya X. Wu S. Han Z. Zeng G. Wu M. Yang C. Environ. Sci. Pollut. Res. Int. 2019;26:5944–5954. doi: 10.1007/s11356-018-3980-0. [DOI] [PubMed] [Google Scholar]
- Ye J. Nyobe D. Tang B. Bin L. Li P. Huang S. Fu F. Cai Y. Guan G. Hao X. J. Mol. Liq. 2020:303. [Google Scholar]
- Liu C. Mao H. Zheng J. Zhang S. J. Membr. Sci. 2017;530:1–10. doi: 10.1016/j.memsci.2017.02.005. [DOI] [Google Scholar]
- Wang K. S. Wei M. C. Peng T. H. Li H. C. Chao S. J. Hsu T. F. Lee H. S. Chang S. H. J. Environ. Manage. 2010;91:1778–1784. doi: 10.1016/j.jenvman.2010.03.022. [DOI] [PubMed] [Google Scholar]
- Nayak S. S. Mirgane N. A. Shivankar V. S. Pathade K. B. Wadhawa G. C. Mater. Today: Proc. 2021;37:2302–2305. [Google Scholar]
- Wang K. Peng N. Sun J. Lu G. Chen M. Deng F. Dou R. Nie L. Zhong Y. Sci. Total Environ. 2020;729:139055. doi: 10.1016/j.scitotenv.2020.139055. [DOI] [PubMed] [Google Scholar]
- Jayaranjan M. L. D. Van Hullebusch E. D. Annachhatre A. P. Rev. Environ. Sci. Biotechnol. 2014;13:467–486. doi: 10.1007/s11157-014-9336-4. [DOI] [Google Scholar]
- Vichaphund S. Wimuktiwan P. Sricharoenchaikul V. Atong D. J. Anal. Appl. Pyrolysis. 2019;139:156–166. doi: 10.1016/j.jaap.2019.01.020. [DOI] [Google Scholar]
- Murayama N. Yamamoto H. Shibata J. Int. J. Miner. Process. 2002;64:1–17. doi: 10.1016/S0301-7516(01)00046-1. [DOI] [Google Scholar]
- Gupta V. Pathak D. K. Siddique S. Kumar R. Chaudhary S. Constr. Build. Mater. 2020;235:117413. doi: 10.1016/j.conbuildmat.2019.117413. [DOI] [Google Scholar]
- Kovalchuk G. Fernández-Jiménez A. Palomo A. Fuel. 2007;86:315–322. doi: 10.1016/j.fuel.2006.07.010. [DOI] [Google Scholar]
- Swanepoel J. C. Strydom C. A. Appl. Geochem. 2002;17:1143–1148. doi: 10.1016/S0883-2927(02)00005-7. [DOI] [Google Scholar]
- Thommes M. Kaneko K. Neimark A. V. Olivier J. P. Rodriguez-Reinoso F. Rouquerol J. Sing K. S. Pure Appl. Chem. 2015;87:1051–1069. [Google Scholar]
- Sing K. Colloids Surf., A. 2001;187:3–9. doi: 10.1016/S0927-7757(01)00612-4. [DOI] [Google Scholar]
- Kim K. C. Yoon T.-U. Bae Y.-S. Microporous Mesoporous Mater. 2016;224:294–301. doi: 10.1016/j.micromeso.2016.01.003. [DOI] [Google Scholar]
- Passe-Coutrin N. Altenor S. Cossement D. Jean-Marius C. Gaspard S. Microporous Mesoporous Mater. 2008;111:517–522. doi: 10.1016/j.micromeso.2007.08.032. [DOI] [Google Scholar]
- Dias A. Ciminelli V. S. T. Ferroelectrics. 2000;241:9–16. doi: 10.1080/00150190008224969. [DOI] [Google Scholar]
- Juang R.-S. Wu F.-C. Tseng R.-L. Colloids Surf., A. 2002;201:191–199. doi: 10.1016/S0927-7757(01)01004-4. [DOI] [Google Scholar]
- Sahoo P. Tripathy S. Panigrahi M. Equeenuddin S. M. Appl. Water Sci. 2013;3:567–576. doi: 10.1007/s13201-013-0113-2. [DOI] [Google Scholar]
- Chen J. Zhang J. Wang W. Ma X. Guo Y. Sun F. Wang Y. Spectrosc. Lett. 2020;53:1–14. doi: 10.1080/00387010.2019.1686397. [DOI] [Google Scholar]
- Bener S. Bulca Ö. Palas B. Tekin G. Atalay S. Ersöz G. Process Saf. Environ. 2019;129:47–54. doi: 10.1016/j.psep.2019.06.010. [DOI] [Google Scholar]
- Bulca Ö. Palas B. Atalay S. Ersöz G. J. Water Process Eng. 2021;40:101821. doi: 10.1016/j.jwpe.2020.101821. [DOI] [Google Scholar]
- Nakhate P. H. Gadipelly C. R. Joshi N. T. Marathe K. V. J. Ind. Eng. Chem. 2019;69:77–89. doi: 10.1016/j.jiec.2018.09.010. [DOI] [Google Scholar]
- Rao V. B. Rao S. R. M. Chem. Eng. J. 2006;116:77–84. doi: 10.1016/j.cej.2005.09.029. [DOI] [Google Scholar]
- Adeyemo A. A. Adeoye I. O. Bello O. S. Appl. Water Sci. 2015;7:543–568. doi: 10.1007/s13201-015-0322-y. [DOI] [Google Scholar]
- Fungaro D. A. Bruno M. Grosche L. C. Desalin. Water Treat. 2009;2:231–239. doi: 10.5004/dwt.2009.305. [DOI] [Google Scholar]
- Santhi T. Manonmani S. Sustainable Environ. Res. 2012;22:45. [Google Scholar]
- Boumediene M. Benaïssa H. George B. Molina S. Merlin A. J. Mater. Environ. Sci. 2018;9:1700–1711. [Google Scholar]
- Pooresmaeil M. and Namazi H., in Hydrogels Based on Natural Polymers, ed. Y. Chen, Elsevier, 2020, pp. 411–455, 10.1016/B978-0-12-816421-1.00014-8 [DOI] [Google Scholar]
- Gorzin F. Bahri Rasht Abadi M. Adsorpt. Sci. Technol. 2018;36:149–169. doi: 10.1177/0263617416686976. [DOI] [Google Scholar]
- Belhachemi M. Addoun F. Appl. Water Sci. 2011;1:111–117. doi: 10.1007/s13201-011-0014-1. [DOI] [Google Scholar]
- Mor S. Ravindra K. Bishnoi N. R. Bioresour. Technol. 2007;98:954–957. doi: 10.1016/j.biortech.2006.03.018. [DOI] [PubMed] [Google Scholar]
- Khan T. Isa M. H. Ul Mustafa M. R. Yeek-Chia H. Baloo L. Binti Abd Manan T. S. Saeed M. O. RSC Adv. 2016;6:56365–56374. doi: 10.1039/C6RA05618K. [DOI] [Google Scholar]
- Patil C. S. Kadam A. N. Gunjal D. B. Naik V. M. Lee S.-W. Kolekar G. B. Gore A. H. Sep. Purif. Technol. 2020:247. [Google Scholar]
- Lyu Y. Ye H. Zhao Z. Tian J. Chen L. Resour., Conserv. Recycl. 2020:155. [Google Scholar]
- AlNouss A. Parthasarathy P. Shahbaz M. Al-Ansari T. Mackey H. McKay G. Appl. Energy. 2020:261. [Google Scholar]
- Bilińska L. Gmurek M. Ledakowicz S. Chem. Eng. J. 2016;306:550–559. doi: 10.1016/j.cej.2016.07.100. [DOI] [Google Scholar]
- Ozgun H. Cicekalan B. Akdag Y. Koyuncu I. Ozturk I. Sci. Total Environ. 2021;778:146258. doi: 10.1016/j.scitotenv.2021.146258. [DOI] [PubMed] [Google Scholar]
- Mousset E. Loh W. H. Lim W. S. Jarry L. Wang Z. Lefebvre O. Water Res. 2021;200:117234. doi: 10.1016/j.watres.2021.117234. [DOI] [PubMed] [Google Scholar]


