Abstract
Gold nanoclusters (Au NCs), which have the characteristics of small size, near infrared (NIR) absorption and long triplet excited lifetime, have been used as a new type of photosensitizer for deep tissue photodynamic therapy (PDT). However, the therapeutic efficiency of the nano-system based on Au NCs still needs to be improved. Herein, we proposed a strategy using Mito-Au25@MnO2 nanocomposites to achieve enhanced PDT. Au25(Capt)18− nanoclusters were applied as photosensitizers and further modified with peptides to target mitochondrial and MnO2 nanosheets to consume glutathione (GSH). In the presence of GSH, Mito-Au25@MnO2 dis-integrated and Mito-Au25 nanoparticles realized accurate mitochondrial targeting. Under the irradiation of 808 nm light, the nanocomposite ensured highly efficient PDT both in vitro and in vivo via oxidation pressure elevation and mitochondrial targeting in cancer cells.
This is the first example of mitochondrial targeting Au NCs capable of improving the efficiency of photodynamic therapy. Mito-Au25@MnO2 can be activated by consuming GSH and elevating oxidation pressure in cancer cells.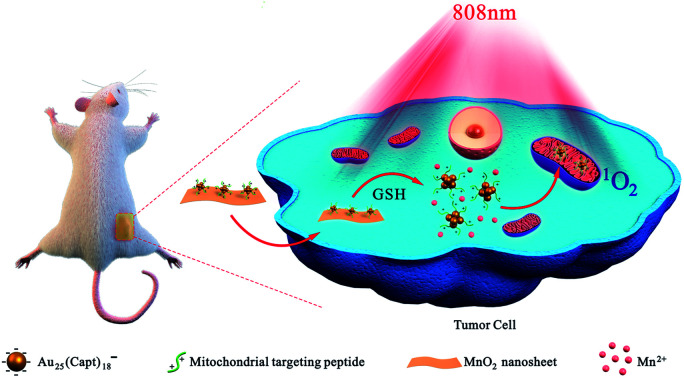
Introduction
Gold nanoclusters (Au NCs), consisting of a few to hundreds of gold atoms, exhibit discrete energy levels as their size (∼2 nm) approaches the Fermi-wavelength of electrons.1,2 Due to the unique molecule-like properties such as optical absorption and photoluminescence, Au NCs were widely used in biosensing,3 imaging4,5 and detection.6 Furthermore, the photophysical property of Au NCs could be regulated by ligands to achieve strong near infrared (over 800 nm) absorption7 and long lifetime of excited triplet state.8 As we know, near infrared (NIR) excitation could reduce light scattering and absorption of endogenous molecules when interact with biological tissues, thus it's promising in tissue penetration and biological safety.9 Consequently, Au NCs have been used as a new type of photosensitizers (PSs) for photodynamic therapy (PDT) which impart cytotoxicity via exciting photosensitizers in appropriate wavelengths of light.10 More importantly, compared with PSs loaded on upconversion nanoparticles,11 Au NCs improve the utilization efficiency of NIR excitation directly, without considering loading capacity and energy transfer efficiency.
In the meanwhile, the recent research suggests that MnO2 nanosheets cooperating with PSs can elevate cellular uptake of PSs and upgrade oxidation pressure of cancer cells.12 On the one hand, high concentration of glutathione (2–10 mM) alleviates the PDT effect via consuming reactive oxygen species (ROS) generated by PSs.13,14 MnO2 nanosheets can be reduced to Mn2+ by GSH, which will deplete GSH and strengthen oxidation pressure in cancer cells.12 On the other hand, Au NCs with small size are prone to accumulate at the liver and spleen instead of tumor tissue.15 MnO2 nanosheets are suitable for enlarging the size of nanomaterials (up to 100–200 nm), which will improve the passive targeting ability of nanomaterials by enhanced permeability and retention effect (EPR). Unfortunately, there are still two main disadvantages of the assembled Au NCs and MnO2 nanosheets. Firstly, complex charge conversion operation is needed before the negatively charged MnO2 nanosheets are assembled with Au NCs. Secondly, this kind of nanocomposites still lack of mitochondrial targeting ability which is of significant importance to elevate the PDT efficiency.16 Due to the short lifetime (<200 ns) and limited movement distance (∼20 nm), ROS are difficult to reach the core area of cancer cells and can't provide efficient tumor treatment capabilities.17 Mitochondria play an important role in providing energy through oxidation of carbohydrates, fat and amino acids.18 Besides, they are extremely fragile organelles in eukaryocyte cells because single-stranded mito-DNA is easier to be destroyed and thus accelerating the necrosis and apoptosis of cancer cells.19 Therefore, nanocomposites which can target mitochondria will make full use of ROS and enhance PDT effect. Hence, constructing a new nano-system which can not only realize mitochondrial targeting but also facilitate direct electrostatic interaction with MnO2 nanosheets is conducive to elevate PDT efficiency.
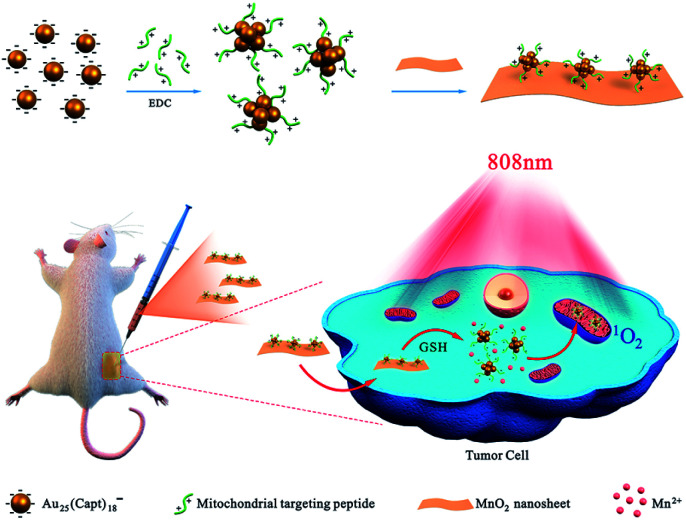
Herein, we utilized Au25(Capt)18− nanoclusters, which have good chemical stability, anti-photobleaching ability and long excitation wavelength at NIR I region as PSs. Subsequently, mitochondrial targeting peptides (Fr-(Cha)-K-NH2) were connected onto the surface of Au25(Capt)18− nanoclusters to obtain Mito-Au25 nanoparticles. Finally, the Mito-Au25@MnO2 nanocomposites were obtained through electrostatic interaction between Mito-Au25 nanoparticles and MnO2 nanosheets. As illustrated in Fig. 1, the Mito-Au25@MnO2 nanocomposite was an inactive photosensitizer before MnO2 nanosheets were consumed by GSH. After cellular uptake, MnO2 depleted GSH and the oxidation pressure increased in cancer cells. In the meanwhile, the nanocomposites disintegrated and Mito-Au25 was released to achieve specific targeting of mitochondrial, thus elevating the utilization efficiency of ROS. Under the irradiation of 808 nm laser, we successfully realized high-efficient, deep seated and reliable PDT on HepG2 cells and 4T1 tumor bearing mice. Compared with traditional methods,20,21 our study highlights the significance of subcellular targeting ability and GSH consumption efficiency.
Fig. 1. Schematic diagram of assembling process and the mechanism of Mito-Au25@MnO2 for in vivo PDT.
Results and discussion
Characterization and photophysical properties of Au25(Capt)18− nanoclusters
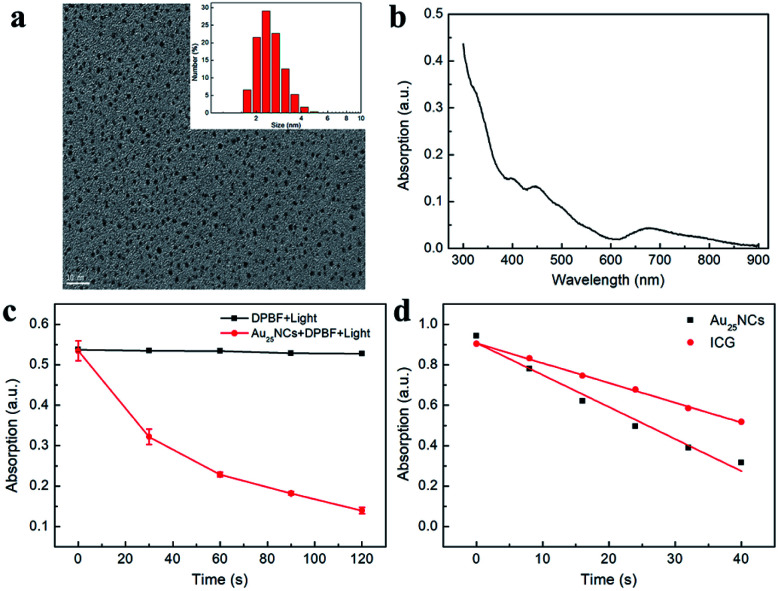
The Au25(Capt)18− nanoclusters (abbreviated as Au25NCs) were prepared using a NaBH4 reduction method at room temperature.22 As shown in Fig. 2a, the obtained Au25NCs had good dispersity and uniformed size. The average hydrodynamic diameter of Au25NCs was 2.515 ± 0.546 nm (Fig. 2a). Characteristic UV-Vis absorption spectra displayed at 670 nm, 450 nm and 400 nm (Fig. 2b) were in good accord with former research.23 With the excitation at 561 nm, the maximum fluorescence emission wavelength was at 740 nm (Fig. S1†). X-ray photoelectron spectroscopy (XPS) was employed to demonstrate the elemental composition and valence state of Au25NCs. Binding energy of Au 4f5/2 and Au 4f7/2 were 87.6 eV and 84.1 eV, respectively (Fig. S2a†). The orbital binding energy of Au 4f7/2 (84.1 eV) was between the binding energy of Au(0) (83.8 eV) and Au(i) (86.0 eV), which confirmed that Au(0) and Au(i) both existed in Au25NCs.24 These results were consistent with former core–shell structure theory.25 In addition, the binding energy of S 2p was 163.4 eV different from 168 eV (SO3−), which confirmed the formation of Au–S bound (Fig. S2b†).26,27 Therefore, we successfully synthesized Au25NCs.
Fig. 2. (a) TEM image and size distribution of Au25NCs. (b) UV-Vis absorption spectra of Au25NCs. (c) Singlet oxygen generation of Au25NCs. Time dependent absorption changes at 412 nm of DMF solutions of DPBF (200 μM) and Au25NCs (0 or 200 μg mL−1) mixture upon irradiation at 808 nm light. (d) Singlet oxygen generation efficiency liner fitting of Au25NCs and indocyanine green (ICG).
Singlet oxygen (1O2) generation ability of Au25NCs was monitored using singlet oxygen probe DPBF.28 The UV-Vis spectrum of DPBF and Au25NCs mixture solution was recorded after each 30 s of irradiation with 808 nm light. As shown in Fig. 2c, with increasing irradiation time, the absorption value at 412 nm decreased gradually, indicating the formation of 1O2. To our delight, the 1O2 quantum yield of Au25NCs was 9.12 times as much as indocyanine green (ICG), suggesting that Au25NCs could be used as excellent PSs to conduct PDT (Fig. 2d).
Characterization of MnO2 nanosheets
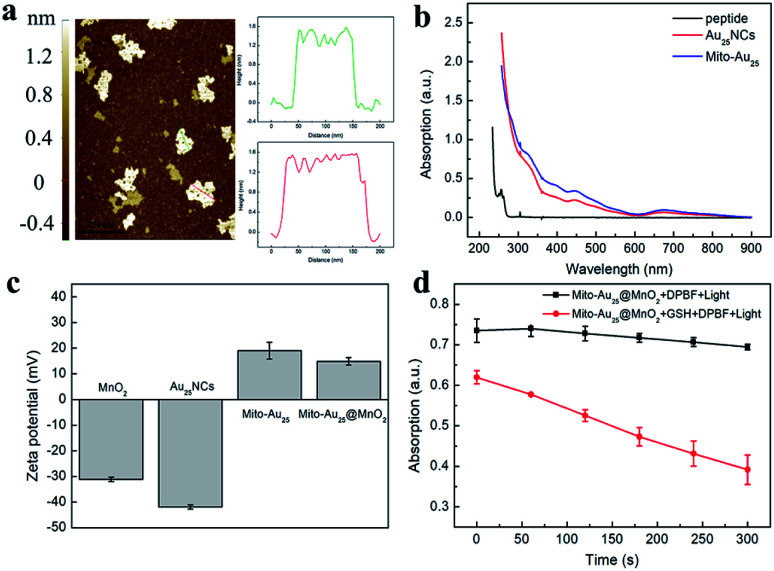
Two dimensional MnO2 nanosheets were prepared by ultrasonicating of bulk MnO2.29 The ultrathin MnO2 nanosheets had a broad optical absorption spectrum (250–700 nm) and its maximum absorption wavelength was 371 nm (Fig. S3†). Transmission electron microscopy (TEM) and field emission scanning electron microscope (FESEM) images showed that MnO2 nanosheets dispersed uniformly with sheet morphology (Fig. S4a, c and d†). The average hydrodynamic diameter of MnO2 nanosheets was 187.5 ± 71.36 nm (Fig. S4b†), and Fig. 3a indicated that these nanosheets were 1.2–1.6 nm in height, which were nearly two layers of MnO2 nanosheet (the theoretical thickness of the single-layered MnO2 nanosheet is 0.69–0.72 nm (ref. 30)). XPS graph showed that there were Mn 2p and O 1s in the spectrum (Fig. S5a†). It could be found that the binding energy of Mn 2p3/2 and Mn 2p1/2 were 641.3 eV and 653.2 eV, respectively (Fig. S5b†), with a spin-energy separation of 11.9 eV, which confirmed the formation of Mn(iv)O2 nanosheets.31 The reaction between MnO2 and GSH was tested. With the increasing concentration of GSH, the absorption of MnO2 at 371 nm decreased gradually (Fig. S6†), which indicated the reaction of MnO2 and GSH was concentration dependent.
Fig. 3. (a) Atomic force microscopy (AFM) image and corresponding height profile of MnO2 nanosheets. Scale bar: 250 nm. (b) UV-Vis absorption spectra of mitochondrial targeting peptide, Au25NCs and Mito-Au25. (c) Zeta potential of MnO2, Au25NCs, Mito-Au25 and Mito-Au25@MnO2. (d) GSH (0 or 200 μM) dominated activable 1O2 generation of Mito-Au25@MnO2. Time dependent absorption changes at 412 nm of DPBF (200 μM) and Mito-Au25@MnO2 (200 μg mL−1) mixture solution upon irradiation at 808 nm.
Characterization and photophysical properties of Mito-Au25 nanoparticles and Mito-Au25@MnO2 nanocomposites
The Mito-Au25 nanoparticles were synthesized through biological coupling reaction between mitochondrial targeting peptide and MnO2 nanosheets. Compared with Au25NCs, the size of these nanoparticles increased obviously (Fig. S7†), which was probably due to charge inversion and electrostatic interaction between Mito-Au25 and Au25NCs. Furthermore, a new UV-Vis absorption peak emerged at 276 nm after mitochondrial targeting peptide was modified onto the surface of Au25NCs, which was a little red shift referring to the characteristic absorption at 260 nm of mitochondrial targeting peptide (Fig. 3b). Fourier-transform infrared spectroscopy (FTIR) further proved the change of functional group at 3424 cm−1 (Fig. S8†). We monitored the 1O2 generation ability of Mito-Au25 to test whether the modification of peptide would influence the photophysical property of Au25NCs. As shown in Fig. S9a,† the absorption at 412 nm of DPBF and Mito-Au25 mixture solution decreased via a time dependent mode indicating the formation of 1O2. Three parallel experiments were conducted and confirmed the efficient 1O2 generation of Mito-Au25 nanoparticles (Fig. S9b†).
Zeta potential of Au25NCs, Mito-Au25 and MnO2 nanosheets were measured before assembling (Fig. 3c). Au25NCs were negatively charged (−41.9 mV). After modification of mitochondrial targeting peptide, Mito-Au25 showed the average zeta potential of 17.2 mV. The average zeta potential of MnO2 nanosheets was −30.4 mV, which presented an ideal charge state for electrostatic assembling. Finally, Mito-Au25@MnO2 nanocomposites were obtained through electrostatic interaction between positively charged Mito-Au25 nanoparticles and negatively charged MnO2 nanosheets. The average zeta potential of nanocomposites was 14.1 mV. UV-Vis absorption spectrum in Fig. S10† showed no characteristic absorption peak of Au25 NCs in supernatant after centrifugation procedure, which meant that 2.5 mg Mito-Au25 was completely assembled with 0.08 mg MnO2 nanosheets.
TEM was utilized to observe the morphology of Mito-Au25@MnO2 nanocomposites. As shown in Fig. S11a,† the nanocomposites presented good dispersity and no evident aggregation occurred. But the Mito-Au25 nanoparticles on the surface of MnO2 nanosheets were not clear. From the high-magnification image (Fig. S11b†), the Mito-Au25 nanoparticles were distinctively observed on the surface of nanocomposites and the nanomaterials presented clear sheet morphology. Furthermore, freely dispersed Mito-Au25 nanoparticles didn't exist. These results further confirmed the formation of Mito-Au25@MnO2. The ultimately obtained Mito-Au25@MnO2 displayed sheets morphology. Compared with mesoporous32 and nanoparticle33 structures, ultrathin nanosheets have more sensitive responsibility to tumor microenvironment (TME),34 which can not only lead to fast GSH consumption and oxidation pressure elevation in cancer cells, but also efficiently release photosensitizer to generate 1O2. Therefore, nanosheets morphology of Mito-Au25@MnO2 nanocomposites is benefit to the improvement of PDT efficiency. In the meanwhile, Mito-Au25@MnO2 nanocomposites maintained good thermal stability (Fig. S12†), which was also conducive to better PDT efficiency.
As expected, Mito-Au25@MnO2 nanocomposites could hardly generate 1O2 under 808 nm light irradiation (Fig. 3d). However, after GSH consuming part of MnO2 nanosheets (Fig. S13†), the Mito-Au25 nanoparticles released from nanocomposites still could generate 1O2 (Fig. 3d). The results verified the GSH activated PDT property of Mito-Au25@MnO2 nanocomposites evidently.
In virto mitochondrial targeting ability and PDT efficiency
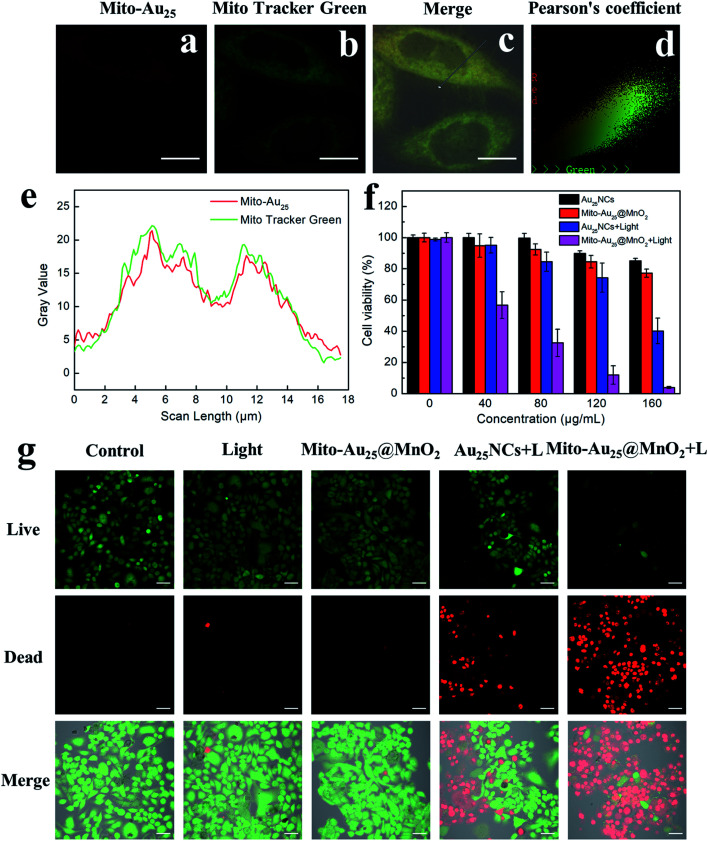
In order to get ready for subsequent cellular experiments, we first tested the cellular uptake efficiency. To HepG2 cells, the optimum cellular uptake time of Au25NCs and Mito-Au25@MnO2 were 2 h and 4 h, respectively (Fig. S14–S16†). The difference of cellular uptake time was probably related to the charge state, particle size and morphology of nanomaterials.35–37 Targeting ability of Mito-Au25 might also prolong cell retention time of nanocomposites. Mito Tracker Green (MTG) was used to compare mitochondrial colocalization efficiency of Au25NCs and Mito-Au25. A small part overlap of fluorescence signal of Au25NCs and MTG was observed (Fig. S17†), indicating that Au25NCs didn't have mitochondria specificity. On the country, thanks to the mitochondrial targeting peptide, the red fluorescence from Mito-Au25 (Fig. 4a) and the green fluorescence from MTG (Fig. 4b) showed significant overlap (Fig. 4c and e). The colocalization degree also intuitively showed in Fig. 4d with a Pearson's correlation factor of 0.965. All these statistics proved that Mito-Au25 could efficiently localized in mitochondria after cellular uptake.
Fig. 4. Fluorescence signal of (a) Mito-Au25 (160 μg mL−1, λex = 488 nm, λem = 650–760 nm) and (b) Mito Tacker Green (0.2 μM, λex = 488 nm, λem = 500–550 nm) in HepG2 cells. (c) Overlay of (a) and (b) in bright field. Scale bar: 10 μm. Pearson's colocalization coefficient (d) and profile gray value (e) of Mito-Au25 and Mito Tracker Green. (f) Cell viability of HepG2 cells treated with Au25NCs or Mito-Au25@MnO2 and irradiated at 808 nm (0 or 2.4 W cm−2) through CCK-8 assay. (g) Confocal images of Calcein-AM and PI stained HepG2 cells with different treatments (PBS, 808 nm light, Mito-Au25@MnO2, Au25NCs + 808 nm light and Mito-Au25@MnO2 + 808 nm light). Scale bar: 50 μm.
DCFH-DA as a kind of ROS probe was used to detect 1O2 generated in HepG2 cells.38 After oxidization by 1O2 to DCF, it showed bright green fluorescence under 488 nm excitation. As shown in Fig. S18,† HepG2 cells treated with Mito-Au25@MnO2 or 808 nm light nearly didn't exhibit green fluorescence signal. This phenomenon was similar with control group. While the cells treated with Mito-Au25@MnO2 followed by 808 nm light irradiation showed significant green fluorescence emission, indicating the generation of 1O2 in HepG2 cells.
To estimate the PDT efficiency of the prepared nanocomposites, four groups of HepG2 cells were treated under different conditions for 24 h and the cell viability were measured by CCK-8 assay. As shown in Fig. 4f, Au25NCs, Mito-Au25@MnO2 and 808 nm light had favourable biocompatibility because cells treated in these groups remained a high viability over 80%. However, when first incubated with Au25NCs or Mito-Au25@MnO2 and then accepted 808 nm light treatment, the cell viability sharply reduced to 40% and 4%, respectively (Fig. 4f). The result demonstrated superior cytotoxicity of Mito-Au25@MnO2 under 808 nm light irradiation. Furthermore, Calcein-AM and PI staining assay intuitively revealed the killing effect of different treatments (Fig. 4g). Taken together, the above results had confirmed that Mito-Au25@MnO2 had higher PDT efficiency than Au25NCs in vitro.
In vivo PDT efficiency
Before investigating the in vivo PDT effect, the biocompatibility of Mito-Au25@MnO2 (0, 5, and 10 mg kg−1) was evaluated. The results illustrated that the increasing trend of body weight from different group of mice had no difference during 14 days after injection (Fig. S19†), and the biochemical indicators of three groups of mice were all in normal range (Fig. S20†). H&E staining figures indicated few obvious injuries in major organs (Fig. S21†). These results suggested that Mito-Au25@MnO2 had favourable biocompatibility.
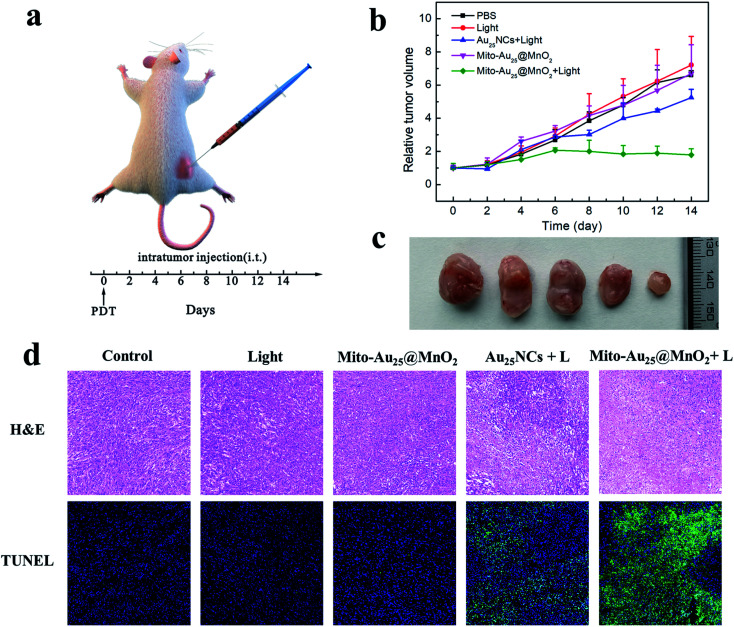
The 4T1 tumor bearing mice model was constructed to compare the therapeutic efficiency of Au25NCs and Mito-Au25@MnO2. When the tumor volume reached 100–150 mm3, the mice were divided into five groups randomly and were given different treatments: (1) PBS; (2) 808 nm light irradiation (1.46 W cm−2); (3) Mito-Au25@MnO2; (4) Au25NCs + 808 nm light irradiation and (5) Mito-Au25@MnO2 + 808 nm light irradiation. All these materials (PBS, Au25NCs and Mito-Au25@MnO2) were directly injected into the tumor (Fig. 5a). The body weight of mice in five groups reflected the same increasing trend (Fig. S22†), and the H&E staining results indicated few damages in major organs (Fig. S23†), verifying that all the experimental treatments had hardly adverse effect to the mice. As shown in Fig. 5b and c, 808 nm light or Mito-Au25@MnO2 didn't affect the growth rate of tumor tissues and these two groups showed the same growing trend with blank control. On the contrary, the tumor growth rate of mice treated with nanomaterials together with 808 nm laser slowed down, and Mito-Au25@MnO2 was more effective than Au25NCs in inhibiting tumor growth. Besides, the tumor tissues in different group were excised for H&E and TUNEL staining. As expected, the group treated with Mito-Au25@MnO2 and 808 nm light showed the highest level of tumor tissue damage (Fig. 5d), indicating that GSH consumption ability and mitochondrial targeting ability of nanocomposites could remarkably enhance the therapeutic efficiency.
Fig. 5. (a) Schematic illustration of in vivo antitumor study. (b) Relative tumor volume of mice with various treatments. (c) Representative photographs of the corresponding excised tumor (from left to right were given PBS, 808 nm light, Mito-Au25@MnO2, Au25NCs + 808 nm light and Mito-Au25@MnO2 + 808 nm light, respectively). (d) Images of H&E and TUNEL stained tumor tissues. Scale bar: 100 μm.
Conclusions
In summary, we constructed an efficient nanocomposite system named Mito-Au25@MnO2 and fulfilled enhanced PDT. The nano-system consisting of Au25(Capt)18−, mitochondrial targeting peptide and GSH consumable MnO2 nanosheets was structured through chemical modification and electrostatic interaction. Mito-Au25@MnO2 nanocomposite was an inactive photosensitizer before GSH decomposed MnO2 nanosheets. Once MnO2 nanosheets were depleted, the nanocomposite turned into Mito-Au25 nanoparticles. With the consumption of GSH, oxidation pressure elevated and Mito-Au25 anchored mitochondria in cancer cells. Cell viability decreased remarkably to 4% under 808 nm light irradiation by fully utilization of ROS. Eventually, we realized efficient therapy of 4T1 tumor bearing mice. These results confirmed that GSH consumption and mitochondrial targeting were promising strategies for PDT. We conceive that this study will encourage further exploitation on PDT based on Au NCs.
Ethical statement
All animal studies were performed according to the Guidelines for the Care and Use of Laboratory Animals of the Chinese Animal Welfare Committee and approved by the Institutional Animal Care and Use Committee, Wuhan University Center for Animal Experiment, Wuhan, China.
Conflicts of interest
The authors declare no competing financial interest.
Supplementary Material
Acknowledgments
This work was supported by National Natural Science Foundation of China (No. 21625503).
Electronic supplementary information (ESI) available: Synthesis and characterization of Mito-Au25@MnO2 and supplementary spectral results. See DOI: 10.1039/d1ra03469c
References
- Tao Y. Li M. Q. Ren J. S. Qu X. G. Chem. Soc. Rev. 2015;44:8636–8663. doi: 10.1039/C5CS00607D. [DOI] [PubMed] [Google Scholar]
- Jin R. C. Nanoscale. 2010;2:343–362. doi: 10.1039/B9NR00160C. [DOI] [PubMed] [Google Scholar]
- Wang Y. C. Wang Y. Zhou F. B. Kim P. Xia Y. N. Small. 2012;8:3769–3773. doi: 10.1002/smll.201201983. [DOI] [PMC free article] [PubMed] [Google Scholar]
- Sun C. J. Yang H. Yuan Y. Tian X. Wang L. M. Guo Y. Xu L. Lei J. L. Gao N. Anderson G. J. Liang X. J. Chen C. Y. Zhao Y. L. Nie G. J. J. Am. Chem. Soc. 2011;133:8617–8624. doi: 10.1021/ja200746p. [DOI] [PubMed] [Google Scholar]
- Song X. R. Zhu W. Ge X. G. Li R. F. Li S. H. Chen X. Song J. B. Xie J. P. Chen X. Y. Yang H. H. Angew. Chem., Int. Ed. 2020;59:2–9. doi: 10.1002/anie.201914768. [DOI] [Google Scholar]
- Peng H. P. Jian M. L. Huang Z. N. Wang W. J. Deng H. H. Wu W. H. Liu A. L. Xia X. H. Chen W. Biosens. Bioelectron. 2018;105:71–76. doi: 10.1016/j.bios.2018.01.021. [DOI] [PubMed] [Google Scholar]
- Wu Z. K. Jin R. C. Nano Lett. 2010;10:2568–2573. doi: 10.1021/nl101225f. [DOI] [PubMed] [Google Scholar]
- Kawasaki H. Kumar S. Li G. Zeng C.-J. Kauffman D. R. Yoshimoto J. Iwasaki Y. Jin R.-C. Chem. Mater. 2014;26:2777–2788. doi: 10.1021/cm500260z. [DOI] [Google Scholar]
- Tang Y. F. Pei F. Lu X. M. Fan Q. L. Huang W. Adv. Opt. Mater. 2019;7:1900917. doi: 10.1002/adom.201900917. [DOI] [Google Scholar]
- Ho-Wu R. Yau S.-H. Goodson T. J. Phys. Chem. B. 2017;121:10073–10080. doi: 10.1021/acs.jpcb.7b09442. [DOI] [PubMed] [Google Scholar]
- Song D. Chi S.-Y. Li X. Wang C.-X. Li Z. Liu Z.-H. ACS Appl. Mater. Interfaces. 2019;11:41100–41108. doi: 10.1021/acsami.9b16237. [DOI] [PubMed] [Google Scholar]
- Fan H. H. Yan G. B. Zhao Z. L. Hu X. X. Zhang W. H. Liu H. Fu X. Y. Fu T. Zhang X. B. Tan W. H. Angew. Chem., Int. Ed. 2016;55:5477–5482. doi: 10.1002/anie.201510748. [DOI] [PMC free article] [PubMed] [Google Scholar]
- Tu Y. F. Peng F. White P. B. Wilson D. A. Angew. Chem., Int. Ed. 2017;56:7620–7624. doi: 10.1002/anie.201703276. [DOI] [PMC free article] [PubMed] [Google Scholar]
- Jiang F. Robin A. M. Katakowski M. Tong L. Espiritu M. Singh G. Chopp M. Lasers Med. Sci. 2003;18:128–133. doi: 10.1007/s10103-003-0269-3. [DOI] [PubMed] [Google Scholar]
- Zhuang Q. F. Jia H. Y. Du L. B. Li Y. C. Chen Z. Huang S. P. Liu Y. Biosens. Bioelectron. 2014;55:76–82. doi: 10.1016/j.bios.2013.12.003. [DOI] [PubMed] [Google Scholar]
- Bi H. T. Dai Y. L. Yang P. P. Xu J. T. Yang D. Gai S. L. He F. An G. H. Zhong C. N. Lin J. Chem. Eng. J. 2019;356:543–553. doi: 10.1016/j.cej.2018.09.076. [DOI] [Google Scholar]
- Pan L. M. Liu J. N. Shi J. L. Adv. Funct. Mater. 2014;24:7318–7327. doi: 10.1002/adfm.201402255. [DOI] [Google Scholar]
- Fulda S. Galluzzi L. Kroemer G. Nat. Rev. Drug Discovery. 2010;9:447–464. doi: 10.1038/nrd3137. [DOI] [PubMed] [Google Scholar]
- Yan B. Dong L. F. Neuzil J. Mitochondrion. 2016;26:86–93. doi: 10.1016/j.mito.2015.12.007. [DOI] [PubMed] [Google Scholar]
- Chen Q. Chen J. Yang Z. Zhang L. Dong Z. Liu Z. Nano Res. 2018;11:5657–5669. doi: 10.1007/s12274-017-1917-4. [DOI] [Google Scholar]
- Yang D. Yang G. Gai S. He F. An G. Dai Y. Lv R. Yang P. Nanoscale. 2015;7:19568–19578. doi: 10.1039/C5NR06192J. [DOI] [PubMed] [Google Scholar]
- Kumar S. Jin R. C. Nanoscale. 2012;4:4222–4227. doi: 10.1039/C2NR30833A. [DOI] [PubMed] [Google Scholar]
- Zhu M. Z. Aikens C. M. Hollander F. J. Schatz G. C. Jin R. C. J. Am. Chem. Soc. 2008;130:5883–5885. doi: 10.1021/ja801173r. [DOI] [PubMed] [Google Scholar]
- Negishi Y. Nobusada K. Tsukuda T. J. Am. Chem. Soc. 2005;127:5261–5270. doi: 10.1021/ja042218h. [DOI] [PubMed] [Google Scholar]
- Zhu M. Z. Aikens C. M. Hollander F. J. Schatz G. C. Jin R. C. J. Am. Chem. Soc. 2008;130:5883–5885. doi: 10.1021/ja801173r. [DOI] [PubMed] [Google Scholar]
- Tang Z. H. Xu B. Wu B. H. Germann M. W. Wang G. L. J. Am. Chem. Soc. 2010;132:3367–3374. doi: 10.1021/ja9076149. [DOI] [PubMed] [Google Scholar]
- Shang L. Azadfar N. Stockmar F. Send W. Trouillet V. Bruns M. Gerthsen D. Nienhaus G. U. Small. 2011;7:2614–2620. doi: 10.1002/smll.201100746. [DOI] [PubMed] [Google Scholar]
- McDonnell S. O. Hall M. J. Allen L. T. Byrne A. Gallagher W. M. O'Shea D. F. J. Am. Chem. Soc. 2005;127:16360–16361. doi: 10.1021/ja0553497. [DOI] [PubMed] [Google Scholar]
- Zhao Z. L. Fan H. H. Zhou G. F. Bai H. R. Liang H. Wang R. W. Zhang X. B. Tan W. H. J. Am. Chem. Soc. 2014;136:11220–11223. doi: 10.1021/ja5029364. [DOI] [PubMed] [Google Scholar]
- Ma Z. P. Shao G. J. Fan Y. Q. Wang G. L. Song J. J. Shen D. J. ACS Appl. Mater. Interfaces. 2016;8:9050–9058. doi: 10.1021/acsami.5b11300. [DOI] [PubMed] [Google Scholar]
- Fan W. P. Bu W. B. Shen B. He Q. J. Cui Z. W. Liu Y. Y. Zheng X. P. Zhao K. L. Shi J. L. Adv. Mater. 2015;27:4155–4161. doi: 10.1002/adma.201405141. [DOI] [PubMed] [Google Scholar]
- Yang G. Xu L. Chao Y. Xu J. Sun X. Wu Y. Peng R. Liu Z. Nat. Commun. 2017;8:902. doi: 10.1038/s41467-017-01050-0. [DOI] [PMC free article] [PubMed] [Google Scholar]
- Liu X. Tian K. Zhang J. Zhao M. Liu S. Zhao Q. Huang W. ACS Appl. Bio Mater. 2019;2:1225–1232. doi: 10.1021/acsabm.8b00790. [DOI] [PubMed] [Google Scholar]
- Liu Z. Zhang S. Lin H. Zhao M. Yao H. Zhang L. Peng W. Chen Y. Biomaterials. 2018;155:54–63. doi: 10.1016/j.biomaterials.2017.11.015. [DOI] [PubMed] [Google Scholar]
- Hirsch V. Kinnear C. Moniatte M. Rothen-Rutishauser B. Clift M. J. D. Fink A. Nanoscale. 2013;5:3723–3732. doi: 10.1039/C2NR33134A. [DOI] [PubMed] [Google Scholar]
- Chithrani B. D. Ghazani A. A. Chan W. C. W. Nano Lett. 2006;6:662–668. doi: 10.1021/nl052396o. [DOI] [PubMed] [Google Scholar]
- Chithrani B. D. Chan W. C. W. Nano Lett. 2007;7:1542–1550. doi: 10.1021/nl070363y. [DOI] [PubMed] [Google Scholar]
- Shen S. Zhu C. L. Huo D. Yang M. X. Xue J. J. Xia Y. N. Angew. Chem., Int. Ed. 2017;56:8801–8804. doi: 10.1002/anie.201702898. [DOI] [PMC free article] [PubMed] [Google Scholar]
Associated Data
This section collects any data citations, data availability statements, or supplementary materials included in this article.


