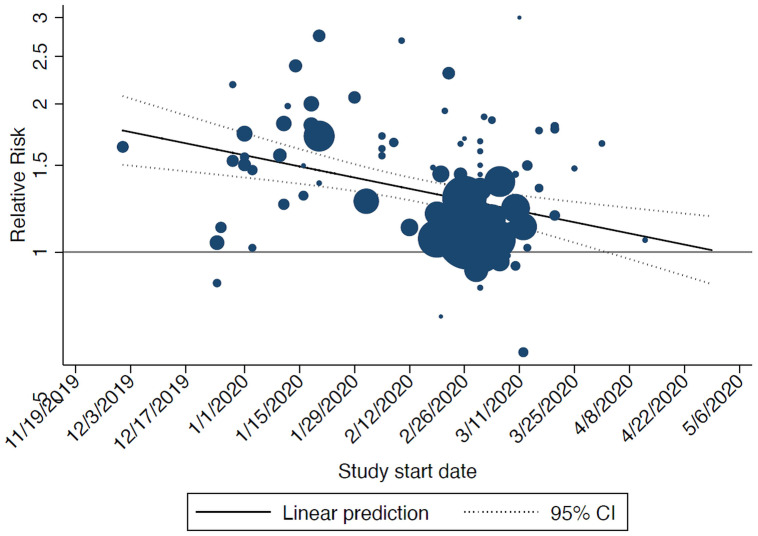
Figure 5. Bubble plot showing the results from the meta-regression on start date of included studies and relative risk of death (men vs women): the later the start date of the study the lower the risk of death for men compared to women.
The size of the circles is inversely proportional to the variance of the estimated treatment effect. The dashed lines represent the limits of the 95% confidence interval (CI).

