

Abstract
The postmodernism stance critiques the current discourse of modern consumption–based societies. These societies legitimize their embedded beliefs and actions based on their lifestyle reflected through their consumption patterns. Their consumption patterns relate to carbon footprints that are yet to be explored in the current body of knowledge at the macro level. The legitimacy of their lifestyle and consumption patterns rely on their conscious efforts in reducing carbon footprints. This study uses the environmental Kuznets curve model and explores the impact of household lifestyle and household consumption patterns on CO2 emissions across different cultures and societies worldwide. 49 countries were taken to assess how different cultures define consumption patterns related to CO2 emission. The results showed that the curvilinear relationship between consumption and CO2 depends on the country’s national cultural orientation.
Keywords: Climate change, Carbon emissions, Environment stability, National culture
Introduction
Creating environment sustainability for social and cultural development has become one of the eminent agenda points in the world today. Globally, humans face challenges for socioeconomic and environmental sustainability (Ameyaw and Yao 2018; Aye and Edoja 2017; Bhattacharya 2020). In recent times, sustainability is the main problem and concern that has interconnected the economic, social, and environmental problems (Scurati et al. 2021). Environmental sustainability can be defined as the condition of interconnectedness, resilience, and balance, which allows humans to satisfy their needs, and it also supports ecosystems by continuing the renewal of the necessary services and further reducing biological diversity (Morelli 2011). Environmentalists and scientists agree that CO2 emissions are a great threat to climate change because they increase the temperature and fluctuate weather conditions. A global aggregate effort is needed to address the environmental complications (Ikram et al. 2020; Jebli et al. 2016; Mendonca et al. 2020).
Traditionally, economic performance is positively associated with environmental degradation, but according to the environmental Kuznets curve (EKC), a different relationship between economic growth and environmental quality, especially in the previous two decades. Environmental Kuznets curve (EKC) establishes a U-shaped hypothesis between economic growth and environmental pollution (Disli et al. 2016). At the initial development stages, greenhouse gasses increase as growth increases, and ultimately, it causes climate change and global warming. Once a country reaches a certain development level, it focuses on environmentally friendly technology, and consumers’ awareness of environmental quality decreases the greenhouse gasses (Aslanidis 2010; Dinda 2004). The same is expected for the demand or consumption practices of the households, denoting demand-led EKC.
For the case of demand-led EKC, natural culture presents itself as a major contextual aspect. It is the dominating factor that shapes individuals’ and groups’ collaborations and interactions. Culture comprises norms, values, and beliefs, which shapes human interactions as a strong informal institution (Hofstede 2016; Onel and Mukherjee 2014). Hofstede (1984b) defines culture as the “collective mind programming” that differentiates one group member from another group. Taking culture as a significant factor, we evaluate a country’s specific cultural values, which affects its consumption patterns. Hofstede et al. (2010) provided six dimensions to distinguish the cultures of the countries, which includes (1) individualism vs collectivism, (2) high-power vs low-power distance, (3) masculinity vs femininity, (4) long-term vs short-term orientation, (5) indulgence vs restraint, and (6) high-risk vs low-risk.
Researchers and policymakers have shifted their intentions to study climate change problems associated with human activities in the global policy agenda. In 2010, carbon dioxide emissions were considered the major cause of climate change, accounting for about 76% of the global greenhouse gas emissions resulting from human activities (IPCC 2013). The presence of CO2 emissions is a natural process due to the carbon cycle of the earth, such as the movement of carbon between animals, oceans, atmosphere, and plants, where human activities are affecting the carbon balance by adding more carbon emissions to the atmosphere that is called ecological footprint (Disli et al. 2016).
The efficiency of technology and individual personal lifestyle impacts energy use and subsequent CO2 emissions. In the late 1980s, research has paid attention to the impacts of the behaviours of consumers related to the use of energy, and they introduced the lifestyle concept. They tried to examine the impact of personal lifestyle on economic activity, energy consumption and environmental changes. A study by Schipper et al. (1989) provided that the personal activities of the consumers, including transportation, homes, and other services, use 45–55% of the total energy. Personal activities and locations of the consumers affect the energy demands. Environmental damage is also caused by the consumption behaviour of the individuals directly by disposing of the trashes and pollution from their cars or indirectly by their production activities for satisfying them (Daly 1996; Duchin 1998; Rees 1995). A study conducted in Australia by Lenzen (1998) evaluated the effect of the activities of the consumers on the energy consumption gas emissions by using the input-output model. This study revealed that the energy consumption is moderately different across the countries, and they do not support the environmental Kuznets curve. A study of USA and Europe provides that the ratio of CO2 emissions caused by energy consumption is about 40–50% of the total CO2 emissions in a year (Cohen et al. 2005; Lenzen 1998; H.-C. Park and Heo 2007; Vringer and Blok 1995).
In recent years, CO2 emissions have risen rapidly with economic development (Shahbaz et al. 2017). Domestic energy consumption is the direct and close reason for CO2 emissions (Feng et al. 2011), while energy is consumed in manufacturing goods and services, which is the indirect reason for CO2 emissions. There are numerous reasons for an increase in the CO2 emissions indirectly by the indirect use of energy, including economic activity (such as manufacturing, distributing, and using the products), home appliances, private transport, and housing which were considered to improve the living standards. A study conducted by Reinders et al. (2003) analyzed household consumption in 11 European Union countries revealed that home energy consumption differs from expenditures. Globally, governments are developing policies to minimize greenhouse gasses to reduce the impacts of climate change (Naseri et al. 2022).
A study conducted based on panel data from 69 countries by Ibrahim and Law (2014) revealed a moderating effect of social capital on EKC for CO2 emissions. As national culture shapes the behaviours of individuals and groups in any country, it is significant in the rise of CO2 emissions. National culture is considered an informal institution shaped through human interactions and rooted in underlying beliefs, norms, and values (Hofstede 2001; Onel and Mukherjee 2014). The evolution of culture changes the preferences of consumption patterns of individuals. This change comes from institutional development, technological shifts, and knowledge spillovers across the regions. These transitions affect people’s buying behaviours, and they make adjustments in their daily life by using modern and environmentally friendly equipment. For instance, low carbon emissions of home appliances would be preferred in a community who have evolved their social responsibility to protect their environment and know its benefits to society. Power dynamics also influence consumption preferences. In low power distance countries, people perceive their green preferences towards green consumption, and on the other hand, high power distance promotes low green consumption (L. Yan et al. 2021). Generally, people have a carbon literacy orientation, and they are highly prone to green consumption behaviour once they interact in the following cultural dimensions: low uncertainty avoidance, long term orientation, low power distance, masculinity, and collectivist and indulgent societies.
Energy consumptions and CO2 emissions are higher in developed countries due to their luxurious lifestyle. As per World Wildlife Fund, in the USA, a normal citizen needs 10-ha area to live his or her lifestyle, whereas the average European needs 5 ha (Gupta 2011). US households emitted over 6 times more CO2 emissions per year as compared to the rest of the world. As the population, globalization, and culture are developed, households consume more energy, resulting in increased CO2 emissions (Gupta 2011). West values are based upon individualism followed by utilitarianism, the culture followed by the developed countries gradually transfers towards developing countries. Following the lifestyle and culture of the developed countries, the households in the developing countries are consuming more energy to live (Gupta 2011). A study in China by Wei et al. (2007) revealed that economic activities and individual lifestyles demand 26% of the total energy and 30% of the CO2 emissions per year. In this era of globalization and advanced urban areas, rich individuals consume more energy following the advanced western culture, lifestyle, and values by getting information through mass media. Reducing energy consumption and carbon emissions requires technologies and materials with low environmental impacts (Praticò et al. 2020).
CO2 emissions are increasing due to household energy consumption in every country, but this is increasing in China. The household sector in China consumed 406 million tons of oil in 2014, which accounts for 20% of total energy consumption (IEA 2016b), and in 2014, CO2 emissions were 343.9 million tons (IEA 2016a). The major source of energy consumption and CO2 emissions has become household consumption (Liang et al. 2007). The literature also shows that households with different income levels impact energy consumption differently (W. Yan and Minjun 2009). There should be attention paid to the income levels of the households when estimating the impact of their energy consumption. Another crisis is climate change, which threatens the human and natural environment as extreme weather conditions and constant changes in the climate result in an increase in CO2 emissions.
Additionally, the global outbreak of COVID-19 has threatened human life. There is a direct association between human activities and CO2 emissions due to the consumption of fossil fuels (Gupta 2011). As energy demands have decreased during the COVID-19 outbreak, CO2 emissions have also declined because of reducing manufacturing activities, reduced air regional transport, and household energy demand. A complete lockdown has been imposed throughout the world to control the virus spread, decreasing by around 30% in the energy consumption related to the industry (McKibbin and Fernando 2020).
The study by Evans (2020) demonstrated that after World War II, the world had a huge fall in CO2 emissions; this study is based on the estimates obtained from the power plants and indirect pollutants of the environment. As per the reports, a 3.8% decrease was observed in the global energy demands during the first quarter of 2020, resulting in CO2 emissions decreasing by more than 5% compared to the first quarter of 2019. Z. Liu et al. (2020) demonstrated that the decrease in CO2 emissions varies among countries, cultures, and regions. Different countries, including USA, reported a decrease of 7.6%, India 12.7%, and UK 19.3% in CO2 emissions, while there was only a smaller change in China as 1.4%. Z. Liu et al. (2020) also showed a decrease of 5.5% in the manufacturing industry, which results in a 29% decrease in the total CO2 emissions worldwide. There was a decrease in CO2 emissions caused by industry, in China by 39% and in India by 33%. A decline in air and ground transportation also decreased CO2 emissions by 18.6%, and a 43% decrease was observed in the first half of 2020, respectively (Z. Liu et al. 2020).
This study aims to analyze the quadratic impact of the share of consumption in economic activity on CO2 emissions while assessing the national culture as a contextual factor. Studies that have assessed the relationship between consumption patterns with CO2 emissions (He et al. 2017; Saleem and Ali 2019; Shi et al. 2020; J. Zhang et al. 2017b; Y.-J. Zhang et al. 2017a) but this is the first study to analyze this relationship while considering cultural differences to underline the sustainable cultural practices. This study reveals that cultures with higher standard lifestyles and higher-income positively impact CO2 emissions. This study provides key policy instruments to eliminate CO2 emissions by moderating consumption practices.
Literature review
The focus is on the growing GHG through household consumption globally. Only certain industries are focused on energy consumption measures and policies, while household consumption is the major source of CO2 emissions (Feng et al. 2011). Human activities influence about 45 to 55% of the total energy consumption (Schipper et al. 1989), consequently leading to emissions. A study conducted in Denmark by Munksgaard et al. (2000) used the decomposition method to measure the association between household consumption and CO2 emission from 1966 to 1992. A study conducted by Reinders et al. (2003) examined the relationship between household consumption and CO2 emissions in 11 EU countries. This study demonstrated that household consumption is varied and dependent on expenditure levels; indirect demands of energy by households and their spending were related linearly.
Greenhouse gasses are affecting the atmosphere, and these effects are increasing day by day (Houghton et al. 1990; IPCC. 1991). Global climate is threatening due to the growth of these gasses. Scientists believe that these gasses are increasing through human activities. Numerous human activities increase these gasses, also called driving forces, including economic activities, population, technology, economic and political institutions, beliefs, and attitudes (Wei et al. 2007). These forces increase CO2 emissions, but the global environment is also changing.
Culture, consumption patterns, and carbon dioxide emissions (CO2)
Pachauri (2004) conducted a study in developing countries to analyze the impact of household consumption on CO2 by using the survey data of 1993–1994, and the results revealed that household energy use is affected by demographic, socioeconomic, geographic, and family factors, while income and expenditures have the highest impact. A study by Alfredsson (2004) revealed that green consumption could reduce energy use and CO2 emissions globally. Bin and Dowlatabadi (2005) analyzed the relationship between consumer/human activities, energy consumption, and CO2 emissions by using the consumer lifestyle approach (CLA) and showed that consumer behaviour and other economic activities are 80% of the source of energy use and CO2 emissions. Indirect use of consumer energy affects energy consumption and CO2 emissions twice. Lenzen et al. (2006) conducted a study from the global perspective to examine sustainable household energy use in the input-output analysis. The study results showed that the energy demands varied in different cultures and countries, and Kuznets Curve is not supported.
Rao and Reddy (2007) studied the changes in energy consumption in a developing country using micro-level data. Reddy and Srinivas (2009) examined the households’ energy consumption patterns in India and identified the factors. A study conducted by Rosas-Flores and Gálvez (2010) analyzed the energy consumption trends in Mexico and revealed its influencing factors, including cooling, heating, house built, and other household equipment and appliances. In their study, Shimoda et al. (2007) and Meyers et al. (2003) examined the relationship between household energy use and its effects. Income and region also impact energy consumption and CO2 with other factors (Reinders et al. 2003). Wei et al. (2007) examined the rural and urban households’ lifestyle impacts, which directly and indirectly impact energy consumption and CO2 emissions, using data from 1999 to 2002 in China.
Bin and Dowlatabadi (2005) examined the impacts of different lifestyles on energy use and CO2 emissions. They claimed that consumers use energy directly, such as living and travelling in order to fulfil their needs in residential places, such as cooling, heating, lighting, cooking, and other appliances, and indirectly fulfil their needs to buy and use products such as housing and travelling clothing, and food. Production requires huge energy, so consumers, directly and indirectly, use energy, impacting CO2 emissions.
Literature has also examined the CO2 emissions at national and regional levels with a production perspective (Mi et al. 2016) and also focused on different sectors in production, including the textile industry in China (Lin and Moubarak 2013); cement industry in China (Xu et al. 2012); transportation, construction, and production and electricity sectors in Taiwan (Tsai and Chang 2013); and 43 sectors in China (Yu et al. 2016). Despite all of these sectors, the major source of energy consumption and CO2 emissions is household consumption, households generate direct and indirect demands, and all the sectors work to fulfil these demands and becomes a source of CO2 emissions. Product transfer among the regions and countries is also the source of carbon emissions as in this way; it is difficult to identify the basic source of pollution if production-oriented methods are followed. Some organizations, such as IPCC, and scholars focus on using a consumption-oriented approach (L.-C. Liu et al. 2011). In all cultures, regions, and countries, the major source of CO2 emissions is households’ energy consumption and lifestyles.
Using the input-output model by Lyons et al. (2012), a study conducted in Ireland revealed that as household incomes increased, it indirectly increased their energy use, resulting in increased CO2 emissions. Duarte et al. (2010) conducted a study in which a positive association was found between household income and CO2 emissions in Spain. Chancel (2014) revealed that the top 10% of rich persons in USA and France of total population impact three times more on CO2 emissions than the 10% of the poor persons. Households with higher income levels in rural and urban areas of China impact 6.7 times and 3.8 times more on CO2 emissions than those with low income (L.-C. Liu et al. 2011).
In a study, Brizga et al. (2017) analyzed the growth of CO2 emissions from household consumption from 1995 to 2011 in Baltic States. Weber and Perrels (2000) conducted a study in France, West Germany, and the Netherlands to examine how households’ direct and indirect energy demands impact CO2 emissions. Wier et al. (2001) examined the impacts of household consumption patterns on CO2 emissions in Denmark. Dai et al. (2012) examined the impacts of households consumption patterns on the energy demands and CO2 emissions in China. Literature has examined the numerous factors influencing the CO2 emissions from direct and indirect energy use by households (Das and Paul 2014; Han et al. 2015), including income (Lyons et al. 2012), household size (Jones and Kammen 2014), household members age (Murray and Mills 2011), household location (Jones and Kammen 2014), and eduction (Büchs and Schnepf 2013).
Numerous studies have examined the relationship between urbanization, growth, energy consumption, and CO2 emissions. Li et al. (2011); Y. Liu (2009); Y. Liu and Xie (2013); C. Zhang and Lin (2012); Wang et al. (2013a, 2013b); Wang et al. (2013a); and Parshall et al. (2010) in their studies in USA and China identified the growth and urbanization as the major influence on energy consumption. Different research studies were conducted in different regions, in newly developed industrialized countries by Hossain (2011), in 208 counties including developed and developing by Jorgenson (2003), in Tunisia by Shahbaz and Lean (2012), and in the USA by Clement and Schultz (2011). Donglan et al. (2010) examined that CO2 emissions were increased by income and energy consumption in urban areas of China. Poumanyvong and Kaneko (2010) conducted a study on developed and developing countries and revealed that CO2 emissions are increased by development and urbanization. Urbanization negatively affects developing countries while it has high impacts in developed countries.
Poumanyvong et al. (2012) found that development and urbanization increase energy consumption in transport and the impact is higher in the countries with higher income levels. In his study, Al-Mulali et al. (2012) found that in the 80% of investigated countries, there is a strong relationship between development, energy consumption, and CO2 emissions and the development level of each country impacts this relationship. O'Neill et al. (2012) revealed that the higher economic growth in China and the labour supply had affected energy consumption and CO2 emissions. Zhu et al. (2012) studied 20 developing countries and found an inverted U-shaped relationship between development, urbanization, and CO2 emissions.
There are also studies available in the literature that have been examined and estimated the impacts of household lifestyles on the present and future energy demands. Pachauri (2007) conducted a study to examine India’s energy consumption and energy systems by using the socioeconomic approach from the perspectives of households and identified the most critical factors of non-commercial energy sources such as biofuels and diverse use of energy by households depending on the well-being and their lifestyles. Feng et al. (2011) used the grey model in China to compare the households with different lifestyles to examine the relationships between energy consumption, expenditures, and CO2 emissions, and revealed that for urban households, the use of direct energy is diverse, while in rural areas, households use energy in a simple way. In urban areas, direct energy use and CO2 emissions are increasing rapidly as compare to rural areas. There is greater impact of indirect energy consumption and CO2 emissions that direct use in the urban households.
In the newly developed countries with industry growth, energy consumption has increased CO2 emissions since the 1990s (Kasman and Duman 2015). Due to different cultural factors in different regions, the energy consumption impact on climate change might be reduced or increased as the cultural values are fixed, and changes occur gradually. The individual and group behaviours towards conflicts, self-conception, authority, and how they deal with all of them are determined by cultural values (Inkeles 1997). This is the reason for the significance of cultural values on the impact of the environment (De Mooij and Hofstede 2010; Onel and Mukherjee 2014). Panayotou (1997) explained that EKC could be smoothed for CO2 emissions by implementing institutional factors, including applying the laws and contracts and security of property rights throughout the countries.
Traditionally, economic performance is positively associated with environmental degradation, but according to the environmental Kuznets curve (EKC), a different relationship between economic growth and environmental quality, especially in the previous two decades. Environmental Kuznets curve (EKC) establishes a U-shaped hypothesis between economic growth and environmental pollution (Disli et al. 2016). At the initial development stages, greenhouse gasses increase as growth increases, and ultimately, it causes climate change and global warming. Once a country reaches a certain development level, it focuses on environmentally friendly technology, and consumers’ awareness of environmental quality decreases the greenhouse gasses (Aslanidis 2010; Dinda 2004).
Multiple factors affect the global climate, but the energy consumption is the one that affects most. Energy consumption has been the major source of CO2 emissions since 1990s (Kasman and Duman 2015). But the effect of energy consumption on CO2 emissions can be increased or decreased by cultural values, which takes too long to change. Cultural values shape groups’ and individuals’ behaviours in relation to self-conception, authority, and other conflicts and the way they deal with those conflicts and problems (Inkeles 2017). It focuses on the importance of cultural values in the environmental consequences (De Mooij and Hofstede 2010; Onel and Mukherjee 2014).
During the initial stages of economic development, environmental problems arise, which are the major complication for developing countries (Disli et al. 2016). The early development of the economy caused pollution as the major priority is economic growth, and individuals in the societies are more concerned with jobs and income than clean water, air, and environment (Dasgupta et al. 2002). The initial level of economic growth and energy consumption puts pressure on the environment, and pollution rises as people are more concerned about fulfilling their basic needs by buying and consuming cheap products without knowing the environmental influences of the growth (Kohler 2013). As the economic crisis and income of the individuals also rises, they start valuing their environment as they have fulfilled their basic needs, and now they are more concerned with using those products which are environment friendly with the developments of institutional regulations, and in result, the demissions declined (Kohler 2013).
It is needed to identify if culture affects the EKC. This paper identifies the cultural dimensions that moderates EKC movement (at the same level of economic growth, the CO2 emissions are higher) and which dimensions move the EKC downward (at the same level of economic growth, the CO2 emissions are lower). Cultural values may also shift the consumption pattern of the people to the left or right of the EKC in response to the EKC maximum level, where CO2 emissions start to decrease as the income of people increases, and they shift towards more hygienic and quality consumption. Further, this study will control the EKC model using important factors defining its context. Sultan et al. (2021) and Wang et al. (2022) pointed out that renewable energy consumption is an important factor in determining the rate at which economic activity will generate CO2 emissions. Similarly, population density explores the intensity of economic activity and its footprint (Ali et al. 2022).
Hypothesis development
Natural culture is the dominating factor that shapes individuals’ and groups’ collaborations and interactions. Culture comprises norms, values, and beliefs, which shapes human interactions as a strong informal institution (Hofstede 2016; Onel and Mukherjee 2014). All cultural dimensions have been studied with their influence on the EKC separately below:
High vs low power distance
Power distance is the degree of inequality of power distribution in a country or an organization and the acceptance degree of this unequal power distribution by the individuals of a country or by the members of the organization (Hofstede 2001; Kirkman et al. 2006). Countries in which there is higher power distance have undemocratic structures of decision making, formal rules and regulations, and authority concentration. Hofstede (2001) identified similarities between high power distance and authoritarianism. In an authoritative or paternalism system, the authoritative persons benefit the people or their subordinates who are loyal to them.
In high power distance countries, decisions are made based on the balance of loyalty and favours instead of people’s interests and benefits (Hofstede 2001; Husted 2005). High power distance also sacrifices their ethics for the sake of their convenience (Blodgett et al. 2001; Christie et al. 2003; Husted 1999, 2005; Swaidan and Hayes 2005; Vitell et al. 2003). Metz (1991) described the deforestation program in Nepal, stating that higher power distance can impede the program’s performance because the bureaucrats, when they implement a program, focus more on the sponsors of the programs than they should focus on the technical competencies and job performance.
Based on the literature, we argue that countries with high power distance follow a hierarchical system where decisions are made at top level of hierarchy, and lower staff who execute those decisions are not involved in the decision making. Society has a low intervention to feed policy decisions. For instance, in dictatorship and low-income countries, people are solely dependent on government policy framework, which ideally fulfil or addresses the needs of some group of people. So high power distance on the one hand does not allow them to make their contribution; on the other hand, they are alienated from the overall production processes of the countries (Hofstede 1984a). When citizens of a country are not involved in decisions, their input is not required, their needs are not identified as what quality products they require from the manufacturing organizations, then the organizations produce the products they consider of higher sales and lower cost. Organizations in a country focus on their profitability more than the production quality or the environmental performance, and they overlook the consumption patterns of the individuals as they do not seek their inputs. In such countries, CO2 emissions are higher. So, on the basis of this argument, we develop a hypothesis that:
H1: Consumption patterns in low-income countries will increase CO2 emissions and shift CO2 EKC upward with the interaction of high power distance.
Individualism vs collectivism
Individualism vs collectivism presents the relationship type of the individuals and the groups to which they belong or are more fit (Hofstede 2001). West values are based upon individualism followed by utilitarianism, the culture followed by the developed countries gradually transfers towards the developing countries. The societies or cultures with individualistic approaches provide forums for self-development, creativity, and responsibility as compared to collectivist cultures or societies. They focus more on group consensus, harmony, and cohesiveness. The societies where collectivism is more appreciated and individualism are low, in such societies, critical attitudes and creativity are discouraged, which limits the initial behaviour of the individuals (Husted 2005).
Environmental protection is very low in low individualist societies as individuals are not supported for critical initiatives. Environmental initiatives are more appreciated in societies with an individualistic approach (Dobson 1990; Scholtens and Dam 2007; Vogel. 1987). In collectivist societies, the collectivists favour in-groups at the unethical cost of out-groups and flourishing corruption (Davis and Ruhe 2003; Husted 1999, 2000; H. Park 2003; Swaidan and Hayes 2005).
We argue that the citizens are more creative and quality conscious (Nayeem and Casidy 2012). Individualistic societies strictly follow the rules and regulations independent of individuals’ influence, called utilitarianism. Rule of law obeyed in countries restrict organizations to take control measures in their production processes to produce environmentally friendly products. This creates a culture that will legitimize purchasing only eco-friendly products. In low-income or high-income societies, people will be bound to purchase those products. In low-income countries, the government provides subsidiaries to consume quality products. When individuals are creative and have the freedom to execute their creative ideas, they will work more for environmental protection, and their consumption pattern will also be quality-oriented as they will find ways to use the energy in more innovative manners. So, on the basis of this argument, we develop a hypothesis that:
H2: A higher individualism in a country will decrease CO2 emissions and shift its CO2 EKC downward.
High vs low uncertainty avoidance
Uncertainty avoidance is a society’s tolerance for ambiguous and uncertain situations (Hofstede 2001). It describes the degree of tolerating and coping with ambiguous and uncertain situations by the members of society. The societies with uncertainty avoiding behaviour are more emotional; they do not accept change and are more careful about uncertain difficulties and problems. Opposite to that, societies with low uncertainty avoidance force their people to accept and tolerate uncertain things. Societies with a higher level of uncertainty avoidance develop proper structure, policies, and regulations to cope with uncertain environmental problems (Parboteeah et al. 2005).
Due to the increasing global warming, environmental changes are challenging, and higher uncertainty avoidance societies are very proactive in improving environmental performance (Disli et al. 2016). We argue that in higher uncertainty avoidance societies, the citizens are more conscious about their energy consumption as they have no intentions of risk taking by harming their environmental quality. So, the consumption pattern of the individuals is shaped in such a way that they do not compromise on quality products, and thus, the organizations in such countries or societies produce high-quality products and develop their manufacturing systems in such a way that does not harm the environment and produce emissions. So, based on this argument, we develop a hypothesis that:
H3: A higher level of uncertainty avoidance in a country will decrease CO2 emissions and shift its CO2 EKC downward.
Masculinity vs femininity
The dimension of masculinity versus femininity asserts how society values masculinity or femininity. If a society has masculinity-oriented, society is supposed to be material-focused as the values of masculinity are tough, emphatic, and materialistic, while the values of femininity are affectionate, uncertain, and the focus is on life quality (Hofstede 2001). Masculinity focuses more on economic development, wealth, and materialistic growth, and their focus is not the environmental quality (Hofstede 2001; Husted 2005). Opposite to this, the focus of feminist societies is the clean environment, social well-being, and these societies are more responsible for their social role (Eisler et al. 2003).
Feminist societies are also more concerned with environmental issues (Eisler and Eisler 1994; Fraisse 1967). As opposed to the male society, females are more concerned about environmental quality, environmental protection, and have a positive attitude towards nature (Disli et al. 2016). In masculine societies, as to achieve more economic growth, these societies and organizations in such societies focus on producing and manufacturing the goods without their concern with environmental quality. As masculine societies are male-driven and are more concerned with economic growth (Hofstede et al. 1998), then, the consumption behaviour of these societies is also concerned with consuming more energy to avail more economic growth and development without concern with environmental protection. So, on the basis of this argument, we develop a hypothesis that:
H4: A higher level of masculinity in a country will increase CO2 emissions and shift its CO2 EKC upward.
Long-term vs short-term orientation
Long-term orientation is the degree to which the members of a society have thought for the long-term future. Societies with long-term orientation are more concerned with economic growth and environmental quality, while those with short-term orientation value more to their social traditions (Hofstede 2001). As opposite to short-term oriented societies, goals, plans, and strategies are developed for the long-term benefits of the societies. Short-term oriented cultures pay little emphasis on the long-term effects of their current plans and decisions, while long-term oriented cultures sacrifice their current benefits for the sake of their long-term future objectives (Laibson 1997).
The consumption pattern of societies is also affected by the long-term and short-term orientations of the culture. As in short-term oriented societies, people consume more energy to fulfil their current needs and demands at the cost of their environmental quality. At the same time, societies with long-term orientation consume energy and other facilities by keeping in mind their future needs and environmental quality. So, based on this argument, we develop a hypothesis that:
H5: A higher level of long-term orientation in a country will decrease CO2 emissions and shift its CO2 EKC downward.
Indulgence vs restraint
Indulgence refers to societies that allow free gratification of natural life for humans, whereas restraint societies control such gratification, so the individuals are restricted to enjoy their lives (Hofstede et al. 2010). Indulgent societies prefer humans to enjoy their lives and spend their money, while restraint societies regulate humans to live their lives. As in indulgence societies, humans are free to spend and live their lives; then, it is expected that they will harm the environment and spend more money on luxurious and wasteful lifestyles, which in return negatively affects the environment and fosters pollution, while in the restraint societies, the norms, values, regulations, and controlled behaviour will reduce pollution (Disli et al. 2016).
Societies with controlled behaviours tend to be more regulated in their consumption, and thus, energy can be consumed responsibly. While in indulgence societies, people are free to consume resources to fulfil their desires to enjoy their lives. So, on the basis of this argument, we develop a hypothesis that:
H6: A higher level of indulgence in a country will increase CO2 emissions and shift its CO2 EKC upward.
Previous studies have explored the EKC model with different parameters. This study adopts the EKC for consumption sustainability and explores demand-led EKC dynamics changes in different cultural contexts. This study will be instrumental in identifying cultural characteristics which promote consumption sustainability at the macroeconomic level.
Methods
Variables
Following Table 1 reports the variables which are selected for this study. The data will be collected for 49 countries ranging from 2008 to 2018. Here, variables like LCO2P, LGNI, LREN, and LPD are selected from world development indicators to form the EKC model of demand and control variables, while 6 time-invariant indicators of culture are used as a moderator of the EKC model.
Table 1.
Variables and data sources
| Symbol | Definition and Transformation | Source |
|---|---|---|
| LCO2P | Log of CO2 emissions per capita | WDI (2021) |
| LGNI | Log of gross national income per capita | WDI (2021) |
| PDI | Power distance index. A higher index indicates that hierarchy is established and executed in society, without doubt or reason. A lower degree of the index signifies that people question authority and attempt to distribute power | Insights (2022) |
| IDV | Individualism vs collectivism. A higher number shows a degree of collectivism in which society is integrated. | Insights (2022) |
| MAS | Masculinity vs femininity. A higher degree means society prefers achievement, heroism, assertiveness, and material rewards for success. | Insights (2022) |
| UAI | Uncertainty avoidance. A lower degree means that society is tolerant of ambiguous outcomes. | Insights (2022) |
| LTOWVS | Long-term vs short-term orientation. A lower index indicates that traditions are honoured and kept, while steadfastness is valued. Societies with a high degree in this index (long-term) view adaptation and circumstantial, pragmatic problem-solving as a necessity. | Insights (2022) |
| IVR | Indulgence v restraint. This dimension is essentially a measure of happiness, whether or not simple joys are fulfilled. Indulgence is defined as “a society that allows relatively free gratification of basic and natural human desires related to enjoying life and having fun.” Its counterpart is defined as “a society that controls gratification of needs and regulates it using strict social norms.” Indulgent societies believe themselves to control their own life and emotions; restrained societies believe other factors dictate their lives and emotions. | Insights (2022) |
| LREN | Log of renewable energy consumption as a percent of total energy consumption | WDI (2021) |
| LPD | Log of population density | WDI (2021) |
Theoretical model
Empirically, many studies have confirmed the environmental Kuznets curve (EKC) relationship using different environmental quality and economic activity proxies like GDP per capita, industrial value added, and fossil energy utilization. The main idea behind the EKC of demand is that buyers focus on fulfilling their necessities at low levels of demand and income, with lower priorities on the posterity and sustainability of the production processes from which the product is delivered. Thus, market forces do not compel sellers to opt for production methods that are sustainable (α2 in equation below). While at higher demand levels, buyers go to a higher order of Maslow’s hierarchy of needs to avail themselves of luxuries that are sensitive to the environment (Arshed et al. 2021; Hassan et al. 2020; Wang et al. 2021). This country needs a certain level of income/consumption beyond which demand forces will compel sellers to adopt clean production methods (α3 in equation below). This point is the turning point in the EKC curve. There is a dearth of studies in literature that has focused on the determinants of this turning point; thus, the means to intervene cleaner environment via EKC is underexplored.
This study proposes that the country’s national culture can moderate the turning point in the inverted U–shaped EKC relationship. As pointed out in the hypothesis development, each characteristic of the national culture plays its distinct role in the way consumers/buyers behave when their incomes increase. Cultures like masculinity, risk taking, and long-term orientation define the buyers’ purchase patterns differently from what is discussed in standard EKC-based studies.
The assessment of this model is done using the following equation which alternative instruments are added for national culture to form new equations. Here, the indicators of culture are multiplied by LGNI and LGNI2, where the first cross-product explains the way culture changes the CO2 increasing consumption patterns (α5), and the second cross-product explains the way culture changes the CO2 decreasing consumption patterns (α6).
| 1 |
Haans et al. (2016) provided the framework to estimate the moderation of quadratic relationships and the (Dawson 2014) algorithm to visualize the moderating effect of culture on the EKC quadratic curve.
Estimation model
Since the data varies across cross-sections and periods, and there is a mixture of time-variant and time-invariant variables, this study has opted to use the panel feasible generalized least square (FGLS) model, which will allow the standard errors of the estimates to vary across cross-sections. These heterogeneous standard errors can then be used to make the model robust to any present heteroskedasticity and autocorrelation. Hameed et al. (2021) used this FGLS model to account for similar characteristics in the data. Further, since the years per country are less than 20, this study has not used the dynamic panel data models and assumed that variables are stationary across time (Arshed et al. 2018).
Results and discussions
Descriptive statistics
Table 2 firstly reports the descriptive. Other than the CO2 emissions, all the variables have a mean value higher than the standard deviation, confirming that these variables are underdispersed across the sample. Further, since the dependent variable is overdispersed, this calls for the use of a panel data model, which controls for the cross-sectional and time-series differences of the data.
Table 2.
Descriptives and associations
| Variables | Descriptives | Correlations | |||||||||||
|---|---|---|---|---|---|---|---|---|---|---|---|---|---|
| Obs | Mean | Std. dev. | LCO2P | LGNI | PDI | IDV | MAS | UAI | LTOWVS | IVR | LPD | LREN | |
| LCO2P | 583 | 0.827 | 1.53 | 1.00 | |||||||||
| LGNI | 583 | 25.00 | 2.01 | 0.559 | 1.00 | ||||||||
| PDI | 583 | 56.75 | 21.52 | −0.455 | −0.032 | 1.00 | |||||||
| IDV | 583 | 44.36 | 23.14 | 0.518 | 0.269 | −0.636 | 1.00 | ||||||
| MAS | 583 | 46.77 | 19.78 | 0.013 | 0.295 | 0.095 | 0.008 | 1.00 | |||||
| UAI | 583 | 69.55 | 23.41 | −0.128 | −0.082 | 0.252 | −0.224 | 0.057 | 1.00 | ||||
| LTOWVS | 583 | 44.65 | 21.49 | 0.344 | 0.102 | −0.114 | 0.315 | −0.015 | −0.023 | 1.00 | |||
| IVR | 583 | 46.60 | 21.72 | 0.193 | 0.253 | −0.255 | 0.101 | 0.060 | −0.128 | −0.480 | 1.00 | ||
| LPD | 583 | 4.287 | 1.436 | −0.002 | 0.121 | 0.192 | −0.189 | 0.252 | −0.116 | 0.247 | −0.053 | 1.00 | |
| LREN | 583 | 2.794 | 1.639 | −0.645 | −0.353 | 0.020 | −0.080 | −0.305 | 0.145 | −0.042 | −0.127 | −0.157 | 1.00 |
The Pearson correlations show that LGNI, IDV, LTWVS, and IVR are positively correlated with the LCO2P, while PDI, MAS, and UAI are negatively correlated. Since the correlations of other pairs are less than 0.9, the models do not contain any hint of multicollinearity.
Graphical associations
Figure 1, 2, 3, 4, 5, 6 provides the graphical association between CO2 emissions and indicators of national culture. Here, we can see that the increase in PDI and uncertainty avoidance negatively correlates with CO2 emissions, while collectivism, term orientation, and indulgence have a positive association. At the same time, masculinity has no apparent association with CO2.
Fig. 1.
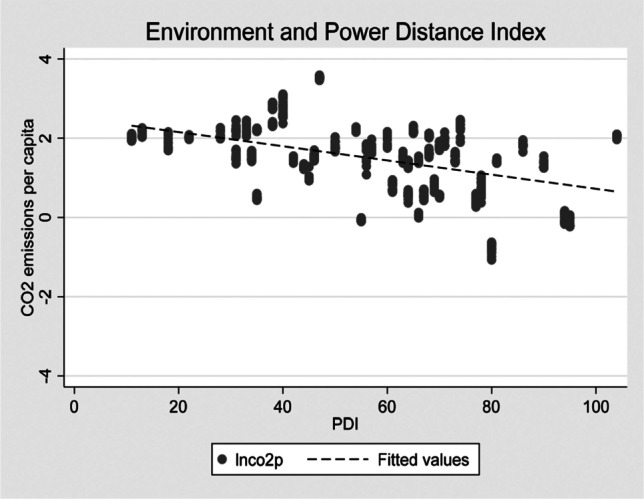
CO2 and power distance association
Fig. 2.
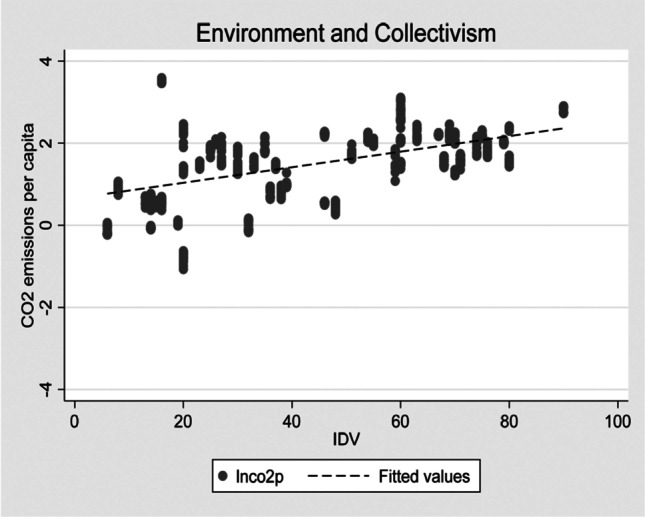
CO2 and collectivism association
Fig. 3.
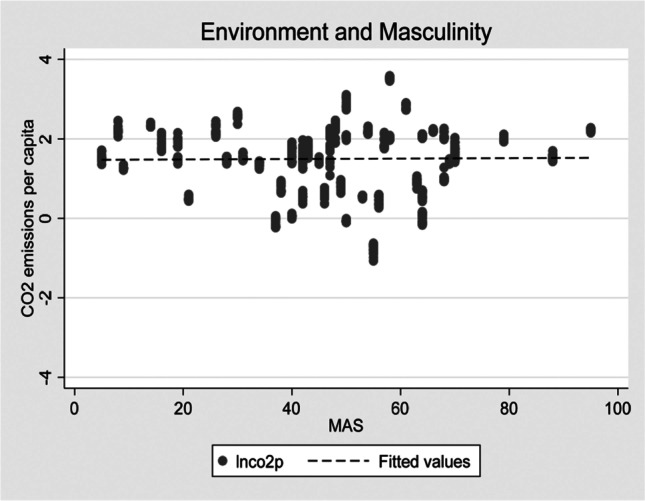
CO2 and masculinity association
Fig. 4.

CO2 and uncertainty avoidance association
Fig. 5.

CO2 and time orientation association
Fig. 6.
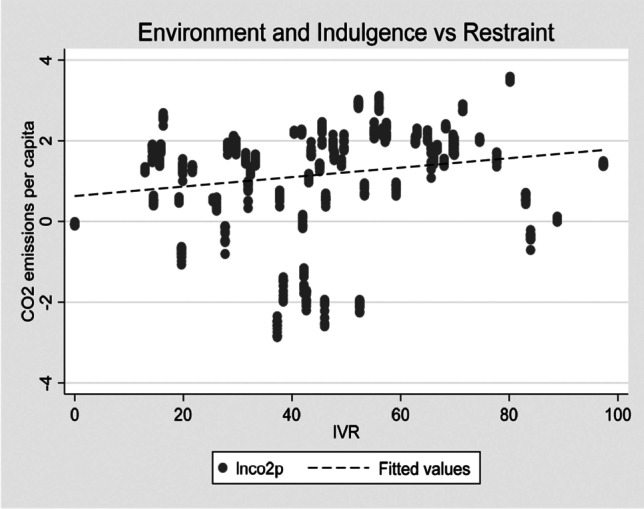
CO2 and indulgence association
Regression estimates
Table 3 reports the regression estimates using the panel FGLS model. For all models, the data of 49 countries are assessed, and the total sample size is 408 observations. The Wald test value is significant, which shows that the overall model is fit in determining the changes in the CO2 emissions (LCO2P).
Table 3.
Regression estimates panel FGLS model
| Dep. var = LCO2P | ||||||
|---|---|---|---|---|---|---|
| Model | PDI | IDV | MAS | UAI | LTWVS | IVR |
| Variables | Coef (Prob) | Coef (Prob) | Coef (Prob) | Coef (Prob) | Coef (Prob) | Coef (Prob) |
| LGNI | −1.925 (0.00)*** | −0.278 (0.65) | 4.621 (0.00)*** | 1.666 (0.51) | 9.712 (0.00)*** | −4.216 (0.00)*** |
| LGNI2 | 0.040 (0.00)*** | 0.006 (0.63) | −0.087 (0.00)*** | −0.018 (0.71) | −0.180 (0.00)*** | 0.086 (0.00)*** |
| LREN | −0.616 (0.00)*** | −0.577 (0.00)*** | −0.724 (0.00)*** | −0.221 (0.00)*** | −0.309 (0.00)*** | −0.355 (0.00)*** |
| LPD | −0.252 (0.00)*** | −0.230 (0.00)*** | −0.324 (0.00)*** | −0.876 (0.00)*** | −0.178 (0.00)*** | −0.083 (0.00)*** |
| CUL | −0.581 (0.00)*** | −0.364 (0.03)** | 1.017 (0.00)*** | 0.849 (0.07)* | 1.424 (0.00)*** | −2.061 (0.00)*** |
| LGNI*CUL | 0.045 (0.00)*** | 0.029 (0.02)** | −0.079 (0.00)*** | −0.059 (0.09)* | −0.104 (0.00)*** | 0.160 (0.00)*** |
| LGNI2*CUL | −0.001 (0.00)*** | −0.001 (0.02)** | 0.001 (0.00)*** | 0.001 (0.11) | 0.002 (0.00)*** | −0.003 (0.00)*** |
| Const | 28.204 (0.00)*** | 6.376 (0.49) | −55.71 (0.00)*** | −29.38 (0.38) | −128.1 (0.00)*** | 53.73 (0.00)*** |
| Statistics | ||||||
| Cutoff Value at CUL = 0 | 24.06 | 23.17 | 26.56 | 46.28 | 26.97 | 24.51 |
| Wald (prob) | 8045.5 (0.00)*** | 5651.6 (0.00)*** | 4276.4 (0.00)*** | 3875 (0.00)*** | 2710 (0.00)*** | 3240 (0.00)*** |
| Sample | 408 | 408 | 408 | 408 | 408 | 408 |
| Countries | 49 | 49 | 49 | 49 | 49 | 49 |
***Significant at 1%, **significant at 5%, *significant at 10%
There are 6 models estimated for demand EKC with quadratic moderation of culture index. The correlation values confirmed the absence of multicollinearity, and the model is robust to the presence of heteroskedasticity and autocorrelation. For all models, the effect of controlling factors LREN and LPD are negative and significant, showing that an increase in renewable energy consumption and population density tends to reduce the CO2 emissions by the nation.
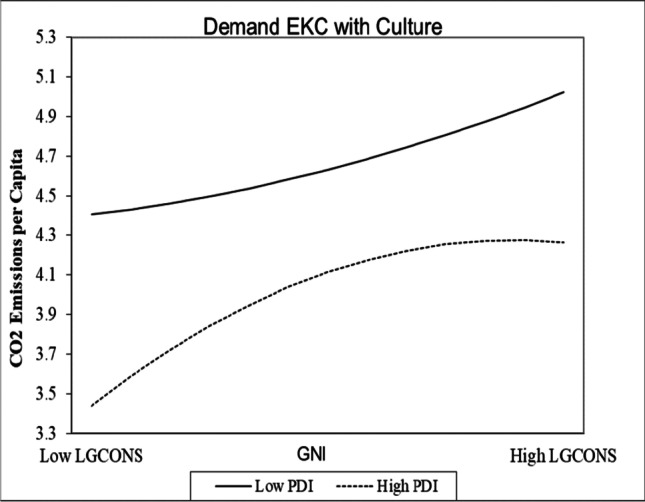
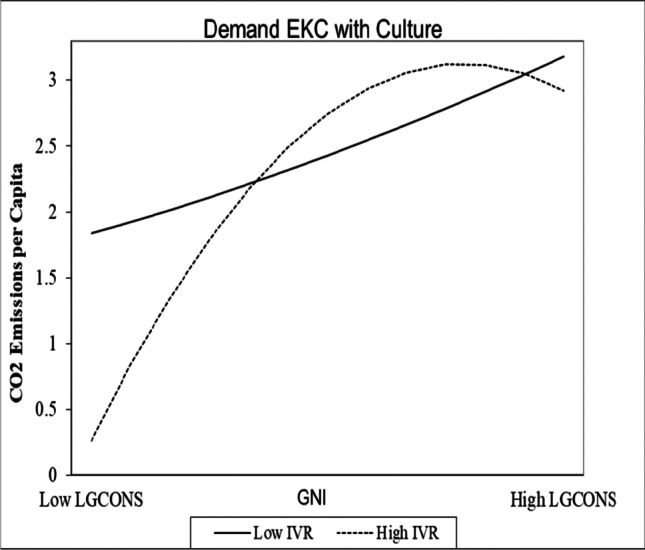
For the case of national cultural indicators of PDI, IDV, and IVR, the level coefficient of LGNI is negative, and the coefficient of LGNI2 is positive, showing the presence of U-shaped EKC. In this case, controlling these specific cultural types requires that the nation’s income be less than a particular level (threshold provided in Table 3) so that the consumption patterns do not lead to CO2 emissions.
For the above discussed models, the individual coefficients of PDI, IDV, and IVR had a significant negative effect on the CO2 emissions. Here, the coefficient of the product of culture indicator and LGNI is positive, while the coefficient of the product of culture indicator and LGNI squared is negative, which shows the flipping of the EKC curve, whereby initially, it was U-shaped but with the interaction of culture index; it is moving towards inverted U–shaped relation. This means economies with high PDI, IDV, and IVR will experience sustainable consumption with increased consumption size. In Figs 7, 8, and 12, the solid lines show the incidence of U-shaped demand EKC at low interaction. And the dotted lines are new EKC curves (inverted U-shaped) at high levels of culture.
Fig. 7.
EKC with power distance plot
Fig. 8.

EKC with collectivism plot
Fig. 12.
EKC with indulgence plot
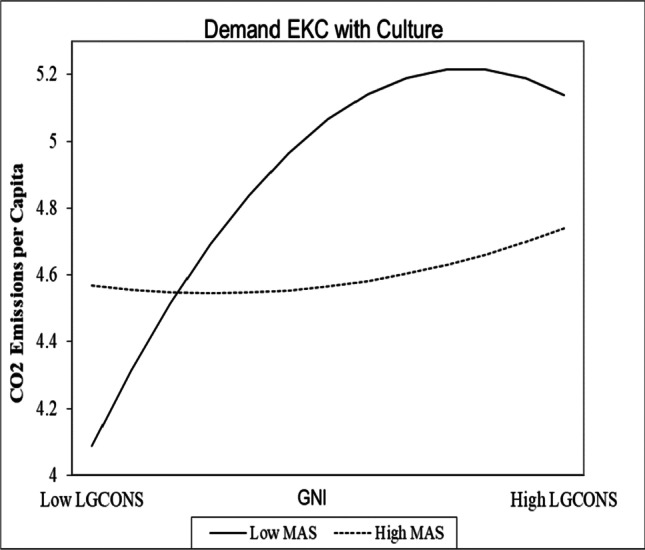
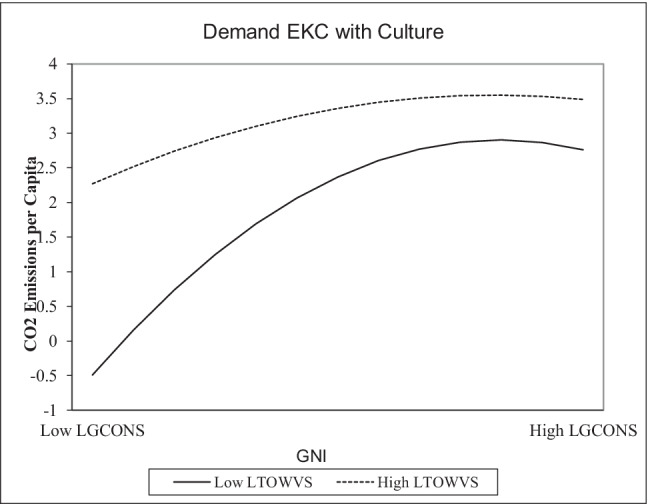
While for the case of MAS, UAI, and LTWVS, the level coefficient of LGNI is positive, and the coefficient of LGNI2 is negative, showing the presence of an inverted U–shaped EKC relationship. In this case, the controlling cultural types allow the nation’s income to grow beyond a certain threshold, which will benefit the environment.
The coefficients of MAS, UAI, and LTWVS significantly affect CO2 emissions for the above discussed models. Here, the coefficient of a product of culture indicator and LGNI is negative, while the coefficient of a product of culture indicator and LGNI squared is positive, which shows the flipping of the EKC curve, whereby initially, it was inverted U–shaped but with the interaction of culture index; it is moving towards U-shaped relation. In Figs 9, 10, and 11, the solid lines show the incidence of inverted U–shaped demand EKC at low interaction, and the dotted lines are new EKC curves at high culture levels. This shows that an increase in MAS, UAI, and LTWVS requires restraint in consumption behaviour to achieve sustainability just like IVR in (Fig. 12) so that it can help in reducing CO2 emissions associated with consumption behavior.
Fig. 9.
EKC with masculinity plot
Fig. 10.

EKC with uncertainty avoidance plot
Fig. 11.
EKC with time orientation plot
Conclusion and discussion
This study tested the interaction of 6 dimensions of the Hofstede National Culture Index on demand-based EKC relationships. The idea behind this is that culture defines the way people set their consumption patterns with respect to their effect on environmental quality. Here, there are two different effects of the culture index. The first set of culture indicators could flip the U-shaped demand EKC to inverted U–shaped demand EKC. This includes indicators of PDI, IDV, and IVR. Here, the increase in PDI shows an increase in the hierarchy, an increase in IDV shows an increase in collectivism, and an increase in IVR shows an increase in the belief of having control over their own life.
These characteristics help the nation transform its consumption patterns towards environment neutral or environment friendly. People tend to believe in a collective effort toward ensuring a better future for themselves where they have better control of their lives. Hence, we experience the inverted U–shaped EKC, whereby they can greenify their consumption patterns because of the influence of the culture.
While the second set could flip the inverted U-shaped demand EKC to U-shaped demand EKC, including MAS, UAI, and LTWVS. Here, the increase in MAS shows an increase in society’s preference for achievement, heroism, assertiveness, and material rewards. An increase in UAI shows an increase in intolerance towards uncertainties and an increase in LTOWVS in long-term orientation of society that values pragmatic problem-solving.
These characteristics help the nation push its consumption patterns towards deteriorating the environment. The materialistic goals and intolerance to the uncertainties tend to limit the environment friendly capacity of the consumption patterns. Policymakers can use the outcomes in developing an appropriate culture in the country which can help transformation towards sustainable consumption. Businesses can develop green key performance indicators to achieve national sustainability goals. Future studies can work on proposing measures that can help develop a clean environment based on the country's national culture.
Acknowledgments
Availability of data and material
The sources of data are mentioned in Table 1.
Code availability
Not applicable.
Appendix. List of countries in sample
| Australia | Hungary | Pakistan |
|---|---|---|
| Austria | India | Peru |
| Bangladesh | Indonesia | Philippines |
| Belgium | Ireland | Poland |
| Bulgaria | Israel | Portugal |
| Chile | Italy | Romania |
| Colombia | Jamaica | Serbia |
| Costa Rica | Japan | Singapore |
| Croatia | Latvia | Slovenia |
| Denmark | Lithuania | Spain |
| Ecuador | Luxembourg | Sweden |
| El Salvador | Malaysia | Thailand |
| Estonia | Malta | Turkey |
| Finland | Mexico | |
| France | Morocco | |
| Germany | Netherlands | |
| Greece | New Zealand | |
| Guatemala | Norway |
Author contribution
All authors (Noman Arshed, Kamran Hameed, Asma Saher, and Naveed Yazdani) have equally contributed to developing this research manuscript.
Declarations
Ethics approval
Not applicable
Consent to participate
No consent is required as the study is based on secondary public data.
Consent for publication
Authors provide their consent to publish the manuscript.
Conflict of interest
Not applicable
Footnotes
Publisher’s note
Springer Nature remains neutral with regard to jurisdictional claims in published maps and institutional affiliations.
Contributor Information
Noman Arshed, Email: noman.arshed@ue.edu.pk.
Kamran Hameed, Email: kamran.hameed@umt.edu.pk.
Asma Saher, Email: asma.saher@umt.edu.pk.
Naveed Yazdani, Email: yazdani@umt.edu.pk.
References
- Al-Mulali U, Sab CNBC, Fereidouni HG. Exploring the bi-directional long run relationship between urbanization, energy consumption, and carbon dioxide emission. Energy. 2012;46(1):156–167. doi: 10.1016/j.energy.2012.08.043. [DOI] [Google Scholar]
- Alfredsson EC. “Green” consumption—no solution for climate change. Energy. 2004;29(4):513–524. doi: 10.1016/j.energy.2003.10.013. [DOI] [Google Scholar]
- Ali UM, Gong Z, Ali MU, Asmi F. CO2 emissions, economic development, fossil fuel consumption and population density in India, Pakistan and Bangladesh: a panel investigation. Intl J Finance Econ. 2022;27(1):18–31. doi: 10.1002/ijfe.2134. [DOI] [Google Scholar]
- Ameyaw B, Yao L. Analyzing the impact of GDP on CO2 emissions and forecasting Africa’s total CO2 emissions with non-assumption driven bidirectional long short-term memory. Sustainability. 2018;10(9):3110. doi: 10.3390/su10093110. [DOI] [Google Scholar]
- Arshed N, Anwar A, Kousar N, Bukhari S. Education enrollment level and income inequality: a case of SAARC economies. Social Indicators Research. 2018;140(3):1211–1224. doi: 10.1007/s11205-017-1824-9. [DOI] [Google Scholar]
- Arshed N, Munir M, Iqbal M. Sustainability assessment using STIRPAT approach to environmental quality: an extended panel data analysis. Environ Sci Pollut Res. 2021;28(14):18163–18175. doi: 10.1007/s11356-020-12044-9. [DOI] [PubMed] [Google Scholar]
- Aslanidis, N. (2010). Environmental Kuznets curves for carbon emissions: a critical survey (d. In:MeijerJ, editors. Ed.). Hauppauge, NY: Nova Science Publishers; 2010.
- Aye GC, Edoja PE. Effect of economic growth on CO2 emission in developing countries: Evidence from a dynamic panel threshold model. Cogent Economics & Finance. 2017;5(1):1379239. doi: 10.1080/23322039.2017.1379239. [DOI] [Google Scholar]
- Bhattacharya H. Environmental and socio-economic sustainability in India: evidence from CO2 emission and economic inequality relationship. J Environ Econ Policy. 2020;9(1):57–76. doi: 10.1080/21606544.2019.1604267. [DOI] [Google Scholar]
- Bin S, Dowlatabadi H. Consumer lifestyle approach to US energy use and the related CO2 emissions. Energy policy. 2005;33(2):197–208. doi: 10.1016/S0301-4215(03)00210-6. [DOI] [Google Scholar]
- Blodgett JG, Lu L-C, Rose GM, Vitell SJ. Ethical sensitivity to stakeholder interests: a cross-cultural comparison. J Acad Market Sci. 2001;29(2):190–202. doi: 10.1177/03079459994551. [DOI] [Google Scholar]
- Brizga J, Feng K, Hubacek K. Household carbon footprints in the Baltic States: a global multi-regional input–output analysis from 1995 to 2011. Applied Energy. 2017;189:780–788. doi: 10.1016/j.apenergy.2016.01.102. [DOI] [Google Scholar]
- Büchs M, Schnepf SV. Who emits most? Associations between socio-economic factors and UK households’ home energy, transport, indirect and total CO2 emissions. Ecological Economics. 2013;90:114–123. doi: 10.1016/j.ecolecon.2013.03.007. [DOI] [Google Scholar]
- Chancel L. Are younger generations higher carbon emitters than their elders?: Inequalities, generations and CO2 emissions in France and in the USA. Ecol Econ. 2014;100:195–207. doi: 10.1016/j.ecolecon.2014.02.009. [DOI] [Google Scholar]
- Christie PMJ, Kwon I-WG, Stoeberl PA, Baumhart R. A cross-cultural comparison of ethical attitudes of business managers: India Korea and the United States. J Business Ethics. 2003;46(3):263–287. doi: 10.1023/A:1025501426590. [DOI] [Google Scholar]
- Clement, M. T., & Schultz, J. (2011). Political economy, ecological modernization, and energy use: a panel analysis of state-level energy use in the United States, 1960–1990. Paper presented at the Sociological Forum.
- Cohen C, Lenzen M, Schaeffer R. Energy requirements of households in Brazil. Energy policy. 2005;33(4):555–562. doi: 10.1016/j.enpol.2003.08.021. [DOI] [Google Scholar]
- Dai H, Masui T, Matsuoka Y, Fujimori S. The impacts of China’s household consumption expenditure patterns on energy demand and carbon emissions towards 2050. Energy policy. 2012;50:736–750. doi: 10.1016/j.enpol.2012.08.023. [DOI] [Google Scholar]
- Daly, H. (1996). Consumption: value added, physical transformation and welfare. In: Costanza, R., Segura, O., Martinez-Alier, J. (Eds.). Washington, DC: Island Press.
- Das A, Paul SK. CO2 emissions from household consumption in India between 1993–94 and 2006–07: a decomposition analysis. Energy Economics. 2014;41:90–105. doi: 10.1016/j.eneco.2013.10.019. [DOI] [Google Scholar]
- Dasgupta S, Laplante B, Wang H, Wheeler D. Confronting the environmental Kuznets curve. J Econ Pers. 2002;16(1):147–168. doi: 10.1257/0895330027157. [DOI] [Google Scholar]
- Davis JH, Ruhe JA. Perceptions of country corruption: antecedents and outcomes. J Business Ethics. 2003;43(4):275–288. doi: 10.1023/A:1023038901080. [DOI] [Google Scholar]
- Dawson JF. Moderation in management research: what, why, when and how. J Business Psychol. 2014;29:1–19. doi: 10.1007/s10869-013-9308-7. [DOI] [Google Scholar]
- De Mooij M, Hofstede G. The Hofstede model: applications to global branding and advertising strategy and research. Intl J Adv. 2010;29(1):85–110. doi: 10.2501/S026504870920104X. [DOI] [Google Scholar]
- Dinda S. Environmental Kuznets curve hypothesis: a survey. Ecol Econ. 2004;49(4):431–455. doi: 10.1016/j.ecolecon.2004.02.011. [DOI] [Google Scholar]
- Disli M, Ng A, Askari H. Culture, income, and CO2 emission. Renew Sustain Energy Rev. 2016;62:418–428. doi: 10.1016/j.rser.2016.04.053. [DOI] [Google Scholar]
- Dobson A. Green political thought. London: HarperCollins: Routledge; 1990. [Google Scholar]
- Donglan Z, Dequn Z, Peng Z. Driving forces of residential CO2 emissions in urban and rural China: an index decomposition analysis. Energy policy. 2010;38(7):3377–3383. doi: 10.1016/j.enpol.2010.02.011. [DOI] [Google Scholar]
- Duarte R, Mainar A, Sánchez-Chóliz J. The impact of household consumption patterns on emissions in Spain. Energy economics. 2010;32(1):176–185. doi: 10.1016/j.eneco.2009.08.007. [DOI] [Google Scholar]
- Duchin F. Structural economics: measuring change in technology, lifestyles, and the environment. Washington, DC.: Island Press; 1998. [Google Scholar]
- Eisler AD, Eisler H. Subjective time scaling: influence of age, gender, and Type A and Type B behavior. Chronobiologia. 1994;21(3-4):185–200. [PubMed] [Google Scholar]
- Eisler AD, Eisler H, Yoshida M. Perception of human ecology: cross-cultural and gender comparisons. Journal Psychol. 2003;23(1):89–101. [Google Scholar]
- Evans S (2020) Analysis: Coronavirus set to cause largest ever annual fall in CO2 emissions. Carbon Brief 9
- Feng Z-H, Zou L-L, Wei Y-M. The impact of household consumption on energy use and CO2 emissions in China. Energy. 2011;36(1):656–670. doi: 10.1016/j.energy.2010.09.049. [DOI] [Google Scholar]
- Fraisse P. Psychologie du temps (The psychology of time) 2. Paris: Presses universitaires de France; 1967. [Google Scholar]
- Gupta, M. D. (2011). Impact of lifestyle pattern on energy consumption and carbon emissions—a view from India. Paper presented at the Jordan International Energy Conference.
- Haans RF, Pieters C, He ZL. Thinking about U: theorizing and testing U-and inverted U-shaped relationships in strategy research. Strategic Manag J. 2016;37(7):1177–1195. doi: 10.1002/smj.2399. [DOI] [Google Scholar]
- Hameed K, Arshed N, Yazdani N, Munir M. Motivating business towards innovation: a panel data study using dynamic capability framework. Technol Soc. 2021;65:101581. doi: 10.1016/j.techsoc.2021.101581. [DOI] [Google Scholar]
- Han L, Xu X, Han L. Applying quantile regression and Shapley decomposition to analyzing the determinants of household embedded carbon emissions: evidence from urban China. Journal of Cleaner Production. 2015;103:219–230. doi: 10.1016/j.jclepro.2014.08.078. [DOI] [Google Scholar]
- Hassan MS, Meo MS, Abd Karim MZ, Arshed N. Prospects of environmental kuznets curve and green growth in developed and developing economies. Studies of Applied Economics. 2020;38(3):1–19. doi: 10.25115/eea.v38i3.3367. [DOI] [Google Scholar]
- He Z, Xu S, Shen W, Long R, Chen H. Impact of urbanization on energy related CO2 emission at different development levels: regional difference in China based on panel estimation. Journal of cleaner production. 2017;140:1719–1730. doi: 10.1016/j.jclepro.2016.08.155. [DOI] [Google Scholar]
- Hofstede G. The cultural relativity of the quality of life concept. Academy of Management review. 1984;9(3):389–398. doi: 10.2307/258280. [DOI] [Google Scholar]
- Hofstede, G. (1984b). National cultures and corporate cultures. Belmont,CA: Wadsworth.
- Hofstede G. Culture’s consequences: comparing values, behaviors, institutions and organizations across nations. 2. Beverly Hills: Sage publications; 2001. [Google Scholar]
- Hofstede G. Culture's consequences: comparing values, behaviors, institutions, and organizations across nations. Collegiate Aviation Review. 2016;34(2):108. [Google Scholar]
- Hofstede, G., Arrindell, W. A., Mooij, M. D., Hoppe, M. H., de Vliert, E. V., Van Rossum, J. H. A., . . . Williams, J. E. (1998). Masculinity and femininity: the taboo dimension of national cultures (Vol. 3): Sage.
- Hofstede, G., Hofstede, G. J., & Minkov, M. (2010). Cultures and organizations: software of the mind (3rd ed.): Mcgraw-hill New York.
- Hossain MS. Panel estimation for CO2 emissions, energy consumption, economic growth, trade openness and urbanization of newly industrialized countries. Energy policy. 2011;39(11):6991–6999. doi: 10.1016/j.enpol.2011.07.042. [DOI] [Google Scholar]
- Houghton JT, Jenkins GJ, Ephraums JJ. Climate change: the IPCC scientific assessment. Cambridge: Cambridge Univ. Press; 1990. [Google Scholar]
- Husted BW. Wealth, culture, and corruption. Journal of international business studies. 1999;30(2):339–359. doi: 10.1057/palgrave.jibs.8490073. [DOI] [Google Scholar]
- Husted BW. The impact of national culture on software piracy. Journal of Business Ethics. 2000;26(3):197–211. doi: 10.1023/A:1006250203828. [DOI] [Google Scholar]
- Husted, B. W. (2005). Culture and ecology: A cross-national study of the determinants of environmental sustainability. MIR: Management International Review, 349-371.
- Ibrahim MH, Law SH. Social capital and CO2 emission—output relations: a panel analysis. Renewable and Sustainable Energy Reviews. 2014;29:528–534. doi: 10.1016/j.rser.2013.08.076. [DOI] [Google Scholar]
- IEA. (2016a). CO2 Emissions from Fuel Combustion Highlights 2016. . Paris.
- IEA. (2016b). Energy Balances Statistics. http://www.iea.org/Sankey/index.html#?
- Ikram M, Zhang Q, Sroufe R, Shah SZA. Towards a sustainable environment: the nexus between ISO 14001, renewable energy consumption, access to electricity, agriculture and CO2 emissions in SAARC countries. Sustainable Production and Consumption. 2020;22:218–230. doi: 10.1016/j.spc.2020.03.011. [DOI] [Google Scholar]
- Inkeles A. National character: A psycho-social perspective. New Brun swick: Transaction Publishers; 1997. [Google Scholar]
- Inkeles A. National character: a psycho-social perspective. Routledge; 2017. [Google Scholar]
- Insights, H. (2022). The Dimensions National Culture. Retrieved 20 Feb., 2022, from https://hi.hofstede-insights.com/national-culture
- IPCC . Climate change: the IPCC response strategies. Island Press; 1991. [Google Scholar]
- IPCC. (2013). The 5th assessment report of the intergovernmental panel on climate change. In C. U. Press (Ed.).
- Jebli MB, Youssef SB, Ozturk I. Testing environmental Kuznets curve hypothesis: the role of renewable and non-renewable energy consumption and trade in OECD countries. Ecological Indicators. 2016;60:824–831. doi: 10.1016/j.ecolind.2015.08.031. [DOI] [Google Scholar]
- Jones C, Kammen DM. Spatial distribution of US household carbon footprints reveals suburbanization undermines greenhouse gas benefits of urban population density. Environmental science & technology. 2014;48(2):895–902. doi: 10.1021/es4034364. [DOI] [PubMed] [Google Scholar]
- Jorgenson AK. Consumption and environmental degradation: a cross-national analysis of the ecological footprint. Social Problems. 2003;50(3):374–394. doi: 10.1525/sp.2003.50.3.374. [DOI] [Google Scholar]
- Kasman A, Duman YS. CO2 emissions, economic growth, energy consumption, trade and urbanization in new EU member and candidate countries: a panel data analysis. Economic modelling. 2015;44:97–103. doi: 10.1016/j.econmod.2014.10.022. [DOI] [Google Scholar]
- Kirkman BL, Lowe KB, Gibson CB. A quarter century of culture’s consequences: a review of empirical research incorporating Hofstede's cultural values framework. Journal of international business studies. 2006;37(3):285–320. doi: 10.1057/palgrave.jibs.8400202. [DOI] [Google Scholar]
- Kohler M. CO2 emissions, energy consumption, income and foreign trade: A South African perspective. Energy policy. 2013;63:1042–1050. doi: 10.1016/j.enpol.2013.09.022. [DOI] [Google Scholar]
- Laibson D. Golden eggs and hyperbolic discounting. The Quarterly Journal of Economics. 1997;112(2):443–478. doi: 10.1162/003355397555253. [DOI] [Google Scholar]
- Lenzen M. Primary energy and greenhouse gases embodied in Australian final consumption: an input–output analysis. Energy policy. 1998;26(6):495–506. doi: 10.1016/S0301-4215(98)00012-3. [DOI] [Google Scholar]
- Lenzen M, Wier M, Cohen C, Hayami H, Pachauri S, Schaeffer R. A comparative multivariate analysis of household energy requirements in Australia, Brazil, Denmark, India and Japan. Energy. 2006;31(2-3):181–207. doi: 10.1016/j.energy.2005.01.009. [DOI] [Google Scholar]
- Li H, Mu H, Zhang M. Analysis of China’s energy consumption impact factors. Procedia Environmental Sciences. 2011;11:824–830. doi: 10.1016/j.proenv.2011.12.126. [DOI] [Google Scholar]
- Liang Q-M, Fan Y, Wei Y-M. Multi-regional input–output model for regional energy requirements and CO2 emissions in China. Energy policy. 2007;35(3):1685–1700. doi: 10.1016/j.enpol.2006.04.018. [DOI] [Google Scholar]
- Lin B, Moubarak M. Decomposition analysis: change of carbon dioxide emissions in the Chinese textile industry. Renewable and Sustainable Energy Reviews. 2013;26:389–396. doi: 10.1016/j.rser.2013.05.054. [DOI] [Google Scholar]
- Liu L-C, Wu G, Wang J-N, Wei Y-M. China’s carbon emissions from urban and rural households during 1992–2007. Journal of cleaner production. 2011;19(15):1754–1762. doi: 10.1016/j.jclepro.2011.06.011. [DOI] [Google Scholar]
- Liu Y. Exploring the relationship between urbanization and energy consumption in China using ARDL (autoregressive distributed lag) and FDM (factor decomposition model) Energy. 2009;34(11):1846–1854. doi: 10.1016/j.energy.2009.07.029. [DOI] [Google Scholar]
- Liu Y, Xie Y. Asymmetric adjustment of the dynamic relationship between energy intensity and urbanization in China. Energy economics. 2013;36:43–54. doi: 10.1016/j.eneco.2012.12.003. [DOI] [Google Scholar]
- Liu Z, Ciais P, Deng Z, Lei R, Davis SJ, Feng S, et al. Near-real-time monitoring of global CO 2 emissions reveals the effects of the COVID-19 pandemic. Nature communications. 2020;11(1):1–12. doi: 10.1038/s41467-020-20254-5. [DOI] [PMC free article] [PubMed] [Google Scholar]
- Lyons S, Pentecost A, Tol RS. Socioeconomic distribution of emissions and resource use in Ireland. Journal of environmental management. 2012;112:186–198. doi: 10.1016/j.jenvman.2012.07.019. [DOI] [PubMed] [Google Scholar]
- McKibbin W, Fernando R (2020) The global macroeconomic impacts of COVID-19: seven scenarios. Asian Economic Papers:1–55
- Mendonca AK d D, Barni GDAC, Moro MF, Bornia AC, Kupek E, Fernandes L. Hierarchical modeling of the 50 largest economies to verify the impact of GDP, population and renewable energy generation in CO2 emissions. Sustainable Production and Consumption. 2020;22:58–67. doi: 10.1016/j.spc.2020.02.001. [DOI] [Google Scholar]
- Metz JJ. A reassessment of the causes and severity of Nepal’s environmental crisis. World Development. 1991;19(7):805–820. doi: 10.1016/0305-750X(91)90134-4. [DOI] [Google Scholar]
- Meyers S, McMahon JE, McNeil M, Liu X. Impacts of US federal energy efficiency standards for residential appliances. Energy. 2003;28(8):755–767. doi: 10.1016/S0360-5442(02)00188-3. [DOI] [Google Scholar]
- Mi Z, Zhang Y, Guan D, Shan Y, Liu Z, Cong R, et al. Consumption-based emission accounting for Chinese cities. Applied energy. 2016;184:1073–1081. doi: 10.1016/j.apenergy.2016.06.094. [DOI] [Google Scholar]
- Morelli J. Environmental sustainability: a definition for environmental professionals. Journal of environmental sustainability. 2011;1(1):2. doi: 10.14448/jes.01.0002. [DOI] [Google Scholar]
- Munksgaard J, Pedersen KA, Wien M. Impact of household consumption on CO2 emissions. Energy economics. 2000;22(4):423–440. doi: 10.1016/S0140-9883(99)00033-X. [DOI] [Google Scholar]
- Murray AG, Mills BF. Read the label! Energy Star appliance label awareness and uptake among US consumers. Energy economics. 2011;33(6):1103–1110. doi: 10.1016/j.eneco.2011.04.013. [DOI] [Google Scholar]
- Naseri H, Waygood EOD, Wang B, Patterson Z, Daziano RA. A novel feature selection technique to better predict climate change stage of change. Sustainability. 2022;14(1):40. doi: 10.3390/su14010040. [DOI] [Google Scholar]
- Nayeem, T., & Casidy, R. (2012). The role of individualism and collectivism in low involvement purchase decisions. Paper presented at the ANZMAC 2012: Proceedings of Australian & New Zealand Marketing Academy 2012.
- O'Neill BC, Ren X, Jiang L, Dalton M. The effect of urbanization on energy use in India and China in the iPETS model. Energy economics. 2012;34:S339–S345. doi: 10.1016/j.eneco.2012.04.004. [DOI] [Google Scholar]
- Onel N, Mukherjee A. The effects of national culture and human development on environmental health. Environment, development and sustainability. 2014;16(1):79–101. doi: 10.1007/s10668-013-9464-y. [DOI] [Google Scholar]
- Pachauri S. An analysis of cross-sectional variations in total household energy requirements in India using micro survey data. Energy policy. 2004;32(15):1723–1735. doi: 10.1016/S0301-4215(03)00162-9. [DOI] [Google Scholar]
- Pachauri, S. (2007). An energy analysis of household consumption: changing patterns of direct and indirect use in India (Vol. 13): Springer Science & Business Media.
- Panayotou, T. (1997). Demystifying the environmental Kuznets curve: turning a black box into a policy tool. Environment and development economics, 465-484.
- Parboteeah KP, Bronson JW, Cullen JB. Does national culture affect willingness to justify ethically suspect behaviors? A focus on the GLOBE national culture scheme. International Journal of Cross Cultural Management. 2005;5(2):123–138. doi: 10.1177/1470595805054489. [DOI] [Google Scholar]
- Park, H.-C., & Heo, E. (2007). The direct and indirect household energy requirements in the Republic of Korea from 1980 to 2000—an input–output analysis. Energy policy, 35(5), 2839-2851.
- Park H. Determinants of corruption: A cross-national analysis. Multinational Business Review. 2003;11(2):29–48. doi: 10.1108/1525383X200300010. [DOI] [Google Scholar]
- Parshall L, Gurney K, Hammer SA, Mendoza D, Zhou Y, Geethakumar S. Modeling energy consumption and CO2 emissions at the urban scale: Methodological challenges and insights from the United States. Energy policy. 2010;38(9):4765–4782. doi: 10.1016/j.enpol.2009.07.006. [DOI] [Google Scholar]
- Poumanyvong P, Kaneko S. Does urbanization lead to less energy use and lower CO2 emissions?. A cross-country analysis. Ecological economics. 2010;70(2):434–444. doi: 10.1016/j.ecolecon.2010.09.029. [DOI] [Google Scholar]
- Poumanyvong P, Kaneko S, Dhakal S. Impacts of urbanization on national transport and road energy use: evidence from low, middle and high income countries. Energy policy. 2012;46:268–277. doi: 10.1016/j.enpol.2012.03.059. [DOI] [Google Scholar]
- Praticò FG, Giunta M, Mistretta M, Gulotta TM. Energy and environmental life cycle assessment of sustainable pavement materials and technologies for urban roads. Sustainability. 2020;12(2):704. doi: 10.3390/su12020704. [DOI] [Google Scholar]
- Rao MN, Reddy BS. Variations in energy use by Indian households: an analysis of micro level data. Energy. 2007;32(2):143–153. doi: 10.1016/j.energy.2006.03.012. [DOI] [Google Scholar]
- Reddy BS, Srinivas T. Energy use in Indian household sector—an actor-oriented approach. Energy. 2009;34(8):992–1002. doi: 10.1016/j.energy.2009.01.004. [DOI] [Google Scholar]
- Rees W. Reducing the ecological footprint of consumption. Paper presented at the The Workshop on Policy Measures for Chan-ging Consumption Patterns [Z] Seoul: South Korea; 1995. [Google Scholar]
- Reinders AH, Vringer K, Blok K. The direct and indirect energy requirement of households in the European Union. Energy policy. 2003;31(2):139–153. doi: 10.1016/S0301-4215(02)00019-8. [DOI] [Google Scholar]
- Rosas-Flores JA, Gálvez DM. What goes up: recent trends in Mexican residential energy use. Energy. 2010;35(6):2596–2602. doi: 10.1016/j.energy.2010.01.015. [DOI] [Google Scholar]
- Saleem SB, Ali Y. Effect of lifestyle changes and consumption patterns on environmental impact: A comparison study of Pakistan and China. Chinese Journal of Population Resources and Environment. 2019;17(2):113–122. doi: 10.1080/10042857.2019.1574454. [DOI] [Google Scholar]
- Schipper L, Bartlett S, Hawk D, Vine E. Linking life-styles and energy use: a matter of time? Annual review of energy. 1989;14(1):273–320. doi: 10.1146/annurev.eg.14.110189.001421. [DOI] [Google Scholar]
- Scholtens B, Dam L. Cultural values and international differences in business ethics. Journal of Business Ethics. 2007;75(3):273–284. doi: 10.1007/s10551-006-9252-9. [DOI] [Google Scholar]
- Scurati GW, Bertoni M, Graziosi S, Ferrise F. Exploring the use of virtual reality to support environmentally sustainable behavior: a framework to design experiences. Sustainability. 2021;13(2):943. doi: 10.3390/su13020943. [DOI] [Google Scholar]
- Shahbaz M, Khan S, Ali A, Bhattacharya M. The impact of globalization on CO2 emissions in China. The Singapore Economic Review. 2017;62(04):929–957. doi: 10.1142/S0217590817400331. [DOI] [Google Scholar]
- Shahbaz M, Lean HH. Does financial development increase energy consumption? The role of industrialization and urbanization in Tunisia. Energy policy. 2012;40:473–479. doi: 10.1016/j.enpol.2011.10.050. [DOI] [Google Scholar]
- Shi H, Li X, Zhang H, Liu X, Li T, Zhong Z. Global difference in the relationships between tourism, economic growth, CO2 emissions, and primary energy consumption. Current Issues in Tourism. 2020;23(9):1122–1137. doi: 10.1080/13683500.2019.1588864. [DOI] [Google Scholar]
- Shimoda Y, Asahi T, Taniguchi A, Mizuno M. Evaluation of city-scale impact of residential energy conservation measures using the detailed end-use simulation model. Energy. 2007;32(9):1617–1633. doi: 10.1016/j.energy.2007.01.007. [DOI] [Google Scholar]
- Sultan S, Arshed N, Anwar A, Iqbal M, Sattar N. Renewable energy consumption and carbon emissions—testing nonlinearity for highly carbon emitting countries. Sustainability. 2021;13(21):11930. doi: 10.3390/su132111930. [DOI] [Google Scholar]
- Swaidan Z, Hayes LA. Hofstede theory and cross cultural ethics conceptualization, review, and research agenda. Journal of American Academy of Business. 2005;6(2):10–16. [Google Scholar]
- Tsai M-S, Chang S-L. Taiwan's GHG mitigation potentials and costs: an evaluation with the MARKAL model. Renewable and Sustainable Energy Reviews. 2013;20:294–305. doi: 10.1016/j.rser.2012.12.007. [DOI] [Google Scholar]
- Vitell SJ, Paolillo JG, Thomas JL. The perceived role of ethics and social responsibility: a study of marketing professionals. Business Ethics Quarterly. 2003;13(1):63–86. doi: 10.5840/beq20031315. [DOI] [Google Scholar]
- Vogel. (1987). The comparative study of environmental policy: are view of the literature (W. H. In: Dierkes M, Antal A,editors. Ed.). Aldershot, UK: .
- Vringer K, Blok K. The direct and indirect energy requirements of households in the Netherlands. Energy policy. 1995;23(10):893–910. doi: 10.1016/0301-4215(95)00072-Q. [DOI] [Google Scholar]
- Wang, J., Hassan, M. S., Alharthi, M. D., Arshed, N., Hanif, I., & Saeed, M. I. (2022). Inspecting non-linear behavior of aggregated and disaggregated renewable and non-renewable energy consumption on GDP per capita in Pakistan. Energy Strategy Reviews, 31(12).
- Wang, M., Arshed, N., Munir, M., Rasool, S. F., & Lin, W. (2021). Investigation of the STIRPAT model of environmental quality: a case of nonlinear quantile panel data analysis. Environment, development and sustainability, 1-16.
- Wang P, Wu W, Zhu B, Wei Y. Examining the impact factors of energy-related CO2 emissions using the STIRPAT model in Guangdong Province, China. Applied energy. 2013;106:65–71. doi: 10.1016/j.apenergy.2013.01.036. [DOI] [Google Scholar]
- Wang Q, Yuan X, Zhang J, Mu R, Yang H, Ma C. Key evaluation framework for the impacts of urbanization on air environment—a case study. Ecological Indicators. 2013;24:266–272. doi: 10.1016/j.ecolind.2012.07.004. [DOI] [Google Scholar]
- WDI. (2021). World Development Indicators. Retrieved 20 Feb., 2022, from https://databank.worldbank.org/source/world-development-indicators
- Weber C, Perrels A. Modelling lifestyle effects on energy demand and related emissions. Energy policy. 2000;28(8):549–566. doi: 10.1016/S0301-4215(00)00040-9. [DOI] [Google Scholar]
- Wei Y-M, Liu L-C, Fan Y, Wu G. The impact of lifestyle on energy use and CO2 emission: An empirical analysis of China's residents. Energy policy. 2007;35(1):247–257. doi: 10.1016/j.enpol.2005.11.020. [DOI] [Google Scholar]
- Wier M, Lenzen M, Munksgaard J, Smed S. Effects of household consumption patterns on CO2 requirements. Economic Systems Research. 2001;13(3):259–274. doi: 10.1080/09537320120070149. [DOI] [Google Scholar]
- Xu J-H, Fleiter T, Eichhammer W, Fan Y. Energy consumption and CO2 emissions in China's cement industry: a perspective from LMDI decomposition analysis. Energy policy. 2012;50:821–832. doi: 10.1016/j.enpol.2012.08.038. [DOI] [Google Scholar]
- Yan L, Keh HT, Wang X. Powering sustainable consumption: the role of green consumption values and power distance belief. Journal of Business Ethics. 2021;169(3):499–516. doi: 10.1007/s10551-019-04295-5. [DOI] [Google Scholar]
- Yan W, Minjun S. CO2 emission induced by urban household consumption in China. Chinese Journal of Population Resources and Environment. 2009;7(3):11–19. doi: 10.1080/10042857.2009.10684933. [DOI] [Google Scholar]
- Yu S, Agbemabiese L, Zhang J. Estimating the carbon abatement potential of economic sectors in China. Applied energy. 2016;165:107–118. doi: 10.1016/j.apenergy.2015.12.064. [DOI] [Google Scholar]
- Zhang C, Lin Y. Panel estimation for urbanization, energy consumption and CO2 emissions: a regional analysis in China. Energy policy. 2012;49:488–498. doi: 10.1016/j.enpol.2012.06.048. [DOI] [Google Scholar]
- Zhang J, Yu B, Cai J, Wei Y-M. Impacts of household income change on CO2 emissions: an empirical analysis of China. Journal of cleaner production. 2017;157:190–200. doi: 10.1016/j.jclepro.2017.04.126. [DOI] [Google Scholar]
- Zhang Y-J, Bian X-J, Tan W, Song J. The indirect energy consumption and CO2 emission caused by household consumption in China: an analysis based on the input–output method. Journal of cleaner production. 2017;163:69–83. doi: 10.1016/j.jclepro.2015.08.044. [DOI] [Google Scholar]
- Zhu H-M, You W-H, Zeng Z-f. Urbanization and CO2 emissions: a semi-parametric panel data analysis. Economics Letters. 2012;117(3):848–850. doi: 10.1016/j.econlet.2012.09.001. [DOI] [Google Scholar]
Associated Data
This section collects any data citations, data availability statements, or supplementary materials included in this article.
Data Availability Statement
The sources of data are mentioned in Table 1.