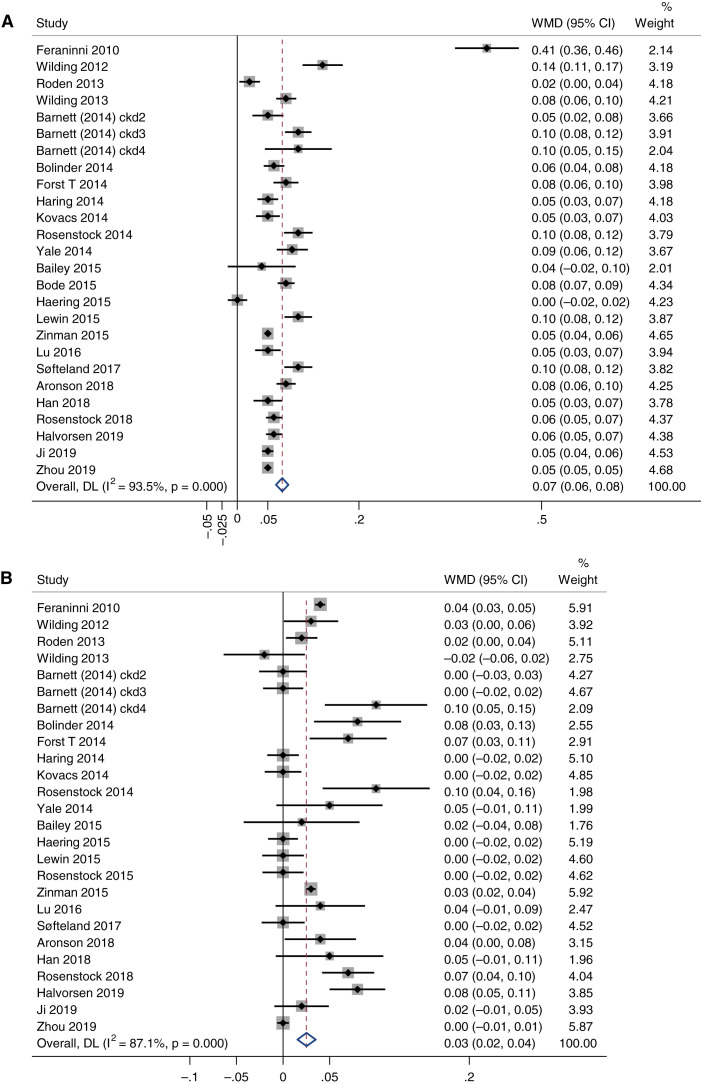
Figure 2.
Pairwise meta-analyses of the effects of sodium-glucose cotransporter (SGLT) 2 inhibitors (SGLT2is) on magnesium and phosphate. (A) Blood magnesium levels (mmol/L) and (B) blood phosphate levels (mmol/L). Each square indicates the WMD in each trial. The horizontal line represents the 95% CI. The pooled WMD and 95% CI is indicated by the dashed line and diamond. The black vertical line represents the null hypothesis. Heterogeneity between studies was assessed by the I2 statistics and Cochrane Q (P value). WMD, weighted mean difference; CI, confidence interval.

