

Abstract
Cerebrospinal fluid (CSF) flows through the perivascular spaces (PVSs) surrounding cerebral arteries. Revealing the mechanisms driving that flow could bring improved understanding of brain waste transport and insights for disorders including Alzheimer’s disease and stroke. In vivo velocity measurements of CSF in surface PVSs in mice have been used to argue that flow is driven primarily by the pulsatile motion of artery walls — perivascular pumping. However, fluid dynamics theory and simulation have predicted that perivascular pumping produces flows differing from in vivo observations starkly, particularly in the phase and relative amplitude of flow oscillation. We show that coupling theoretical and simulated flows to more realistic end boundary conditions, using resistance and compliance values measured in mice instead of using periodic boundaries, results in velocities that match observations more closely in phase and relative amplitude of oscillation, while preserving the existing agreement in mean flow speed. This quantitative agreement among theory, simulation, and in vivo measurement further supports the idea that perivascular pumping is an important CSF driver in physiological conditions.
Keywords: cerebrospinal fluid, glymphatic system, brain, perivascular pumping, compliance, hydraulic resistance
1. Introduction
Cerebrospinal fluid (CSF) has long been known to flow in the perivascular spaces (PVSs) that surround arteries in the brain [1, 2]. A brain-wide fluid pathway, the glymphatic system [3], has been proposed to transport fluid close to much or all of the brain parenchyma, enabling waste evacuation and nutrient / neurotransmitter delivery at rates more rapid than would be possible with diffusion alone, and affecting the brain parenchyma primarily during sleep. Observations in mice [4], rats [5, 6], pigs [7], and humans [8, 9, 10] have produced data consistent with that proposal, though other studies have raised questions [11, 12, 13]. CSF flow has also been implicated in early edema after stroke [14] and proposed as a pathway for drug delivery [15, 16]. We will focus here on surface (pial) PVSs, where detailed flow measurements are possible via in vivo imaging [17, 18]. Recent reviews [19, 20, 21, 22, 23] summarize current knowledge of CSF flow and mass transport in the brain, including surface PVSs.
Measurements in surface PVSs show flow pulsing in synchrony with the cardiac cycle, suggesting a causal link to blood flow. Hadaczek et al. [24] proposed that the dilations and constrictions traveling along artery walls with each heart beat might drive CSF in a peristalsis-like mechanism they dubbed “perivascular pumping.” As evidence, they presented experimental results showing that macromolecules injected into the central nervous systems of rats were transported further in animals with beating hearts than in animals whose hearts had recently been stopped. Iliff et al. [25] presented additional evidence in support of the hypothesis. More recent theoretical [26, 27] and numerical [28, 29, 30] studies have indeed shown that perivascular pumping can plausibly drive net fluid motion locally (except when dilations and constrictions do not travel [31]).
Though it may be plausible for perivascular pumping to drive CSF, theoretical studies that use reasonable approximations and realistic parameters predict flows that differ from in vivo observations in surface PVSs. In a pioneering study, Schley et al. [26] produced an analytic prediction of the flow due to perivascular pumping in an open, two-dimensional, Cartesian space, which is based on the lubrication approximation and is rigorous in the case of long wavelengths. For sinusoidal dilations and constrictions with a b = 0.3 μm half-amplitude traveling at c = 1 m/s on one wall of a channel with width H = 40 μm, their theory predicts a flow in which the mean downstream velocity (that is, the velocity along the length of the PVS, parallel to blood flow) is 0.034 μm/s. Later in vivo measurements found a mean downstream velocity of 18.7 μm/s [17]. Uncertainty in the input parameters, along with the analytic simplifications involved, particularly the geometric differences between a two-dimensional Cartesian space and a three-dimensional annular space, may explain some of the discrepancy in the mean flow. Harder to explain, however, are the discrepancies in phase and relative amplitude of oscillation. Flow oscillation is predicted to lag the wall velocity (which we define as the rate of PVS channel constriction, consistent with Mestre, Tithof et al.[17]) by φ = 270°, but in vivo observations indicate flow oscillations lag wall velocity by φ = 353°. The ratio of oscillatory to mean flow predicted analytically is γ = 22, 200, but in observations, dividing the peak root-mean-square velocity oscillation by the mean downstream velocity yields γ = 0.53. Thus if the mean flow were the same, oscillations in observed flows would need to be about 40,000 times faster in order to match the prediction.
Wang and Olbricht [27], also using lubrication theory and the long-wavelength approximation, produced an analytic prediction of the flow due to perivascular pumping in a cylindrical annulus filled with a porous medium. For sinusoidal dilations and constrictions with the same 0.3 μm half-amplitude and the same speed 1 m/s, traveling on the inner wall of an annulus with inner radius r1 = 30 μm and outer radius r2 = 70 μm, with porosity ε = 1, their theory predicts a flow with mean downstream velocity 10.13 μm/s, quite close to the 18.7 μm/s observed value. But disagreement again arises on oscillation phase and amplitude. Like Schley et al. [26], Wang and Olbricht predict a φ = 270° phase lag from wall velocity to flow oscillations, disagreeing with observations. The Wang and Olbricht theory predicts γ = 443, far from γ = 0.53, as observed in vivo.
Perivascular pumping has also been studied using numerical simulations, which likewise predicted flows that differ starkly from in vivo observations. Kedarasetti et al. [30] recently performed a series of simulations. The first set considered axisymmetric flows in an open (not porous) cylindrical annulus with inner radius 30 μm and outer radius 70 μm. Sinusoidal dilations and constrictions with half-amplitude on the order of 0.3 μm, speed 1 m/s, and frequency 8.67 Hz propagated on the inner wall. The computational domain was one wavelength long, with periodic end boundaries. Though the authors did not report the mean flow speed or volume flow rate, they did state that for realistic speeds, the phase of flow oscillations lagged wall velocity by φ = 270°, agreeing with predictions from lubrication theory [26, 27] but not with in vivo observations [17]. The authors also stated that γ ~ 100, again disagreeing with in vivo observations.
The second set of simulations by Kedarasetti et al. [30] considered flow in a three-dimensional domain whose cross-sectional size and shape are similar to in vivo observations [3, 18, 17] and similar to annular shapes that have minimum hydraulic resistance [32]. Dilations and constrictions on the inner wall propagated at c = 1 m/s with frequency f = 8.67 Hz but were not sinusoidal; rather, their shape and amplitude were taken from the in vivo observations of Mestre, Tithof, et al. [17]. The pressure was set to zero at the end boundaries. The simulations predicted a time-averaged centerline velocity of 102.1 μm/s, in reasonable agreement with the 18.7 μm/s observed in vivo. The phase difference between wall velocity and flow oscillations is not stated, but judging from Fig. 3c in Kedarasetti et al. [30], flow oscillations lag wall velocity by φ ≈ 330°, significantly different from 353°. And the ratio of oscillations to steady flow was γ = 290, strikingly different than γ = 0.53 as observed in vivo. Kedarasetti et al. [30] also presented a third set of simulations, to be discussed below.
Figure 3:

Resistance and compliance of the cerebrospinal fluid pathway in mice, measured in vivo. After a brief and rapid fluid injection (1 μL/s for 5 s), intracranial pressure decays with dynamics well-modeled by an RC boundary condition, as sketched in Fig. 1. From pressure variations measured in the cisterna magna in N = 7 animals (ICP-CM) we calculate resistance R = 1.097 ± 0.090 mmHg/(μL/min) and compliance C = 1.798 ± 0.185 μL/mmHg. From pressure variations measured in the ventricle in N = 4 other animals (ICP-LV) we calculate resistance R = 1.227 ± 0.176 mmHg/(μL/min) and compliance C = 1.953 ± 0.332 μL/mmHg. Repeated measures two-way ANOVA was performed for pressure variations; ns, not significant. The solid lines indicates the mean, and the shaded region represents the standard error of the mean (SEM). Unpaired Student’s t-test was performed for resistance and compliance; ns, not significant; mean ± SEM.
Repeatedly, analytic and numerical predictions of the mean flow caused by perivascular pumping agree reasonably well (if not perfectly) with each other and with mean flows observed in vivo. Analytic and numerical predictions agree that flow oscillations lag wall velocity by a substantial phase difference (270° to 330°), but in vivo observations indicate nearly zero (or equivalently, nearly 360°) phase difference. And when considering the relative amplitude of oscillation γ, though the values vary, theory and simulations have consistently predicted that perivascular pumping would drive far stronger oscillations than have been observed in vivo.
One explanation, as Kedarasetti et al. [30] and others [29, 33, 34, 35] have argued, is that perivascular pumping is not an important driver of flows observed in vivo. CSF production by choroid plexus and uptake by arachnoid villi and other efflux routes almost certainly drive some flow. Non-physiological flow induced by injection of tracer particles has been offered as an explanation [30, 35, 34, 36, 37, 38], but a recent publication showed that withdrawing an equal amount of fluid while injecting tracer particles leaves perivascular flows unchanged, implying they are unlikely to be artifacts [39]. Mestre, Tithof et al. [17] demonstrated that altering the artery wall motion substantially changed CSF flow characteristics and significantly reduced the mean flow speed, suggesting that perivascular pumping does play some role. An explanation of the discrepancies among theory, simulation, and experimental observation is badly needed.
We present evidence that the discrepancies may be resolved via the end boundary conditions. The flow produced by a perivascular pump depends on the pathways coupled to the pump, into which the pumped fluid must pass. Those pathways can be characterized with simple lumped parameters: hydraulic resistance and compliance. Hydraulic resistance quantifies the viscous effects along a fluid pathway, which tend to slow CSF flow, especially when it passes through vessels or interstitial spaces that are small. Compliance quantifies elastic effects along a fluid pathway: when walls and boundaries stretch, fluid can be stored temporarily. Though this two-parameter representation of a large set of pathways is a drastic simplification, it is nonetheless more realistic than the periodic, zero-pressure, or infinite boundary conditions used previously. We present in vivo measurements that approximate both parameters, then demonstrate that coupling existing analytic and numerical perivascular pumping models to a lumped-parameter pathway model produces flows that more closely match in vivo observations.
The paper continues with a discussion of the lumped-parameter model in Sec. 2. Measured values of the hydraulic resistance and compliance are presented in Sec. 3. We couple the lumped-parameter model to existing analytic predictions in Sec. 4 and to an existing numerical simulation in Sec. 5.
2. Lumped-parameter model for boundary conditions
The intricacy of the brain makes it impossible to study the global CSF pathway in full detail. Some mechanisms are unknown, some processes occur at length and time scales unmeasurable with current technology, and a full numerical simulation would overwhelm supercomputers. Thus it is practical to separate the CSF pathway into components that can be considered independently, among them the surface PVSs. Perivascular pumping in a PVS is most simply represented as a source that produces a volume flow rate q0. Considered in isolation, it can be represented by the closed-loop fluid pathway sketched in Fig. 1a. This uncoupled pathway is the lumped-parameter representation of perivascular pumping as considered by all past theoretical and computational studies, including those described above. Periodic end boundary conditions, zero-pressure boundary conditions, and infinite domains are equivalent, in the lumped-parameter characterization, to making a direct connection between the PVS inlet and outlet.
Figure 1:
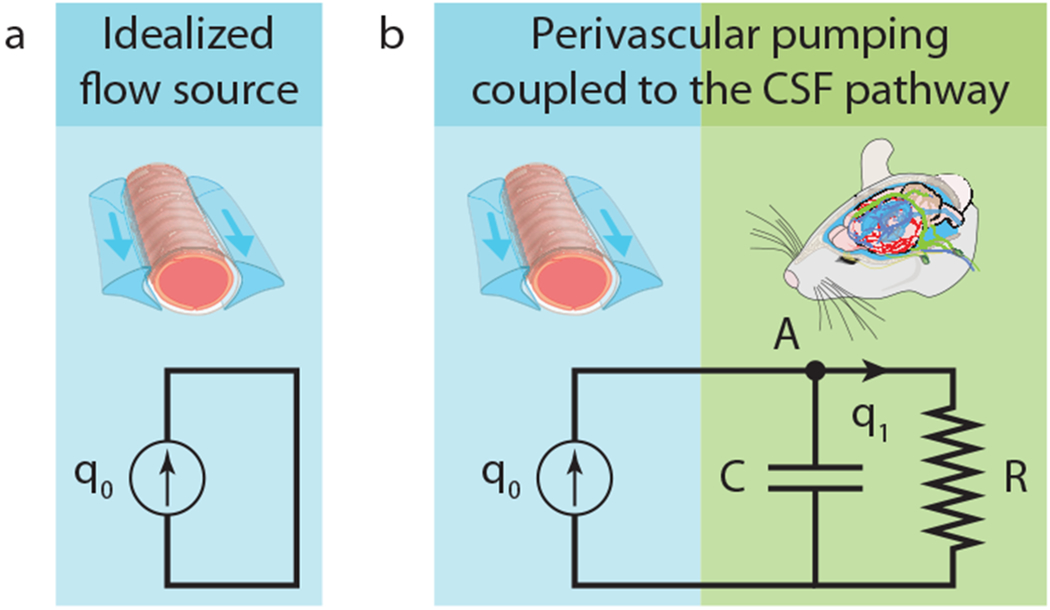
(a), A lumped-parameter characterization of perivascular pumping, uncoupled from other fluid pathways. (b), A lumped-parameter characterization of perivascular pumping coupled to other fluid pathways.
Realistic modeling, however, eventually requires accounting for interactions when components are connected. To understand how a peristaltic pump interacts with the rest of the CSF pathway, additional lumped parameters must be introduced, as sketched in Fig. 1b. We will characterize the CSF pathway beyond surface PVSs using resistance R and compliance C (a two-element Windkessel model). The resistance of a component (or pathway) is defined as the pressure difference across the component (or pathway) divided by the volume flow rate through it, and is analogous to electrical resistance. The compliance is defined as the flow rate divided by the rate of change of the pressure difference, and is analogous to electrical capacitance. Including both a compliance and a resistance is essential because we are interested in pulsatile flows and need to account for the characteristic timescale of the CSF pathway: RC. (Some studies discuss the same mechanics in terms of the elastance C−1.)
The values of R and C are constant if the pathway behaves linearly; otherwise, their values vary with the pulsation frequency f. The compliance is well-approximated as constant if the walls of the pathway behave like linear, elastic solids, which is typically the case when strains are small. In surface PVSs, the strain is approximately b/2/r1 = 0.5%, where b is the half-amplitude of dilations and constrictions, and r1 = 30 μm is the inner radius of the annulus; so we take C to be constant. If the Womersley number is small (1 or less), the flow is well predicted by a steady laminar (Poiseuille) flow, and the resistance is well-approximated as constant. Again using H = 40 μm and f = 8.67 Hz, and using ν = 0.697 × 10⁻⁶ m2/s (the kinematic viscosity of water at 36.8°C), we find Wo = 0.35, so we take R to be constant. On a brain-wide scale, when studying intracranial CSF dynamics, the assumption of a pressure-independent resistance and a constant compliance has been shown to be valid for physiological values of ICP [40, 41]. In summary, the values of R and C relevant to steady flow are also relevant to pulsatile flow as observed in vivo.
With components modeled as in Fig. 1b, the volume flow rate q1 through the rest of the CSF pathway must satisfy
| (1) |
One way to arrive at this expression is to note that mass conservation requires inflows and outflows at node A to sum to zero (qc + q1 = q0), and to note that energy conservation requires the pressure across C to equal the pressure across R (P = PC = PR). The pressure across R is given by Ohm’s law (P = q1 R), and the pressure-flow relationship for the capacitor is qc = C ∂P/∂t. Thus, equation (1) is obtained after replacing qc in terms of q1, R, and C. We want to remark that our approach represents a simplification of the PVSs assuming that the flow across the glial boundary can be neglected, and thus we can apply conservation of mass. However, we anticipate that this assumption would not affect our results since these flows are estimated to be some orders of magnitude smaller than the mean downstream velocity and can be safely neglected [42]. Therefore, our lumped-parameter characterizations of perivascular pumping and of the rest of the CSF pathway make it possible to predict the flow in the coupled system from the flow in the uncoupled system, if the resistance R and compliance C can be estimated.
3. In vivo resistance and compliance measurements
Lumped-parameter characterizations of the typical CSF pathway beyond a surface PVS have been limited due to a lack of knowledge of the pathways’ connectivity and mechanical properties. Neither the resistance nor the compliance has been measured, and the possible roles of flow through brain parenchyma and/or capillary PVSs are topics of ongoing investigation and debate. We estimated R and C using the brain-wide resistance and compliance, which we could measure directly. Those quantities are likely to differ from the resistance and compliance experienced by any particular surface PVS, but can serve as initial estimates and are likely to be more accurate than the R = 0 and C = 0 values implied by periodic, zero-pressure, or infinite boundary conditions. The effects of variation in their values are discussed in more detail below.
We performed bolus-injection experiments in 11 mice, as described in Methods, using the setup shown in Fig. 2. The resulting variation of ICP over time is shown in Fig. 3. In N = 7 mice, we measured ICP in the cisterna magna; in N = 4 others, we measured ICP in the right lateral ventricle. From its value before injection, the ICP increased suddenly to a maximum value Pmax, then decayed gradually. The decay was nearly exponential, as we would expect from a linear RC system. We calculated the compliance C from the pressure-volume index (PVI), as described in Methods. The resulting R and C values are shown in Fig. 3. When measured in the cisterna magna, the resistance is R = (8.772 ± 0.722) × 1012 Pa · s/m3 = 1.097 ± 0.090 mmHg/(μL/min) (mean ± standard error of the mean), and the compliance is C = (1.349 ± 0.139) × 10−11 m3/Pa = 1.798 ± 0.185 μL/mmHg. The corresponding time constant is RC = 118.3 s. When measured in the ventricle, the resistance is R = (9.815 ± 1.408) × 1012 Pa · s/m3 = 1.227 ± 0.176 mmHg/(μL/min), and the compliance is C = (1.465 ± 0.249) × 10−11 m3/Pa = 1.953 ± 0.332 μL/mmHg. The corresponding time constant is RC = 143.8 s. Differences in R and C between the two locations are not significant (P = 0.478 and 0.665, respectively; Fig. 3). Below, we shall refer to values measured during cisterna magna injection, a protocol used more commonly for introducing tracers because the cisterna magna is more accessible than the ventricles.
Figure 2:

Experimental setup. By injecting artificial CSF into the brain of an anesthetized mouse, we measured the resulting intracranial pressure (ICP) to determine the resistance and compliance of brain CSF spaces.
Other studies have determined the resistance and compliance of the CSF pathway. Jones [43] used a constant-rate infusion technique to measure the resistance of CSF spaces during development in normal and hydrocephalus mice. The author measured a resistance of 1.88 ± 0.37 mmHg/(μL/min) in 5-week-old mice, in good agreement with the R value reported here. The marginally higher value reported by Jones [43] may be due to the infusion method. The bolus injection method is known to underestimate the resistance derived by the constant-rate infusion method [44, 45]. We also measured the resistance using the constant-rate infusion method and obtained a value of R = 1.927 ± 0.315 mmHg/(μL/min) which closely matches the value reported by Jones [43]. Oshio et al. [46] measured a resistance of 5.149 ± 1.103 mmHg/(μL/min) in CD-1 wild-type mice using a similar constant-rate infusion method. This higher resistance also explains their elevated resting ICP (6.988 ± 1.030 mmHg) as compared to other studies with lower ICP levels (≈ 4 mmHg) [47, 48, 49]. This overestimation of the resistance and resting ICP may be due to the high pressure gradient established by the authors while the pipette was in the brain parenchyma to assess ventricle puncture (≈ 29 mmHg). In another study from the same group, Papadopoulos et al. [50] measured the PVI in CD-1 wild-type mice using the bolus injection method. They reported a value of PVI ≈ 19 μL, higher than the values measured here (PVI ≈ 10 μL). However, based on their resting ICP, their compliance would be C = 1.12 μL/mmHg. This is in the range of our C value but smaller which agrees with exponential behavior of the CSF volume-pressure curve and a higher resting ICP [51].
4. Theoretical predictions with RC end boundary conditions
Having characterized the perivascular pump and the CSF pathway in terms of the parameters R and C, we can now use equation (1) to determine the flow rate q1 in the coupled system if the uncoupled flow rate q0 is known. We will first determine q1 from two analytic predictions of q0.
Schley et al. [26] considered a two-dimensional Cartesian domain in which one wall dilates and constricts such that the channel width varies over time and space. Here we consider the general case of sinusoidal wall motion that follows , where H is the mean channel width, b is the half-amplitude of dilation and constriction, c is the wave speed, x is the streamwise spatial coordinate, and denotes the real part. Henceforth, whenever complex quantities appear, we consider only their real part, dropping the notation. Applying lubrication theory and considering the long-wavelength case, Schley et al. found that perivascular pumping in the uncoupled system produces flow rate = c(h – h0), where . From this expression, the quantities tabulated above can be calculated directly. The mean downstream velocity is = 0.034 μm/s. The ratio of the amplitude of the oscillatory component to the amplitude of the steady component is γ = b/(H – h0) = 22, 200. The phase of the oscillatory component of is identical to the phase of h and therefore lags the wall velocity −∂h/∂t by φ = 270°.
Because the system is two-dimensional, is an area (not volume) flow rate and equation (1) becomes
| (2) |
where is the area flow rate in the coupled system, = Rw, = C/w, and w is the width of the channel in the third dimension. Since w was not part of the original theory, we must choose it. Imagining extending the two-dimensional domain to produce a rectangular channel, we match its cross-sectional area to that of the annular channel considered by Kedarasetti et al.[30]: = 94 μm. The solution to equation (2) is
| (3) |
The last term is a starting transient that decays over time. Focusing our attention on fully-developed dynamics, we choose the integration constant . The wall velocity ∂h/∂t, the uncoupled flow rate , and the coupled flow rate are shown in Fig. 4.
Figure 4:

RC boundary conditions alter the phase and relative amplitude of flow pulsations in the Schley et al. [26] solution for peristaltic pumping. (a), Artery wall velocity at x = 0, over one cycle. (b), Flow rate when the peristaltic pump is uncoupled from the CSF pathway, at x = 0, over one cycle. (c), Flow rate when the pump is coupled to the CSF pathway, at x = 0, over one cycle. Note that different units are used in panels (b) and (c). The phase and relative amplitude of flow oscillation agree closely with in vivo observations when coupled, but not when uncoupled.
The first term in equation (3) gives the steady component of the flow, unchanged from the uncoupled case. The second term gives the oscillatory component, which lags the wall velocity . Coupling the perivascular pump to the rest of the CSF pathway shifts the phase of oscillation by 90°, so that the flow oscillates at nearly the same phase as the wall velocity. That phase shift is consistent with our expectations from the lumped-parameter model shown in Fig. 1: the CSF pathway acts like a first-order lowpass filter with cutoff frequency ()−1. Since )−1, the phase shift imposed by the filter is well-approximated by arctan = 89.96°. Because of that shift, the analytic solution of Schley et al.[26], when coupled to the rest of the CSF pathway, predicts that wall velocity and flow oscillations will have nearly the same phase, as observed in vivo.
The ratio of the amplitudes of the oscillatory and steady terms in equation (3) is γ = b(H − h0)−1()−1/2 = 34.5. Coupling the perivascular pump to the rest of the CSF pathway decreases γ by a factor of more than 600. That decrease is consistent with our expectations from the lumped-parameter model shown in Fig. 1. Since −1, the gain of the lowpass filter at frequency f is well-approximated by ()−1 = 1.551 × 10−4 = 1/645. Without coupling, γ = 22, 200, disagreeing by many orders of magnitude with γ = 0.53 measured in vivo. Coupling the analytic prediction of Schley et al.[26] to the rest of the CSF pathway, however, brings much closer agreement to in vivo observations, especially considering that the theory is two-dimensional and Cartesian.
Wang and Olbricht [27] considered a porous, axisymmetric cylindrical annulus in which the inner wall dilates and constricts such that the channel width (distance between inner and outer walls) varies over time according to h = r2 − r1 + . Applying lubrication theory and considering the long-wavelength case, they found that perivascular pumping in the uncoupled system and in the absence of other pressure gradients produces flow rate q0 = , where ε is the porosity of the space, which we presume to be open (ε = 1), and α± = ((1 ± r1/r2)2 − (b/r2)2)−1/2. From these expressions, the quantities tabulated above can be calculated directly. The mean downstream velocity is = 10.13 μm/s. The ratio of the amplitude of the oscillatory component to the steady component is γ = 443. The phase of the oscillatory component of q0 is identical to the phase of h and therefore lags the wall velocity −∂h/∂t by φ = 270°.
Using equation (1), we can solve for q1. The result is plotted in Fig. 5, along with the wall velocity −∂h/∂t and the uncoupled flow rate q0. (The analytic form of q1 is lengthy, so we do not repeat it here.) Again, we neglect the transient term, and the mean downstream velocity is not changed by coupling the perivascular pump to the rest of the CSF pathway. The oscillatory component of q1 lags the wall velocity ∂h/∂t by φ = 359.9°, agreeing well with in vivo observations. The ratio of the amplitude of the oscillatory component to the steady component is γ = 0.069, agreeing well with γ = 0.53 observed in vivo.
Figure 5:

RC boundary conditions alter the phase and relative amplitude of flow pulsations in the Wang and Olbricht [27] solution for peristaltic pumping. (a), Artery wall velocity over one cycle. (b), Flow rate q0 when the peristaltic pump is uncoupled from the CSF pathway, at x = 0, over one cycle. (c), Flow rate q1 when the pump is coupled to the CSF pathway, at x = 0, over one cycle. Note that different units are used in panels (b) and (c). The phase and relative amplitude of flow oscillation agree closely with in vivo observations when coupled, but not when uncoupled.
5. Simulation predictions with RC end boundary conditions
Having demonstrated the effects of RC end boundary conditions on two existing theoretical predictions, we now demonstrate the effect on existing predictions from simulation. As described above, the second set of simulations presented by Kedarasetti et al. [30] considered flow in a three-dimensional domain whose cross-sectional shape and size are similar to in vivo observations. The inner wall was made to dilate and constrict according to wall velocity measured in vivo [17]; the wall velocity is plotted in Fig. 6a. The pressure was set to zero at end boundaries, again with the system isolated from the rest of the CSF pathway. Perivascular pumping produced the centerline velocity shown in Fig. 6b. As mentioned above, the time-averaged centerline velocity was 102.1 μm/s, the flow oscillations lag wall velocity by φ ≈ 330°, and the ratio of oscillations to steady flow was γ = 290.
Figure 6:

RC boundary conditions bring good agreement between the fluid dynamical simulations of Kedarasetti et al. [30] and in vivo measurements. (a), In vivo measurements of artery wall velocity in the peri-arterial space surrounding the middle cerebral arteries of mice. The curve indicates the mean, and the shaded region indicates the standard error of the mean, over 7 mice. From Mestre, Tithof et al. [17]. (b), Centerline fluid velocity in the simulations of Kedarasetti et al. [30], as driven by the wall velocity shown in (a). (c), Centerline fluid velocity after coupling to RC boundary conditions, calculated numerically using equation (1), from the simulation results in (b). (d), In vivo measurements of oscillation of the root-mean-square velocity, in the same 7 experiments as in (a). The curve indicates the mean, and the shaded region indicates the standard error of the mean. Note that different units are used in panels (b) and (c). With RC boundary conditions, the phase, relative oscillation amplitude, and oscillation shape are similar in simulations and in vivo observations.
The cross-sectional mean velocity is not given by Kedarasetti et al.[30], but it is surely similar to the centerline velocity, perhaps smaller than the centerline velocity by 20-40%. Approximating the mean velocity as the centerline velocity, we can use the data shown in Fig. 6b to solve equation (1) numerically with a simple forward-Euler scheme. The cross-sectional area that relates mean velocities to volume flow rates is arbitrary, being the same for both q0 and q1. The result, shown in Fig. 6c, shows the centerline velocity predicted by the Kedarasetti et al. [30] simulation with RC end boundary conditions, accounting for coupling to the rest of the CSF pathway. The time-averaged centerline velocity is 102.1 μm/s, unchanged from the uncoupled case and in reasonable (though not exact) agreement with the roughly 40 μm/s centerline velocity implied by the 18.7 μm/s mean observed in vivo. The peak of the centerline velocity lags the peak of the wall velocity by φ = 356°, similar to the in vivo observations. The ratio of the amplitude of oscillations to steady flow is γ = 0.021, similar to the γ = 0.53 observed in vivo. For comparison, Fig. 6 shows the oscillatory velocity as measured in vivo. Its magnitude, phase, zero-crossing, and shape all resemble the prediction we can make by coupling the simulation results to RC end boundary conditions.
6. Discussion
Noting discrepancies between in vivo observations of flow in surface PVSs and flows predicted by theory and simulation, we have considered the effects of coupling to an RC end boundary condition. We estimated R and C by measuring the brain-wide hydraulic resistance and compliance via bolus injections in live mice. Coupling two published theoretical models and one published simulation to the new boundary conditions, we found that in all three cases, two key discrepancies were largely resolved: the ratio of oscillatory flow to mean flow was reduced, and the phase difference between wall motion and fluid motion was changed, so that both more nearly matched in vivo observations.
Our quantitative results are summarized in Table 1. Uncoupled, predictions from theory and simulation all produce mean speeds roughly similar to in vivo observations, phase shifts much larger than in vivo observations, and oscillation ratios much larger than in vivo observations. Coupling to realistic, lumped-parameter boundary conditions, based on our in vivo measurements, brings agreement in phase and oscillation ratio, in addition to mean speed. This broad agreement among four independent studies supports the hypothesis that perivascular pumping is indeed an important driver of CSF flow in PVSs under physiological conditions.
Table 1:
Summarized flow characteristics from theoretical predictions, simulation predictions, and in vivo observations. The velocity is averaged over the channel, except in the case of the simulation predictions, where centerline velocity was given.
| (μm/s) | φ | γ | |
|---|---|---|---|
| uncoupled Schley prediction | 0.034 | 270° | 22,200 |
| uncoupled Wang prediction | 10.13 | 270° | 443 |
| uncoupled Kedarasetti prediction | 102.1 | 330° | 290 |
| coupled Schley prediction | 0.034 | 0° | 34.5 |
| coupled Wang prediction | 10.13 | 359.9° | 0.069 |
| coupled Kedarasetti prediction | 102.1 | 356.4° | 0.021 |
| in vivo observations | 18.7 | 353° | 0.53 |
One key implication of our findings is the general importance of using RC boundary conditions when making predictions from theory or simulation. To the extent that the dynamics are linear, a lumped-parameter model can be coupled to theory or simulation a posteriori, as we have done here. However, in a case where nonlinear behaviors are appreciable, likely if the Reynolds number is large, accuracy requires including RC boundary conditions in the theory or simulation itself. Lumped-parameter models are used routinely in simulations of cardiovascular flows, either as standalone models of the circulatory physiology, or coupled to hydrodynamic models as boundary conditions [52, 53, 54]. Unfortunately, the RC = 118.3 s ≫ f−1 time constant we measure presents a particular challenge when simulating the CSF pathway. Transients decay on the RC timescale (see equation (3)), so observing fully-developed dynamics will require simulating many cardiac cycles, at substantial and perhaps impractical computational expense. A posteriori coupling may be the more viable approach.
The lumped-parameter model used in this study was the simplest two-element Windkessel model; the model successfully captures the decay constant and phase relation in our study of perivascular flows. The three-element model, which adds a resistance (or impedance) in series with the RC circuit, captures high-frequency dynamics measured for aortic impedance in vivo, and hence is used widely in the cardiovascular community [55, 56, 57]. Without measurements of glymphatic impedance over a wide frequency range, however, the need for a more complex model for perivascular flow is currently speculative, and may be the subject of future work.
Kedarasetti et al. [30] presented a third set of simulations in which a traveling wave propagated on the outer PVS wall as well, to explore the implications of surrounding tissue being deformed by pressure oscillations. Also included was a prescribed pressure difference of order 0.01 mmHg, which drove mean flow through the low-resistance PVS. However, that boundary condition is again unrealistic, because the pressure at the ends of the PVS would be affected by coupling to the rest of the CSF pathway. Surface PVSs connect to a network of distal PVSs and interstitial space with higher resistance, implying that greater pressure differences would be required to drive flow.
Our findings are subject to caveats. Most importantly, we have approximated the resistance R and compliance C of the rest of the CSF pathway — that is, the components to which a surface PVS is connected, directly or indirectly — with the measured brain-wide resistance and compliance. Measuring R and C more locally, in a way that distinguishes the resistance and compliance of the CSF pathway connected to a surface PVS from other CSF pathways, would be more accurate. That said, the predicted phase lag would nonetheless be nearly zero for any case in which RC ≫ f−1. Since heart rates vary little (perhaps a factor of two or three, not more), and since the measured RC value is larger than the cardiac time by four orders of magnitude, even if the value of RC were two orders of magnitude smaller than the value used above (1.438 s instead of 143.8 s), agreement in φ among theory, simulation, and in vivo observations would hold. On the other hand, the predicted oscillation ratio depends more sensitively on RC, so agreement in γ may be a better test of the accuracy of RC.
Another important caveat is the length of each segment of perivascular space. We presented results of coupled flows in domains that are at least one wavelength long, but shorter domains produce different predictions. Asgari et al. [29] simulated a domain with length just 0.1 to 0.2% of the wavelength, which is more physiologically realistic. Similar to others [26, 27, 30], they predict a flow rate with large γ = 4280. However, their flow rate is nearly in phase with the wall velocity, in agreement with the in vivo measurements of Mestre, Tithof, et al. [17], even without an RC boundary condition. The domain length likely caused the phase shift, which was also observed by Kedarasetti et al. in their simulation of a short domain [30]. Though the detailed effects of varying domain length are beyond the scope of this paper, we plan to study it more deeply in the future.
Our approach is built on the assumption that surface PVSs do connect to an extended CSF pathway. If there were no such connection, and surface PVSs were merely isolated annular spaces whose inlets and outlets connected to large fluid chambers like the subarachnoid space, then the lumped parameter boundary conditions we propose would not apply. However, it is generally believed that they do connect [58, 59]. Our approach does not rely on assumptions about the location or nature of the connected CSF pathway, except that it has compliance and resistance. A pathway through the brain parenchyma, as proposed by the glymphatic hypothesis and supported by tracer influx studies [4, 5, 6, 8, 9], would have such properties, but other pathways would have them as well. Identifying and characterizing CSF pathways, including the particular anatomy that provides their resistance and compliance, is an important topic of ongoing work.
The simple model sketched in Fig. 1b implies that the flow is q0 at locations left of point A and q1 at locations right of point A. Compliance and resistance affect the flow elsewhere in the system, but not immediately adjacent to the idealized source. If the situation in surface perivascular spaces is truly this simple, we would expect measurements made immediately adjacent to the flow source to find velocities matching those predicted with periodic boundary conditions. Existing in vivo measurements do not. We conclude that those measurements were not made immediately adjacent to the flow source, that instead, significant perivascular pumping and compliance occur at locations proximal to the measurement locations. Future work could test this idea. Future work could also expand the simple model of Fig. 1b to include multiple sources and multiple compliances, thereby accounting for more intricacies of the network of PVSs.
Our findings suggest that if CSF passes through brain tissue as proposed by the glymphatic hypothesis, then not only the mean flow , but also the phase φ and the normalized oscillation amplitude may vary with the state of wakefulness. Iontophoresis measurements have shown that the interstitial space in murine brain parenchyma increases 60% during sleep, and tracer measurements showed that mass transport through brain tissue increased by an order of magnitude [4]. Thus it seems the mean flow increases during sleep. We hypothesize that the expanded interstitial space lowers the resistance R of the CSF pathway and therefore changes γ and φ as well, as expected from equation (1). We expect γ to be more sensitive to wakefulness state than φ, because the phase shift of a lowpass RC filter is nearly flat when RC ≫ f−1. Future work might test this hypothesis. Other physiological changes that resize interstitial spaces, such as altering the osmotic potential [15], are likely to have similar effects. That said, the focus of this paper is modeling flow in surface PVSs, and how boundary conditions affect outcomes, regardless of whether or not CSF passes through brain tissue.
It is well-established that aging typically stiffens arteries, especially the major arteries, and their reduced compliance significantly affects cardiovascular flows [60, 61]. In particular, the reduced RC time implies a higher filter cutoff frequency and correspondingly increased the ratio of oscillatory to mean flow in blood. Our results suggest that aging may also alter CSF flow via changes in compliance. On the one hand, reduced arterial compliance would imply a higher filter cutoff frequency and tend to increase the ratio of oscillatory to mean flow in CSF (γ), just as in blood flow. On the other hand, reduced arterial compliance would reduce artery wall motion and the corresponding perivascular pumping, reducing both the mean flow and the pulsations. One recent study [62] shows reduced CSF flow in aged mice, which might be explained in part by arterial stiffening, though other mechanisms are likely to play a role as well. Future work might quantify them and suggest corresponding clinical interventions.
Accumulation of amyloid-β and τ plaques associated with Alzheimer’s disease may also reduce compliance, with the same effects. Vascular pulse wave velocity has been found to change with amyloid-β deposition in humans [63]. Changes in the compliance and effective mass of the artery wall, because of plaques accumulating there, would tend to change the wave velocity and also the CSF flow. Future studies might explore the extent to which plaque accumulation in Alzheimer’s affects compliance and therefore CSF flow.
An improved understanding of the mechanisms that drive CSF flow in the brain remains an important topic for future work. We have shown here that results from theory, simulation, and experiment are all consistent with perivascular pumping being a primary driver in physiological conditions. We hope our analysis will lead to more precise quantification of flows and driving mechanisms. Neuroimaging studies have shown that the ICP pressure waveform has different components including the cardiac cycle, respiration cycle, and slow vasomotion [64], and other mechanisms are known to dominate in pathological conditions like stroke [14]. Seeking flow and mechanisms at frequencies other than the heart rate, including the 0.05 Hz range of ventricular flow observed by [65], is a promising topic for future study. With RC boundary conditions, first-principles simulations might be precise enough to quantify what fraction of the mean flow, if any, cannot be driven by arterial pulsations.
7. Methods
7.1. Animals and surgical preparation
All animal experiments presented in the manuscript were approved and in accordance with relevant guidelines and regulations by the University of Rochester Medical Center Committee on Animal Resources (Protocol No. 2011-023), certified by Association for Assessment and Accreditation of Laboratory Animal Care, and reported according to the Animal Research Reporting of In Vivo Experiments (ARRIVE) guidelines. All of the University of Rochester’s animal holding rooms are maintained within temperature (18–26°C) and humidity ranges (30–70%) described in the ILAR Guide for the Care and Use of Laboratory Animals (1996). All efforts were made to keep animal usage to a minimum. C57BL/6 mice ages 2–4 months (25–30 g) were purchased from Charles River Laboratories (Wilmington, MA) with exact animal numbers stated in the results and figure legends. In all experiments, animals were anesthetized with a combination of ketamine (100 mg/kg) and xylazine (10 mg/kg) administered intraperitoneally. Depth of anesthesia was determined by the pedal reflex test. The pedal reflex was tested every 5 to 10 min during the infusion experiment to ensure proper anesthesia throughout the study. If the mouse responded to toe pinch, an additional 1/10 of the initial dosage was given and the infusion experiment was delayed until full unconsciousness was obtained. Body temperature was maintained at 37.5°C with a rectal probe-controlled heated platform (Harvard Apparatus). Anesthetized mice were fixed in a stereotaxic frame, and two cannulae were implanted into the right lateral ventricle (0.85 mm lateral, 2.10 mm ventral and 0.22 mm caudal to bregma) and the cisterna magna, as previously described [66].
7.2. Evaluation of CSF dynamics
We measured hydraulic resistance and compliance using bolus injection, an approach introduced by Marmarou et al. [51]. We injected fluid briefly and rapidly, measuring the resulting change in intracranial pressure (ICP), to estimate an impulse response, approximating the CSF pathway as a linear RC system. In one set of experiments, using a computer-controlled syringe pump (Harvard Apparatus Pump 11 Elite), we injected V = 5 μL of artificial CSF (126 mM NaCl, 2.5 mM KCl, 1.25 mM NaH2PO4, 2 mM MgSO4, 2 mM CaCl2, 10 mM glucose, 26 mM NaHCO3; pH 7.4 when gassed with 95% O2 and 5% CO2) at 1 μL/s into the right lateral ventricle. We monitored ICP via the cisterna magna cannula connected to a transducer attached to a pressure monitor (BP-1, World Precision Instruments Inc., Sarasota, FL). In another set of experiments, we instead injected into the cisterna magna and monitored ICP in the right lateral ventricle, keeping other parts of the procedure unchanged. ECG and respiratory rate were also acquired using a small animal physiological monitoring device (Harvard Apparatus). All the signals were recorded at 1 kHz and digitized with a Digidata 1550A digitizer and AxoScope software (Axon Instruments).
We calculated the compliance C from the pressure-volume index (PVI): C = log10 e·PVI/P0, where e is the base of the natural logarithm. The PVI is defined as the volume of fluid required to cause a tenfold pressure increase during bolus injection:
| (4) |
The resistance R can be estimated as
| (5) |
where P(t) is the pressure measured at time t. We expect R to be nearly constant, but to increase accuracy, we estimate R for each animal by averaging the results of equation (5) at five evenly-spaced times during the experiment.
7.3. Statistical analysis
All statistical analyses were done in GraphPad Prism 8 (GraphPad Software). Data in all corresponding graphs are plotted as mean ± standard error of the mean (SEM). Parametric and nonparametric tests were selected based on normality testing (Shapiro-Wilk test). Sphericity was not assumed in the repeated measure two-way ANOVA and a Geisser-Greenhouse correction was performed. All hypothesis testing was two-tailed, and significance was determined at an α = 0.05.
Acknowledgements
The authors are grateful for fruitful conversations with J. H. Thomas and J. Tithof, and for expert illustration by D. Xue. This work was supported by the NIH/National Institute of Aging (grant RF1AG057575), by the U. S. Army Research Office (grant MURI W911NF1910280), and by the National Science Foundation (grant CBET-2143702).
Footnotes
Publisher's Disclaimer: This is a PDF file of an unedited manuscript that has been accepted for publication. As a service to our customers we are providing this early version of the manuscript. The manuscript will undergo copyediting, typesetting, and review of the resulting proof before it is published in its final form. Please note that during the production process errors may be discovered which could affect the content, and all legal disclaimers that apply to the journal pertain.
Competing interests: The authors declare that they have no conflict of interest with respect to the work presented.
References
- [1].Rennels Marshall L, Gregory Thomas F, Blaumanis Otis R, Fujimoto Katsukuni, and Grady Patricia A. Evidence for a ‘paravascular’ fluid circulation in the mammalian central nervous system, provided by the rapid distribution of tracer protein throughout the brain from the subarachnoid space. Brain Res, 326(1):47–63, 1985. [DOI] [PubMed] [Google Scholar]
- [2].Rennels ML, Blaumanis OR, and Grady PA. Rapid solute transport throughout the brain via paravascular fluid pathways. Adv. Neurobiol, 52:431–439, 1990. [PubMed] [Google Scholar]
- [3].Iliff JJ, Wang M, Liao Yang, Plog BA, Peng W, Gundersen GA, Benveniste H, Vates GE, Deane R, Goldman SA, Nagelhus EA, and Nedergaard M. A Paravascular Pathway Facilitates CSF Flow Through the Brain Parenchyma and the Clearance of Interstitial Solutes, Including Amyloid. Sci. Transl. Med, 4(147):147ra111–147ra111, August 2012. [DOI] [PMC free article] [PubMed] [Google Scholar]
- [4].Xie Lulu, Kang Hongyi, Xu Qiwu, Chen Michael J, Liao Yonghong, Thiyagarajan Meenakshisundaram, O’Donnell John, Christensen Daniel J, Nicholson Charles, Iliff Jeffrey J, Takano Takahiro, Deane Rashid, and Nedergaard Maiken. Sleep Drives Metabolite Clearance from the Adult Brain. Science, 342(6156):373–377, October 2013. [DOI] [PMC free article] [PubMed] [Google Scholar]
- [5].Ratner Vadim, Gao Yi, Lee Hedok, Elkin Rena, Nedergaard Maiken, Benveniste Helene, and Tannenbaum Allen. Cerebrospinal and interstitial fluid transport via the glymphatic pathway modeled by optimal mass transport. NeuroImage, 152:530–537, May 2017. [DOI] [PMC free article] [PubMed] [Google Scholar]
- [6].Koundal Sunil, Elkin Rena, Nadeem Saad, Xue Yuechuan, Stefan Constantinou Sanggaard Simon, Liu Xiaodan, Monte Brittany, Xu Feng, Nostrand William, Nedergaard Maiken, Lee Hedok, Wardlaw Joanna, Benveniste Helene, and Tannenbaum Allen. Optimal Mass Transport with Lagrangian Workflow Reveals Advective and Diffusion Driven Solute Transport in the Glymphatic System. Sci. Rep, pages 1–18, February 2020. [DOI] [PMC free article] [PubMed] [Google Scholar]
- [7].Bèchet Nicholas Burdon, Shanbhag Nagesh C, and Lundgaard Iben. Glymphatic pathways in the gyrencephalic brain. Journal of Cerebral Blood Flow & Metabolism, 0(0): 0271678X21996175, 0. doi: 10.1177/0271678X21996175. URL 10.1177/0271678X21996175. [DOI] [PMC free article] [PubMed] [Google Scholar]
- [8].Eide Per Kristian, Sirirud Vatnehol Svein Are, Emblem Kyrre Eeg, and Ringstad Geir. Magnetic resonance imaging provides evidence of glymphatic drainage from human brain to cervical lymph nodes. Sci. Rep, pages 1–10, April 2018. [DOI] [PMC free article] [PubMed] [Google Scholar]
- [9].Ringstad Geir, Valnes Lars M, Dale Anders M, Pripp Are H, Vatnehol Svein-Are S, Emblem Kyrre E, Mardal Kent-André, and Eide Per K. Brainwide glymphatic enhancement and clearance in humans assessed with MRI. JCI Insight, 3(13):1–16, July 2018. [DOI] [PMC free article] [PubMed] [Google Scholar]
- [10].Eide Per Kristian, Vinje Vegard, Pripp Are Hugo, Mardal Kent-André, and Ringstad Geir. Sleep deprivation impairs molecular clearance from the human brain. Brain, 144(3):863–874, March 2021. [DOI] [PubMed] [Google Scholar]
- [11].Abbott N Joan, Pizzo Michelle E, Preston Jane E, Janigro Damir, and Thorne Robert G. The role of brain barriers in fluid movement in the cns: is there a ‘glymphatic’system? Acta Neuropathol, 135(3):387–407, 2018. [DOI] [PubMed] [Google Scholar]
- [12].Smith Alex J and Verkman Alan S. The “glymphatic” mechanism for solute clearance in alzheimer’s disease: game changer or unproven speculation? FASEB J, 32(2):543–551, 2018. [DOI] [PMC free article] [PubMed] [Google Scholar]
- [13].Ma Qiaoli, Decker Yann, Müller Andreas, Ineichen Benjamin V, and Proulx Steven T. Clearance of cerebrospinal fluid from the sacral spine through lymphatic vessels. J. Exp. Med, 216(11):2492–2502, 2019. [DOI] [PMC free article] [PubMed] [Google Scholar]
- [14].Mestre H, Du Ting, Sweeney Amanda M, Liu Guojun, Samson Andrew J, Peng Weiguo, Mortensen Kristian Nygaard, Stæger Frederik Filip, Bork Peter A R, Bashford Logan, Toro Edna R, Tithof J, Kelley DH, Thomas John H, Hjorth Poul G, Martens Erik A, Mehta Rupal I, Solis Orestes, Blinder Pablo, Kleinfeld David, Hirase Hajime, Mori Yuki, and Nedergaard Maiken. Cerebrospinal fluid influx drives acute ischemic tissue swelling. Science, 9:eaax7171–24, January 2020. [DOI] [PMC free article] [PubMed] [Google Scholar]
- [15].Plog Benjamin A, Mestre H, Olveda Genaro E, Sweeney Amanda M, Kenney H Mark, Cove Alexander, Dholakia Kosha Y, Tithof J, Nevins TD, Lundgaard Iben, Du Ting, Kelley DH, and Nedergaard Maiken. Transcranial optical imaging reveals a pathway for optimizing the delivery of immunotherapeutics to the brain. JCI Insight, 3(20):1188–16, October 2018. [DOI] [PMC free article] [PubMed] [Google Scholar]
- [16].Lilius Tuomas O, Blomqvist Kim, Hauglund Natalie L, Liu Guojun, Stæger Frederik Filip, Bærentzen Simone, Du Ting, Ahlström Fredrik, Backman Janne T, Kalso Eija A, et al. Dexmedetomidine enhances glymphatic brain delivery of intrathecally administered drugs. J. Control Release, 304: 29–38, 2019. [DOI] [PubMed] [Google Scholar]
- [17].Mestre H, Tithof J, Du Ting, Song Wei, Peng Weiguo, Sweeney Amanda M, Olveda Genaro, Thomas John H, Nedergaard Maiken, and Kelley DH. Flow of cerebrospinal fluid is driven by arterial pulsations and is reduced in hypertension. Nat. Commun, 9(1):4878, 2018. [DOI] [PMC free article] [PubMed] [Google Scholar]
- [18].Bedussi Beatrice, Almasian Mitra, de Vos Judith, VanBavel Ed, and Bakker Erik NTP. Paravascular spaces at the brain surface: Low resistance pathways for cerebrospinal fluid flow. J. Cereb. Blood Flow Metab, 38(4):719–726, October 2017. [DOI] [PMC free article] [PubMed] [Google Scholar]
- [19].Benveniste Helene. The Brain’s Waste-Removal System. Cerebrum, 2018: cer–09–18, July 2018. [PMC free article] [PubMed] [Google Scholar]
- [20].Ray Lori A and Heys Jeffrey J. Fluid Flow and Mass Transport in Brain Tissue. Fluids, 4(4):196–33, December 2019. [Google Scholar]
- [21].Thomas John H. Fluid dynamics of cerebrospinal fluid flow in perivascular spaces. J. R. Soc. Interface, 16(159):20190572–11, October 2019. [DOI] [PMC free article] [PubMed] [Google Scholar]
- [22].Nedergaard Maiken and Goldman Steven A. Glymphatic failure as a final common pathway to dementia. Science, 370(6512):50, October 2020. [DOI] [PMC free article] [PubMed] [Google Scholar]
- [23].Rasmussen Martin Kaag, Mestre Humberto, and Nedergaard Maiken. Fluid transport in the brain. Physiological Reviews, 0(0):null, 0. doi: 10.1152/physrev.00031.2020. [DOI] [PMC free article] [PubMed] [Google Scholar]
- [24].Hadaczek Piotr, Yamashita Yoji, Mirek Hanna, Tamas Laszlo, Bohn Martha C, Noble Charles, Park John W, and Bankiewicz Krystof. The “Perivascular Pump” Driven by Arterial Pulsation Is a Powerful Mechanism for the Distribution of Therapeutic Molecules within the Brain. Mol. Ther, 14(1):69–78, June 2006. [DOI] [PMC free article] [PubMed] [Google Scholar]
- [25].Iliff JJ, Wang M, Zeppenfeld DM, Venkataraman A, Plog BA, Liao Yang, Deane R, and Nedergaard M. Cerebral Arterial Pulsation Drives Paravascular CSF-Interstitial Fluid Exchange in the Murine Brain. J. Neurosci, 33(46):18190–18199, November 2013. [DOI] [PMC free article] [PubMed] [Google Scholar]
- [26].Schley D, Carare-Nnadi R, Please CP, Perry VH, and Weller RO. Mechanisms to explain the reverse perivascular transport of solutes out of the brain. J. Theor. Biol, 238(4):962–974, February 2006. [DOI] [PubMed] [Google Scholar]
- [27].Wang Peng and Olbricht William L. Fluid mechanics in the perivascular space. J. Theor. Biol, 274(1):52–57, April 2011. [DOI] [PubMed] [Google Scholar]
- [28].Bilston Lynne E, Fletcher David F, Brodbelt Andrew R, and Stoodley Marcus A. Arterial Pulsation-driven Cerebrospinal Fluid Flow in the Perivascular Space: A Computational Model. Comput. Methods Biomech. Biomed. Eng, 6(4):235–241, September 2003. [DOI] [PubMed] [Google Scholar]
- [29].Asgari Mahdi, de Zélicourt Diane, and Kurtcuoglu Vartan. Glymphatic solute transport does not require bulk flow. Sci. Rep, pages 1–11, November 2016. [DOI] [PMC free article] [PubMed] [Google Scholar]
- [30].Kedarasetti Ravi Teja, Drew Patrick J, and Costanzo Francesco. Arterial pulsations drive oscillatory flow of CSF but not directional pumping. Sci. Rep, pages 1–12, June 2020. [DOI] [PMC free article] [PubMed] [Google Scholar]
- [31].Rey Julian and Sarntinoranont Malisa. Pulsatile flow drivers in brain parenchyma and perivascular spaces: a resistance network model study. Fluids Barriers CNS, 15(1):20, November 2018. [DOI] [PMC free article] [PubMed] [Google Scholar]
- [32].Tithof J, Kelley DH, Mestre H, Nedergaard Maiken, and Thomas John H. Hydraulic resistance of periarterial spaces in the brain. Fluids Barriers CNS, 16(1):19, 2019. [DOI] [PMC free article] [PubMed] [Google Scholar]
- [33].Diem Alexandra K, Sharp Matthew MacGregor, Gatherer Maureen, Bressloff Neil W, Carare Roxana O, and Richardson Giles. Arterial Pulsations cannot Drive Intramural Periarterial Drainage: Significance for Aβ Drainage. Front. Neurosci, 11:353–9, August 2017. [DOI] [PMC free article] [PubMed] [Google Scholar]
- [34].Smith Alex J, Yao Xiaoming, Dix James A, Jin Byung-Ju, and Verkman Alan S. Test of the ‘glymphatic’ hypothesis demonstrates diffusive and aquaporin-4-independent solute transport in rodent brain parenchyma. Elife, 6:e27679, 2017. [DOI] [PMC free article] [PubMed] [Google Scholar]
- [35].Faghih Mohammad M and Sharp M Keith. Is bulk flow plausible in perivascular, paravascular and paravenous channels? Fluids Barriers CNS, pages 1–10, May 2018. [DOI] [PMC free article] [PubMed] [Google Scholar]
- [36].Croci Matteo, Vinje Vegard, and Rognes Marie E. Uncertainty quantification of parenchymal tracer distribution using random diffusion and convective velocity fields. Fluids Barriers CNS, pages 1–21, September 2019. [DOI] [PMC free article] [PubMed] [Google Scholar]
- [37].Veluw Susanne J van, Hou Steven S, Calvo-Rodriguez Maria, Arbel-Ornath Michal, Snyder Austin C, Frosch Matthew P, Greenberg Steven M, and Bacskai Brian J. Vasomotion as a driving force for paravascular clearance in the awake mouse brain. Neuron, 105(3):549–561, 2020. [DOI] [PMC free article] [PubMed] [Google Scholar]
- [38].Bakker Erik N T P, Naessens Daphne M P, and VanBavel Ed. Paravascular spaces: entry to or exit from the brain? Exp. Physiol, 104(7):1013–1017, June 2019. [DOI] [PMC free article] [PubMed] [Google Scholar]
- [39].Raghunandan Aditya, Guevara Antonio Ladron-de, Tithof J, Mestre H, Du Ting, Nedergaard Maiken, Thomas John H, and Kelley DH. Bulk flow of cerebrospinal fluid observed in periarterial spaces is not an artifact of injection. Elife, 10:e65958, 2021. [DOI] [PMC free article] [PubMed] [Google Scholar]
- [40].Andersson Nina, Malm Jan, and Eklund Anders. Dependency of cerebrospinal fluid outflow resistance on intracranial pressure. Journal of neurosurgery, 109(5):918–922, 2008. [DOI] [PubMed] [Google Scholar]
- [41].Qvarlander Sara, Malm Jan, and Eklund Anders. The pulsatility curve—the relationship between mean intracranial pressure and pulsation amplitude. Physiological measurement, 31(11):1517, 2010. [DOI] [PubMed] [Google Scholar]
- [42].Romanò Francesco, Suresh Vinod, Galie Peter A, and Grotberg James B. Peristaltic flow in the glymphatic system. Scientific reports, 10(1):1–17, 2020. [DOI] [PMC free article] [PubMed] [Google Scholar]
- [43].Jones HC. Cerebrospinal fluid pressure and resistance to absorption during development in normal and hydrocephalic mutant mice. Exp. Neurol, 90(1):162–172, 1985. [DOI] [PubMed] [Google Scholar]
- [44].Kosteljanetz Michael. Resistance to outflow of cerebrospinal fluid determined by bolus injection technique and constant rate steady state infusion in humans. Neurosurgery, 16(3):336–340, 1985. [DOI] [PubMed] [Google Scholar]
- [45].Eklund Anders, Smielewski Peter, Chambers Iain, Alperin Noam, Malm Jan, Czosnyka Marek, and Marmarou Anthony. Assessment of cerebrospinal fluid outflow resistance. Med. Biol. Eng. Comput, 45(8):719–735, 2007. [DOI] [PubMed] [Google Scholar]
- [46].Oshio Kotaro, Watanabe Hiroyuki, Song Yaunlin, Verkman AS, and Manley Geoffrey T. Reduced cerebrospinal fluid production and intracranial pressure in mice lacking choroid plexus water channel Aquaporin-1. FASEB J, 19(1):76–78, 2005. [DOI] [PubMed] [Google Scholar]
- [47].Yang Lijun, Kress Benjamin T, Weber Harris J, Thiyagarajan Meenakshisundaram, Wang Baozhi, Deane Rashid, Benveniste Helene, Iliff Jeffrey J, and Nedergaard Maiken. Evaluating glymphatic pathway function utilizing clinically relevant intrathecal infusion of CSF tracer. J. Transl. Med, 11(1):107, 2013. [DOI] [PMC free article] [PubMed] [Google Scholar]
- [48].Moazen Mehran, Alazmani Ali, Rafferty Katherine, Liu Zi-Jun, Gustafson Jennifer, Cunningham Michael L, Fagan Michael J, and Herring Susan W. Intracranial pressure changes during mouse development. J. Biomech, 49 (1):123–126, 2016. [DOI] [PubMed] [Google Scholar]
- [49].Wang Xiaowei, Lou Nanhong, Eberhardt Allison, Yang Yujia, Kusk Peter, Xu Qiwu, Förstera Benjamin, Peng Sisi, Shi Meng, Guevara Antonio Ladrón-de, et al. An ocular glymphatic clearance system removes β-amyloid from the rodent eye. Sci. Transl. Med, 12(536), 2020. [DOI] [PMC free article] [PubMed] [Google Scholar]
- [50].Papadopoulos Marios C, Manley Geoffrey T, Krishna Sanjeev, and Verkman AS. Aquaporin-4 facilitates reabsorption of excess fluid in vasogenic brain edema. FASEB J, 18(11):1291–1293, 2004. [DOI] [PubMed] [Google Scholar]
- [51].Marmarou Anthony, Shulman Kenneth, and Rosende Roberto M. A nonlinear analysis of the cerebrospinal fluid system and intracranial pressure dynamics. J. Neurosurg, 48(3):332–344, 1978. [DOI] [PubMed] [Google Scholar]
- [52].Stergiopulos N, Young DF, and Rogge TR. Computer simulation of arterial flow with applications to arterial and aortic stenoses. J. Biomech, 25(12):1477–1488, 1992. ISSN 0021-9290. URL http://www.sciencedirect.com/science/article/pii/002192909290060E. [DOI] [PubMed] [Google Scholar]
- [53].Vignon-Clementel Irene E., Figueroa C. Alberto, Jansen Kenneth E., and Taylor Charles A.. Outflow boundary conditions for three-dimensional finite element modeling of blood flow and pressure in arteries. Comput. Methods Appl. Mech. Eng, 195(29):3776–3796, 2006. ISSN 0045-7825. [Google Scholar]
- [54].Tran Justin S, Schiavazzi Daniele E, Ramachandra Abhay B, Kahn Andrew M, and Marsden Alison L. Automated tuning for parameter identification and uncertainty quantification in multi-scale coronary simulations. Comput. Fluids, 142:128–138, 2017. [DOI] [PMC free article] [PubMed] [Google Scholar]
- [55].Burkhoff D, Alexander J Jr, and Schipke J. Assessment of windkessel as a model of aortic input impedance. Am. J. Physiol-Heart C, 255(4):H742–H753, 1988. [DOI] [PubMed] [Google Scholar]
- [56].Westerhof Nicolaas, Bosman Frederik, De Vries Cornells J, and Noordergraaf Abraham. Analog studies of the human systemic arterial tree. J. Biomech, 2(2):121–143, 1969. [DOI] [PubMed] [Google Scholar]
- [57].Westerhof Nicolaas, Elzinga GIJS, and Sipkema Pieter. An artificial arterial system for pumping hearts. J. Appl. Physiol, 31(5):776–781, 1971. [DOI] [PubMed] [Google Scholar]
- [58].Ray Lori, Iliff Jeffrey J, and Heys Jeffrey J. Analysis of convective and diffusive transport in the brain interstitium. Fluids Barriers CNS, pages 1–18, March 2019. [DOI] [PMC free article] [PubMed] [Google Scholar]
- [59].Wardlaw Joanna M, Benveniste Helene, Nedergaard Maiken, Zlokovic Berislav V, Mestre Humberto, Lee Hedok, Doubal Fergus N, Brown Rosalind, Ramirez Joel, MacIntosh Bradley J, et al. Perivascular spaces in the brain: anatomy, physiology and pathology. Nature Reviews Neurology, pages 1–17, 2020. [DOI] [PubMed] [Google Scholar]
- [60].O’Rourke Michael. Arterial stiffness, systolic blood pressure, and logical treatment of arterial hypertension. Hypertension, 15(4):339–347, 1990. [DOI] [PubMed] [Google Scholar]
- [61].O’Rourke Michael F and Hashimoto Junichiro. Mechanical factors in arterial aging: a clinical perspective. Journal of the American College of Cardiology, 50(1):1–13, 2007. [DOI] [PubMed] [Google Scholar]
- [62].Kress Benjamin T, Iliff Jeffrey J, Xia Maosheng, Wang Minghuan, Wei Helen S, Zeppenfeld Douglas, Xie Lulu, Kang Hongyi, Xu Qiwu, Liew Jason A, Plog Benjamin A, Ding Fengfei, Deane Rashid, and Nedergaard Maiken. Impairment of paravascular clearance pathways in the aging brain. Ann Neurol, 76(6):845–861, September 2014. [DOI] [PMC free article] [PubMed] [Google Scholar]
- [63].Hughes Timothy M, Kuller Lewis H, Barinas-Mitchell Emma J M, Mackey Rachel H, McDade Eric M, Klunk William E, Aizenstein Howard J, Cohen Ann D, Snitz Beth E, Mathis Chester A, DeKosky Steven T, and Lopez Oscar L. Pulse wave velocity is associated with β-amyloid deposition in the brains of very elderly adults. Neurology, 81(19):1711, November 2013. [DOI] [PMC free article] [PubMed] [Google Scholar]
- [64].Kiviniemi Vesa, Wang Xindi, Korhonen Vesa, Keinänen Tuija, Tuovinen Timo, Autio Joonas, LeVan Pierre, Keilholz Shella, Zang Yu-Feng, Hennig Jürgen, et al. Ultra-fast magnetic resonance encephalography of physiological brain activity–glymphatic pulsation mechanisms? Journal of Cerebral Blood Flow & Metabolism, 36(6):1033–1045, 2016. [DOI] [PMC free article] [PubMed] [Google Scholar]
- [65].Fultz NE, Bonmassar G, Setsompop K, Stickgold RA, Rosen BR, Polimeni JR, and Lewis LD. Coupled electrophysiological, hemodynamic, and cerebrospinal fluid oscillations in human sleep. Science, 2019. [DOI] [PMC free article] [PubMed] [Google Scholar]
- [66].Xavier Anna LR, Hauglund Natalie Linea, Holstein-Rathlou Stephanie von, Li Qianliang, Sanggaard Simon, Lou Nanhong, Lundgaard Iben, and Nedergaard Maiken. Cannula implantation into the cisterna magna of rodents. J. Visualized Exp, (135):e57378, 2018. [DOI] [PMC free article] [PubMed] [Google Scholar]