Abstract
In studies with human participants, exosome-based biospecimens can facilitate unique biomarker assessments. As exosome cargos can include mitochondrial components, there is interest in using exosomes to inform the status of an individual’s mitochondria. Here, we evaluated whether targeted pharmacologic manipulations could influence the quantity of exosomes shed by cells, and whether these manipulations could impact their mitochondrial cargos. We treated human SH-SY5Y cells with bafilomycin A1, which interferes with general autophagy and mitophagy by inhibiting lysosome acidification and lysosome-autophagosome fusion; deferiprone (DFP), which enhances receptor-mediated mitophagy; or both. Exosome fractions from treated cells were harvested from the cell medium and analyzed for content including mitochondria-derived components. We found bafilomycin increased particle yields, and a combination of bafilomycin plus DFP consistently increased particle yields and mitochondria-associated content. Specifically, the exosome fractions from the bafilomycin plus DFP-treated cells contained more mitochondrial DNA (mtDNA), mtDNA-derived mRNA transcripts, and citrate synthase protein. Our data suggest pharmacologic manipulations that enhance mitophagy initiation, while inhibiting the lysosomal digestion of autophagosomes and multivesicular bodies, could potentially enhance the sensitivity of exosome-based biomarker assays intended to inform the status of an individual’s mitochondria.
Keywords: biomarker, exosome, mitochondria, mitochondrial DNA, mitophagy
1. Introduction
Altered mitochondrial function contributes to several common neurodegenerative diseases, including Alzheimer’s disease (AD) [1]. Because of this, efforts are underway to develop mitochondria-targeted AD treatments [2]. Of course, we currently cannot directly access brain mitochondria from living AD patients, which limits a precise characterization of their in vivo status and role in the disease, as well as restricts our ability to demonstrate target engagement by mitochondria-directed interventions. Workarounds include analyzing mitochondria from AD autopsy brains, accessible peripheral tissues, cytoplasmic hybrid cells, and animal models [3–8]. Neuroimaging approaches can also inform, but generally yield indirect data or apply techniques that are not widely available [9–14].
Exosomes, a particular type of extracellular vesicle (EV), could potentially provide insight into the state of brain mitochondria in living individuals. Exosomes are 50–150 nm vesicles shed by cells [15–17]. They begin to develop when intracellular structures called early endosomes invaginate their membranes to produce intraluminal vesicles (ILVs). During the invagination process ILVs incorporate pockets of cytoplasm that contain various cell components including DNA, RNA, and protein. ILV-containing endosomes, which are called multivesicular bodies (MVBs), can fuse with lysosomes. Alternatively, cells can direct MVBs to the plasma membrane. This facilitates the release of ILVs, which are now formally considered exosomes, into the extracellular space where they can diffuse through adjacent fluids and even access the blood. Various studies with human participants demonstrate exosome-based biospecimens can facilitate unique biomarker assessments, and some claim it is possible to strategically harvest brain-derived exosomes from the blood and examine their contents [18, 19].
Exosomes can carry mitochondria-derived cargo, including mtDNA, mtDNA-derived mRNA transcripts, and mitochondrial-localized proteins [20]. These materials may access MVBs via structures called mitochondrial-derived vesicles (MDVs), 70–150 nm structures that form through a process of mitochondrial membrane evagination [21–23]. It is assumed MDVs in MVBs experience the same fate, digestion in lysosomes or release as exosomes [24], as other MVB ILVs.
Unfavorable signal-to-noise ratios can confound measurements of exosome mitochondrial cargos [20]. To try and address this technical barrier, we considered whether it is possible to increase or enrich the amount of mitochondria-derived material exosome fractions contain. Accordingly, we treated human SH-SY5Y neuroblastoma cells with bafilomycin A1 (referred to simply as bafilomycin), deferiprone (DFP), or both. Bafilomycin blocks autophagy, including its mitophagy subtype, by preventing lysosome acidification and autophagosome-lysosome fusion [25]. DFP, an iron chelator, interestingly promotes receptor-mediated mitophagy [26]. We hypothesized these manipulations, alone or in combination, would increase exosome fraction mitochondrial content. Specifically, we predicted bafilomycin treatment would shift MVBs away from lysosome digestion and towards the plasma membrane, with a subsequent increase in exosome release and the amount of mitochondrial material in the exosome fraction. We also predicted that because DFP simulates mitophagy while bafilomycin blocks mitophagy, co-exposures would divert mitochondrial material to MDVs, MVBs, and finally mitochondrially-enriched exosomes.
2. Materials and Methods
Many of the methods used in this study were described in a previous manuscript [20]. Here, for ease of reference, we also include descriptions of those methods in this section.
2.1. Cell culture
Exosome-free fetal bovine serum (FBS) was generated from standard FBS (Cat. No. PS-FB1, Peak Serum) by ultracentrifugation at 120,000 g overnight at 4 °C. The supernatant was filtered through a 0.22 mm filter (Ultrafree-Centrifugal Filter Unit, Millipore), aliquoted into 50 ml tubes, and stored at −20 °C prior to use. SH-SY5Y neuroblastoma cells were grown in high glucose DMEM (Sigma-Aldrich) supplemented with 10% exosome-free (FBS) and 1% of a penicillin-streptomycin stock (catalogue number 30–001-CI, Fisher Scientific). Cells were cultured at 37 °C in humidified air containing 5% CO2.
To inhibit autophagy, SH-SY5Y cells were treated with 50 nM bafilomycin A1 for 24 hours. To induce mitophagy, SH-SY5Y cells were treated with 1 mM DFP for 24 hours. For experiments utilizing both manipulations, cells were placed in 1 mM DFP for 24 hours, with 50 nM bafilomycin added for the final 16 hours. For the combination treatment, addition of the bafilomycin was delayed for 8 hours to ensure mitophagy initiation was able to occur [27].
2.2. Exosome harvesting
SH-SY5Y cell culture medium was centrifuged at 3000 × g for 15 minutes to remove cells and cell debris. The supernatant was filtered through a 0.22 mm filter and concentrated using 100 kDa cutoff Centricon Plus-70 Centrifugal filters (Millipore, Cat. No. UFC710008). Next, ExoQuick exosome precipitation solution (1:5, SBI system Biosciences, Cat. No. EXOTC10A-1) was added to the concentrated medium, and the mixture was precipitated at 4°C for at least 12 hours. Exosomes were harvested by centrifuging the mixture at 4°C at 1,500 × g for 30 minutes and the exosome pellet was re-suspended in 100 μl ice cold phosphate-buffered saline (PBS).
2.3. Nanoparticle tracking analysis
Particle concentrations and size distributions were analyzed by Nanoparticle tracking analysis (NTA) using a NanoSight LM10 instrument (Malvern Panalytical). Exosomes precipitated from SH-SY5Y cell culture medium were suspended in PBS. The mixture was further diluted as needed with PBS to obtain a concentration of 108 particles per ml. The laser sample chamber was loaded with approximately 500 μl of exosome solution using a 1 ml disposable syringe and the camera level was set to 14. Three 1-minute videos were recorded for each sample. Videos were analyzed with NTA 2.3 software (Malvern Panalytical).
2.4. Mitochondrial isolation and mtDNA purification
To remove free DNA contamination, prior to lysis we incubated exosomes with 1 μl of DNase I (DNA-free™ DNA Removal Kit, Invitrogen, Cat. No. AM1906) for 20 minutes at 37°C. The DNase I was then removed according to the kit instructions and the DNA remaining within the exosomes was extracted using a standard phenol-chloroform-isoamyl alcohol protocol. The absolute amount of mtDNA and nuclear DNA was quantified by real-time quantitative PCR as previously described [28]. Briefly, DNA was isolated from DNase I treated SH-SY5Y cell derived exosomes. Next, gradient dilution standards were prepared for the absolute quantification of mtDNA and nuclear DNA using specific human mitochondrial genome primers [28] and nuclear genome primers [29]. Finally, mtDNA and nuclear DNA copy numbers were measured by real time quantitative PCR.
2.5. Reverse transcription quantitative PCR
The total RNA from the SH-SY5Y cell-derived exosomes was extracted using the TRIzol LS Reagent (Life Technologies, Cat. No. 15596018). The RNA pellet was washed in 75% ethanol and re-suspended in RNAase-free water. To remove DNA contamination following RNA extraction but prior to cDNA synthesis we treated RNA samples with 1 μl DNase I (DNA-free™ DNA Removal Kit, Invitrogen, Cat. No. AM1906) for 20 minutes at 37° C. DNase I was subsequently removed per kit instructions. To perform reverse transcription (RT), we used an iScript RT qPCR master mix (Bio-Rad, Cat. No. 1708840). RT PCR was performed using a MyCycler thermal cycler (BioRad). cDNA amplifications utilized the ND2, CO2, humanin, and β-actin primer sets are descried in our previous study [20]. RT-PCR products were electrophoresed through 1% agarose gels containing ethidium bromide and visualized under UV light. Band intensities were quantified with Image J software.
2.6. Immunochemistry
Pelleted exosomes were resuspended in PBS and lysed in ice cold RIPA buffer (50 mM Tris-HCl, 150 mM NaCl, 1 mM EDTA, 1% NP-40, pH 7.4) containing protease inhibitors (Thermofisher). For some samples, to eliminate free protein contamination exosome pellets were additionally incubated with pre-warmed (37 °C) trypsin (1 mg/ml) for 5 minutes at room temperature before lysis; to inactivate the trypsin, we added 6x SDS Western blot loading buffer to each trypsinized sample and heated at 95°C for 10 minutes.
Samples were boiled in a loading buffer containing SDS and β-mercaptoethanol at 95 °C for 10 minutes. Equal amounts of protein were resolved through SDS-PAGE using 4–15% Criterion TGX Tris-glycine polyacrylamide gels (Bio-Rad). Gel proteins were transferred to PVDF membranes (Cat. No. 10061–492, GE Healthcare). Membranes were blocked in 5% bovine serum albumin (BSA) with PBS-Tween 20 (PBST) at room temperature and probed with primary antibodies to CD9 (1:1000, Cell Signaling, Cat. No. 13174), Tsg101(1:1000, Abcam, Cat. No. ab83), calnexin (1:1000, Cell Signaling, Cat.No. 2679), GM130 (1:1000, Cell Signaling, Cat. No. 12480), LCB3 (1:1000, Cell Signaling, Cat.No. 3868), BNIP3 (1:2000, Cell Signaling, Cat.No. 44060), PINK1 (1:1000, Cell Signaling, Cat.No. 6946), ubiquitin (1:1000, Abcam, Cat. No. 134953), amyloid precursor protein (APP) (1:1000, BioLegend, Cat. No. 803003), citrate synthase (CS) (1:1000, Cell Signaling, Cat. No. 14309) and fibroblast growth factor 21 (FGF 21) (1:2000, Invitrogen, Cat. No. MA5–25558), in 5% BSA with PBST overnight at 4°C. Membranes were washed 3 times with PBST and placed in secondary antibody at 1:2000 dilutions in 5% non-fat milk with PBST for 1 hour at room temperature. Membranes were washed 3 times with PBST and incubated with Super Signal West Femto Chemiluminesence Reagent (Life Technologies, Cat. No. 34095). Images were captured using a Chemidoc imaging station (Bio-Rad). Band intensities were quantified with Image J software.
2.7. Statistical Analyses
Eight separate experiments were performed for each assay. Data were analyzed using GraphPad Prism 8 software (GraphPad Software La Jolla, CA, USA). Results are represented as mean and standard error (mean ± SE). Statistical significance was determined using one-way ANOVA with Tukey’s multiple comparisons test. P values less than 0.05 were considered statistically significant.
3. Results
We cultured SH-SY5Y cells in medium supplemented with bafilomycin, DFP, bafilomycin plus DFP, or neither compound. The individual bafilomycin and DFP treatments lasted 24 hours, and for the combination condition bafilomycin was added 8 hours after initiating a 24-hour exposure to DFP. We validated the ability of this regimen to inhibit lysosome function and enhance mitophagy flux in the SH-SY5Y cells themselves; in SH-SY5Y cell lysates bafilomycin increased the LC3BII to LC3BI ratio, while DFP increased BNIP3 but not PINK1 protein levels (data not shown). Upon completing the treatments, we collected the conditioned medium, prepared exosome fractions, and verified these SH-SY5Y changes extended to their exosomes. Not surprisingly, bafilomycin increased the exosome LC3BII to LC3BI ratio (Fig. 1A–B). DFP alone resulted in a trend towards increased exosome LC3BI (318% greater than the control, p=0.19) (Fig. 1A, C). Bafilomycin and DFP, in combination, induced a robust increase in exosome LC3BI and LC3BII, and increased the LC3BII to LC3BI ratio (Fig. 1A–D). Exosome PINK1 levels were comparable across the different treatments, while exosome BNIP3 levels were elevated by the bafilomycin plus DFP combination (Fig. 1A, E–F).
Figure 1. Exosomes generated by cells treated with bafilomycin, DFP, or both reflect changes seen in the cells themselves.
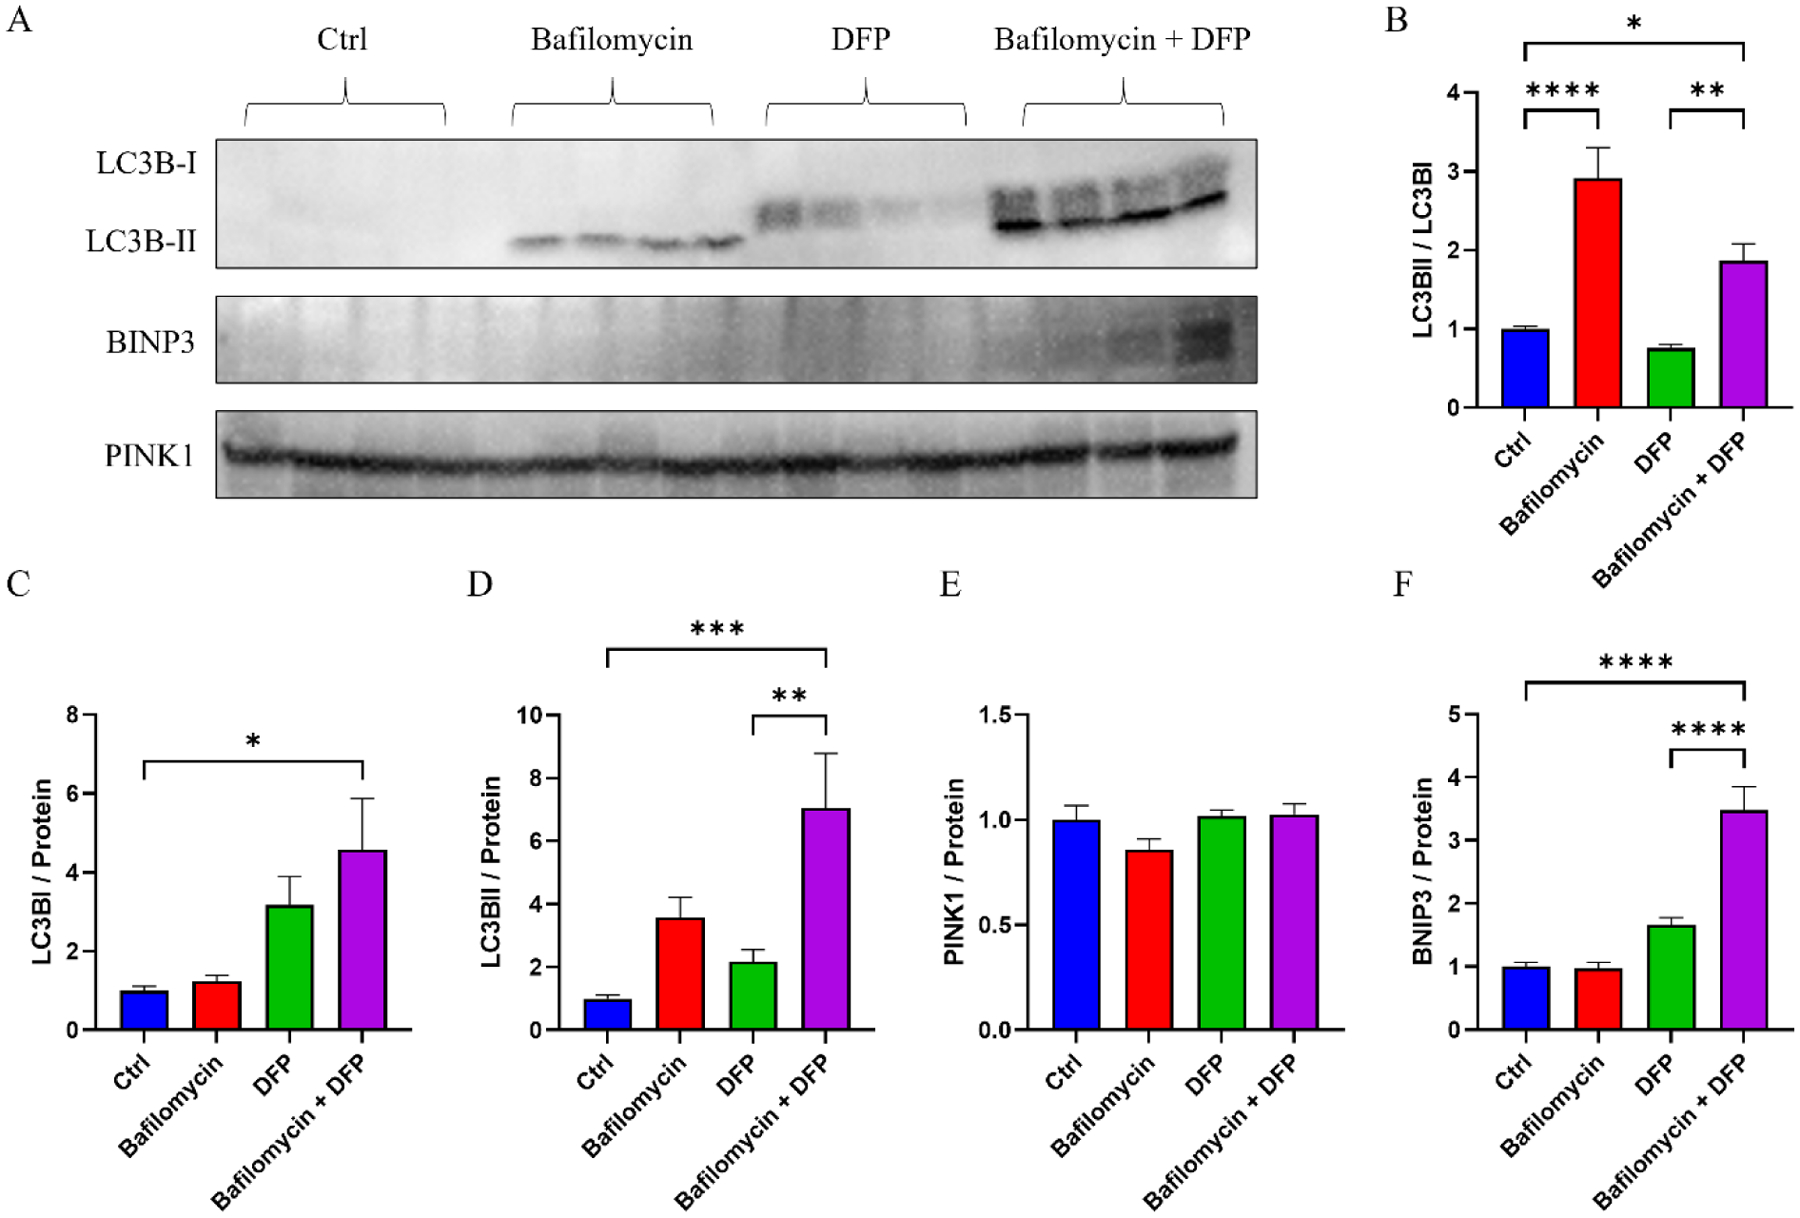
(A) Western blots of exosome LC3BI, LC3BII, BNIP3, and PINK1 proteins from SH-SY5Y cells treated with bafilomycin, DFP, or both. (B) LC3BII/LC3BI ratios. (C) LC3B1 protein levels. (D) LC3BII protein levels. (E) PINK1 protein levels. (F) BNIP3 protein levels. Data represent means ± SEM, *p < 0.05, ***p < 0.001, ****p < 0.0001, as analyzed through one-way ANOVA with Tukey’s multiple comparisons test; significant changes relative to the no-treatment control (Ctrl), and between the DFP and bafilomycin+DFP conditions, are indicated.
We used nanoparticle tracking analysis (NTA) to characterize the size and quantity of the exosome yields. The mean particle size was comparable between the groups (Fig. 2A). However, the conditioned medium from cells maintained in bafilomycin contained more exosomes than the medium from the control condition. Adding DFP to bafilomycin further increased the exosome yield, to 214% of the no-treatment control, although DFP by itself did not significantly increase the exosome yield (Figure 2B).
Figure 2. Effect of bafilomycin, DFP, or both on exosome secretion.
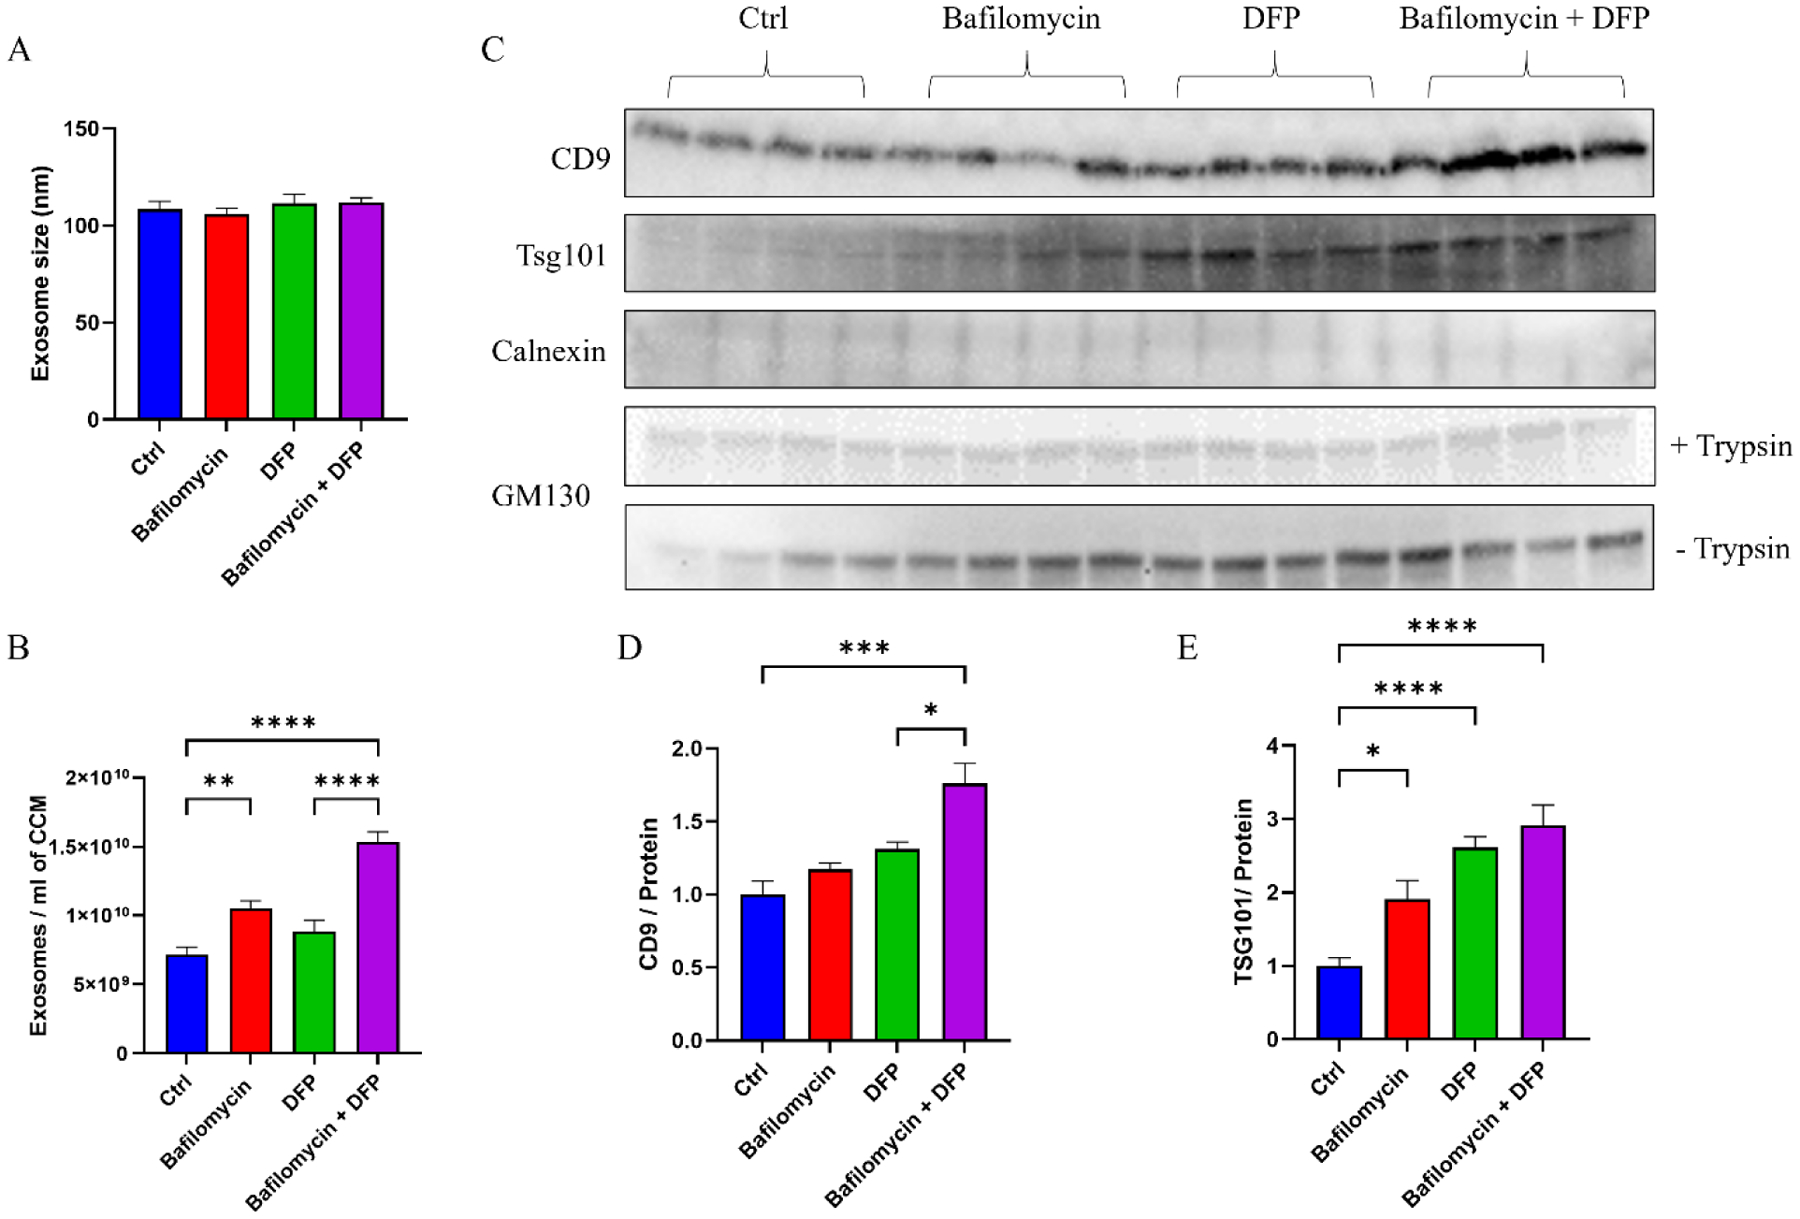
SH-SY5Y cells were treated with 50 nM bafilomycin for 24 hours, 1 mM DFP for 24 hours, or DFP for 24 hours with bafilomycin present for the final 16 hours. (A) Exosome size. (B) Number of exosome particles per ml of cell culture medium (CCM). (C) Western blots of exosome (CD9 and Tsg101), endoplasmic reticulum (calnexin), and Golgi body (GM130) markers. (D) CD9 protein levels. (E) TSG101 protein levels. Data represent means ± SEM, *p < 0.05, **p < 0.01, ***p < 0.001, ****p < 0.0001, as analyzed through one-way ANOVA with Tukey’s multiple comparisons test; significant changes relative to the no-treatment control (Ctrl), and between the DFP and bafilomycin+DFP conditions, are indicated.
To further assess the integrity of our exosome fractions, we generated exosome pellets and treated the pellets with trypsin to digest free protein. The trypsin was inactivated, the pellets were lysed, and pellet proteins were extracted for immunochemical analyses. Levels of the exosome protein CD9 were higher in the conditioned medium of cells grown in bafilomycin plus DFP, while levels of the exosome protein TSG101 were elevated in the conditioned medium of cells maintained in bafilomycin, DFP, or both (Figure 2C–E). Levels of calnexin, a marker of endoplasmic reticulum contamination, were consistently below the limit of detection. GM130, a marker of Golgi contamination, was consistently observed but the amount of GM130 was constant across the conditions (Figure 2C).
While the amount of DNA present in the exosome fractions was increased with DFP alone, bafilomycin plus DFP induced a far more robust 600% increase in total DNA (Fig. 3A). The bafilomycin-DFP combination also increased the exosome total RNA (300%) and protein (150%) yields (Fig. 3B–C). The bafilomycin-DFP combination increased the DNA per exosome ratio by 255%, although we did not see a significant increase in either the RNA per exosome or protein per exosome ratios (Fig. 3D–F).
Figure 3. Effect of bafilomycin, DFP, or both on general exosome cargos.
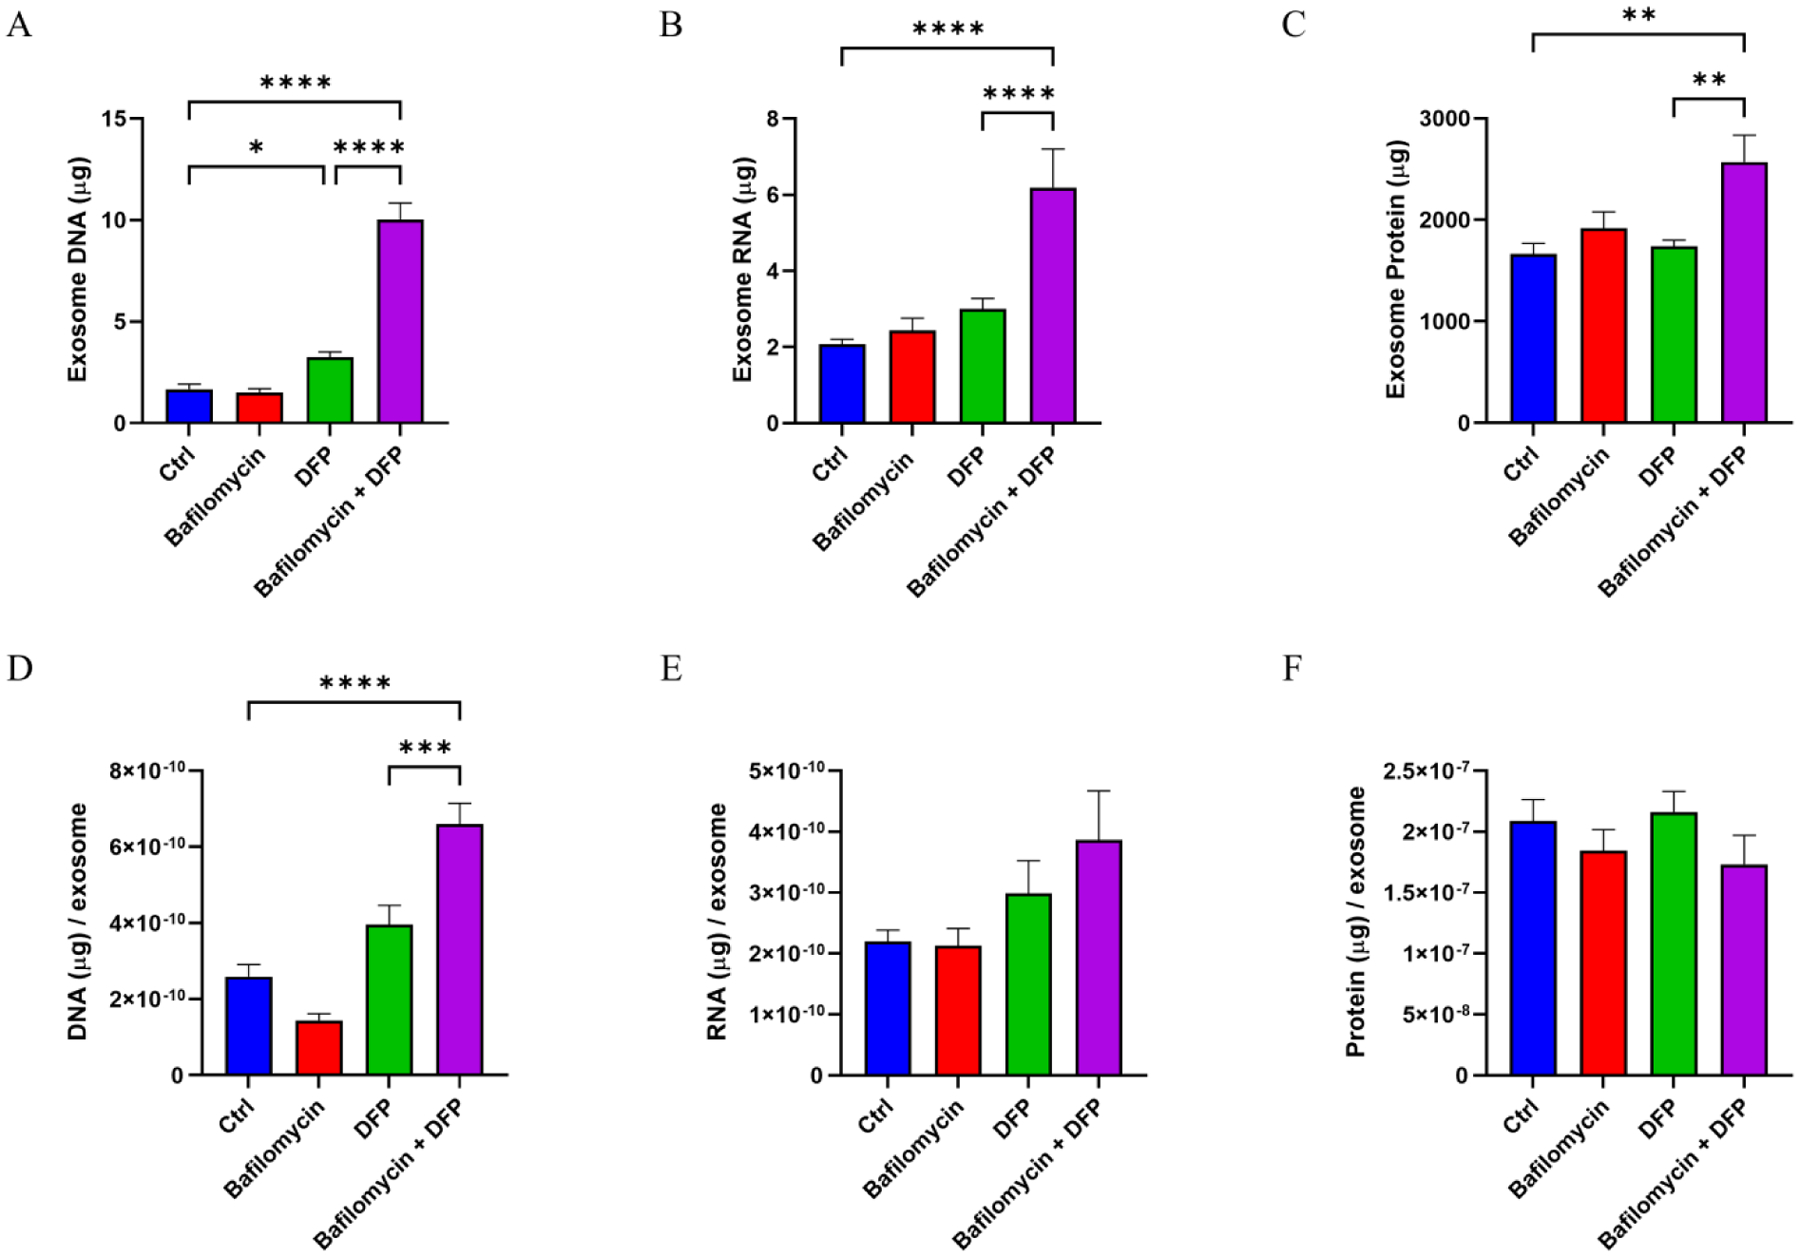
(A) Total DNA in the harvested exosomes. (B) Total RNA in the harvested exosomes. (C) Total protein in the harvested exosomes. (D) Total DNA per exosome. (E) Total RNA per exosome. (F) Total protein per exosome. Data represent means ± SEM, *p < 0.05, **p < 0.01, ****p < 0.0001, as analyzed through one-way ANOVA with Tukey’s multiple comparisons test; significant changes relative to the no-treatment control (Ctrl), and between the DFP and bafilomycin+DFP conditions, are indicated.
Next, to specifically determine if the DNA contained in our exosome fractions was present within the exosomes themselves or a free contaminant, we treated exosome fractions with DNase I prior to particle lysis and DNA extraction. In this case, neither bafilomycin nor DFP clearly increased the estimated amount of mtDNA or nuclear DNA. However, the bafilomycin plus DFP combination robustly increased, relative to the control, the estimated amount of mtDNA (304% increase) and nuclear DNA (735% increase) (Fig. 4A–B). In this case, therefore, the mtDNA to nuclear DNA ratio fell (Fig 4C).
Figure 4. Effect of bafilomycin, DFP, or both on exosome fraction mtDNA versus nuclear DNA content.
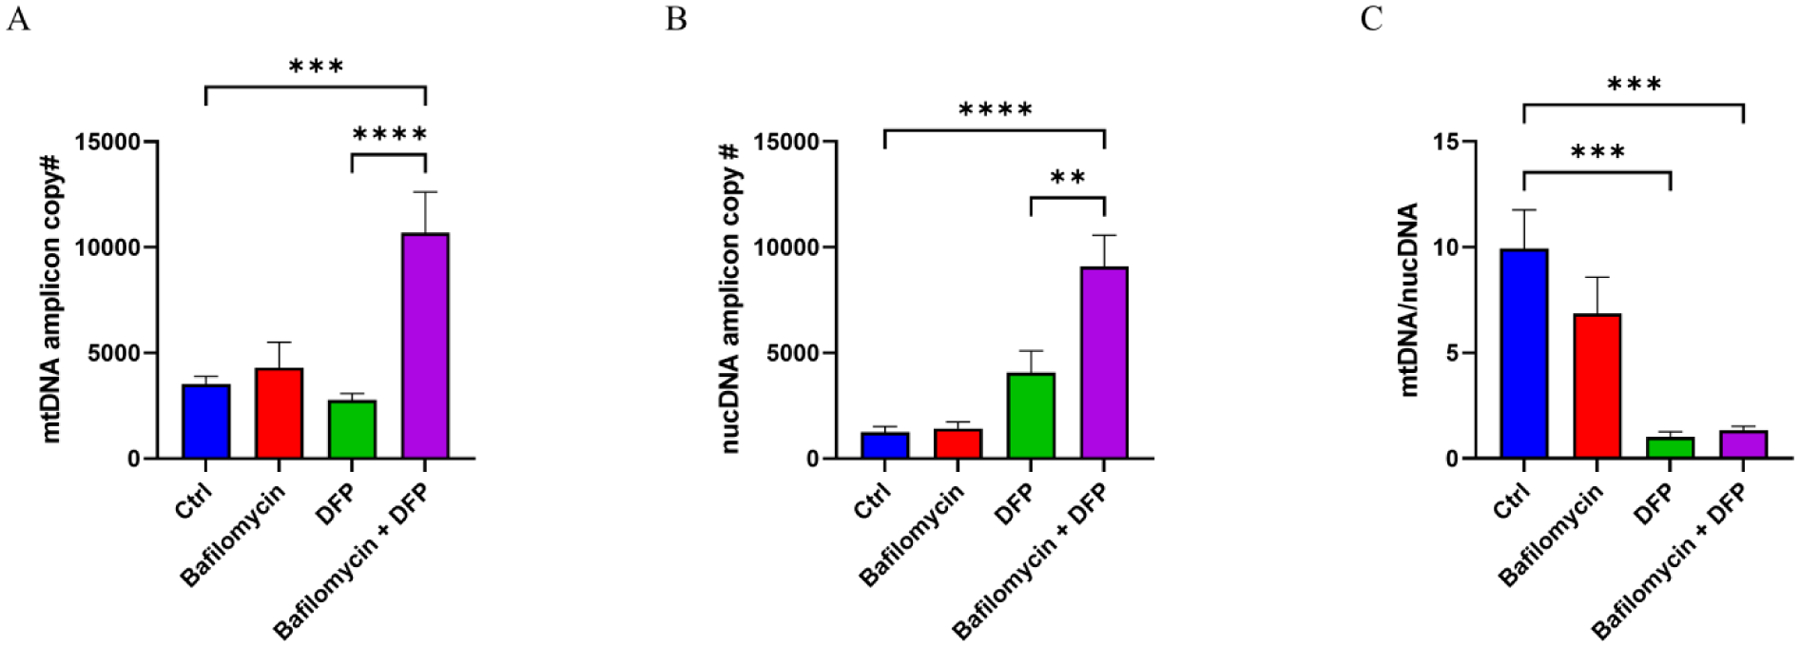
As exosome DNA likely consists of fragments, we refer to these data as “amplicon” copy numbers and use them as surrogates for levels of mtDNA and nuclear DNA contained in the collected exosome particles. (A) mtDNA amplicon copy number. (B) nuclear DNA (nucDNA) amplicon copy number. (C) The mtDNA/nucDNA amplicon copy number fell with the DFP and bafilomycin plus DFP treatments, indicating under those conditions the increase in nuclear DNA exceeded the increase in mtDNA. Data represent means ± SEM, ***p < 0.001 and ****p < 0.0001, as analyzed through one-way ANOVA with Tukey’s multiple comparisons test; significant changes relative to the no-treatment control (Ctrl), and between the DFP and bafilomycin+DFP conditions, are indicated.
We quantified the amount of mtDNA-encoded mRNA that was present within the exosomes. To ensure amplification was not confounded by the presence of co-precipitated mtDNA or nuclear mitochondrial DNA (NUMT) sequences, before generating cDNA we treated the RNA samples with DNAase I. Our amplification primers targeted transcripts to humanin, ND2, and CO2. Neither bafilomycin nor DFP, when used separately, revealed an increase in the transcripts for any of the targets. This was not the case with the bafilomycin plus DFP combination, as the quantification data indicated those exosomes contained more humanin (214% increase over the control), ND2 (201% increase over the control), and CO2 (255% increase over the control) mRNA (Fig. 5A–D).
Figure 5. Effect of bafilomycin, DFP, or both on exosome fraction mtDNA-templated mRNA transcripts.
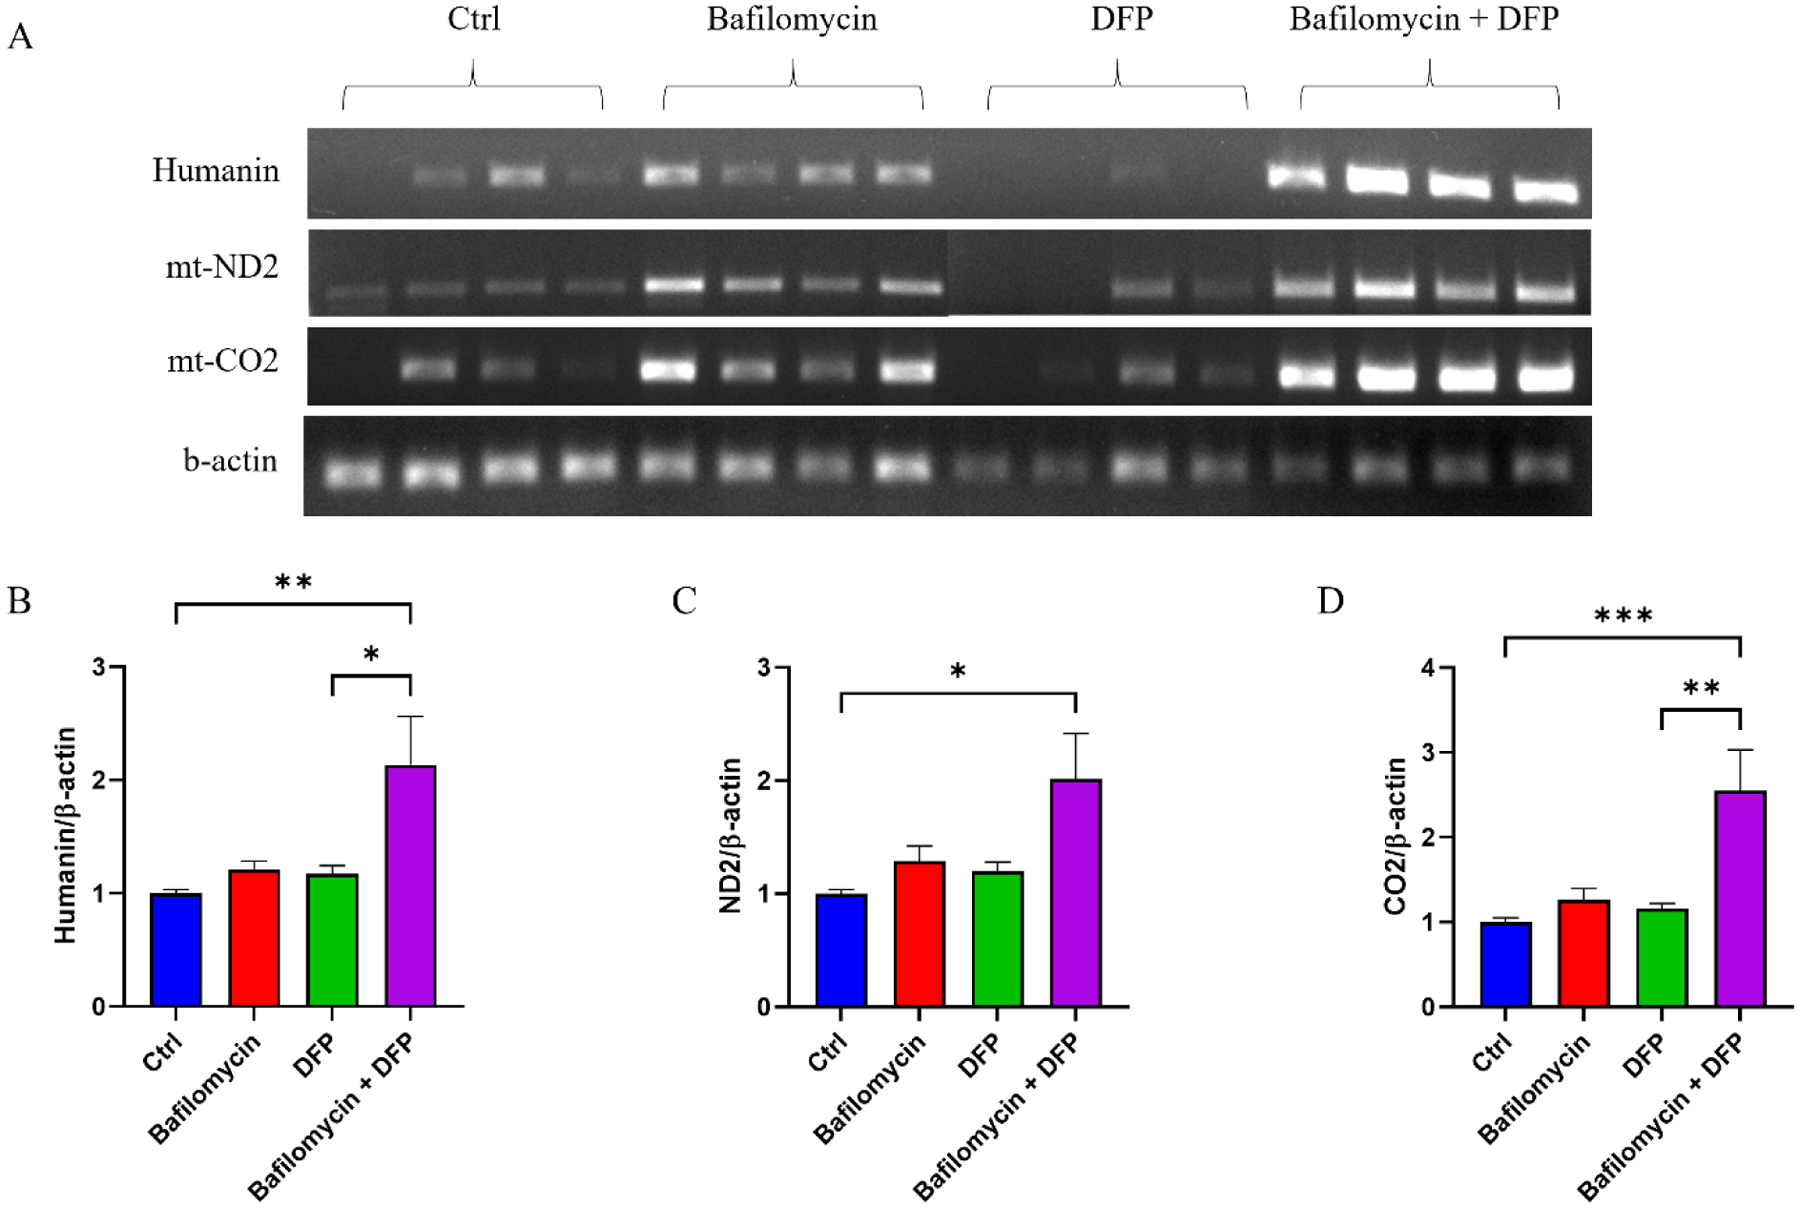
(A) Representative ethidium bromide-stained agarose gel showing amplified mtDNA-templated mRNA transcripts (humanin, ND2, and CO2) as well as amplified β-actin. (B) Relative levels of humanin cDNA, normalized to β-actin cDNA, for each condition. (C) Relative levels of ND2 cDNA, normalized to β-actin cDNA, for each condition. (D) Relative levels of ND2 cDNA, normalized to β-actin cDNA, for each condition. Data represent means ± SEM, *p < 0.05, **p < 0.01, ***p < 0.001, as analyzed through one-way ANOVA with Tukey’s multiple comparisons test; significant changes relative to the no-treatment control (Ctrl), and between the DFP and bafilomycin+DFP conditions, are indicated.
In terms of protein content, cells treated with bafilomycin plus DFP contained an elevated amount of ubiquitinated protein (Fig. 6A–B). Consistent with previous reports [30], APP was present in our exosomes and bafilomycin alone and bafilomycin plus DFP increased the detected levels (271% increase in the bafilomycin treatment, 248% increase in the combination treatment) (Fig. 6A, C). Although neither bafilomycin nor DFP alone increased the amount of CS, the combination treatment induced a 192% increase in exosome CS protein (Fig. 6A, D). Similarly, although neither bafilomycin nor DFP alone increased the amount of FGF21, the combination treatment induced a 141% increase in exosome FGF21 protein (Fig. 6A, E).
Figure 6. Effect of bafilomycin, DFP, or both on specific exosome fraction proteins.
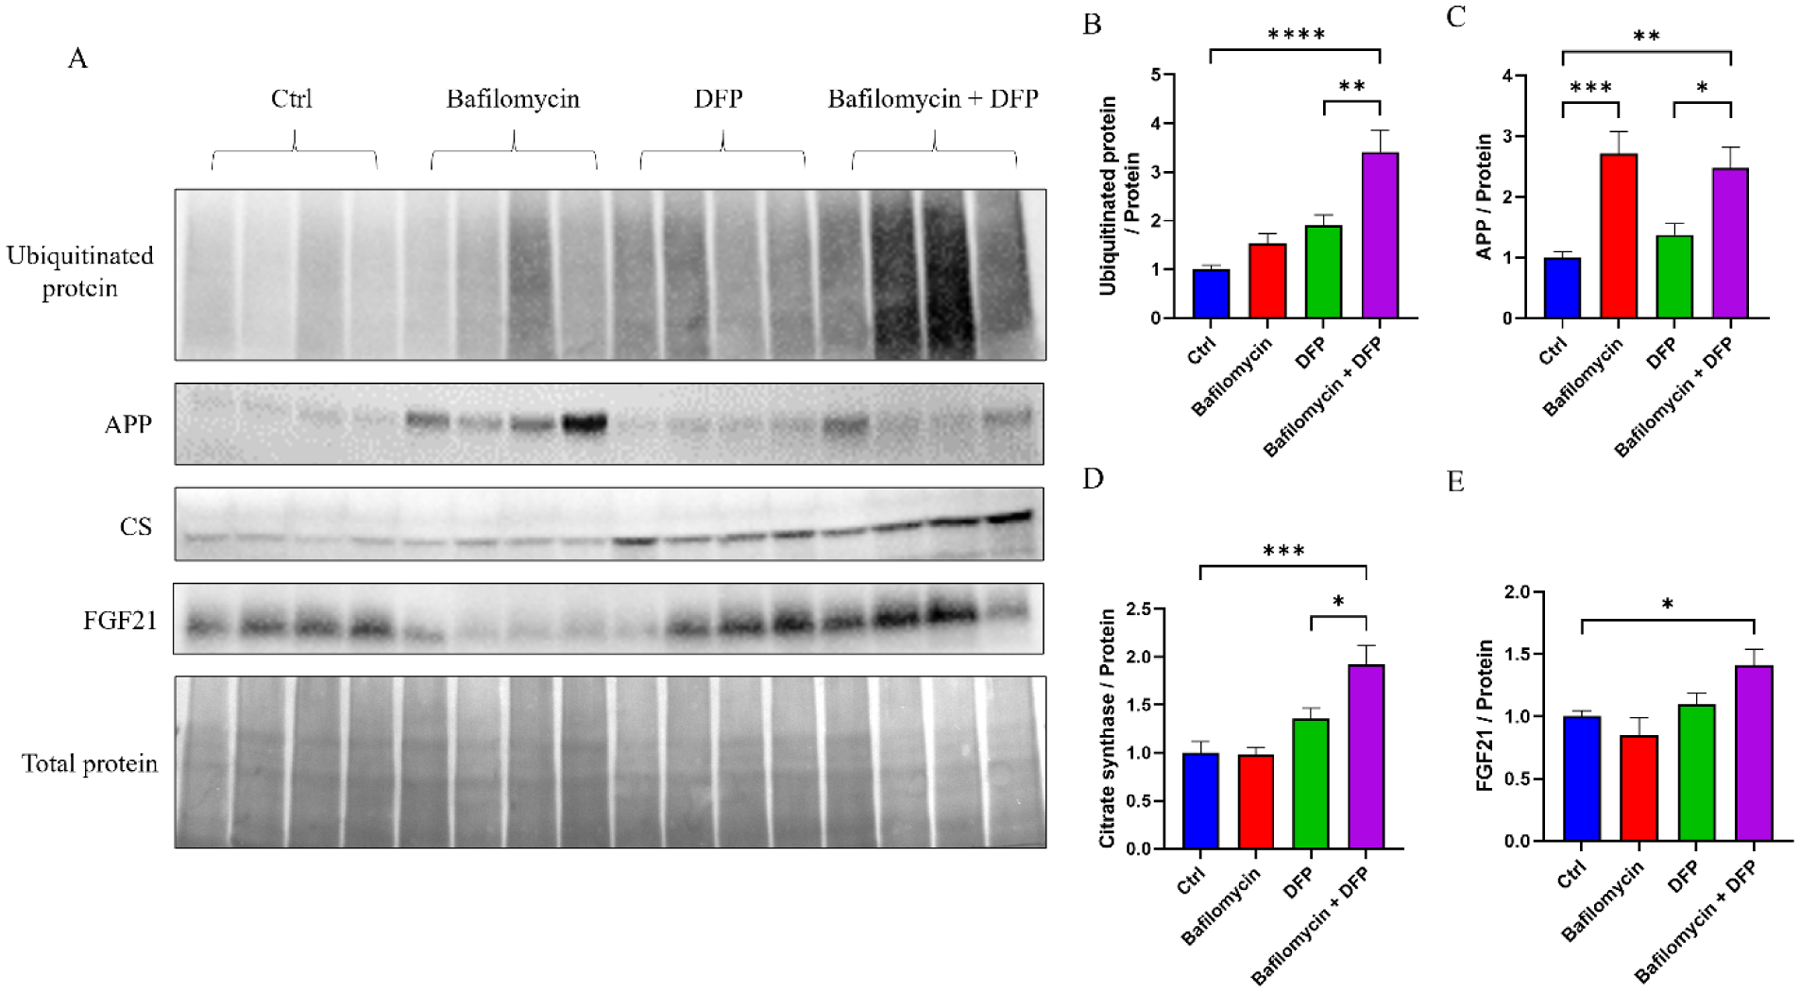
(A) Western blots showing amounts of exosome ubiquitinated protein, APP, CS protein, FGF21 protein, and total protein; the bottom panel used amido black to define the amount of total protein and served as a loading control. (B) Relative amounts of ubiquitinated protein normalized to total protein. (C) Relative amounts of APP normalized to total protein. (D) Relative amounts of CS protein normalized to total protein. (E) Relative amounts of FGF21 protein normalized to total protein. Data represent means ± SEM, *p < 0.05, **p < 0.01, ***p < 0.001, ****p < 0.0001, as analyzed through one-way ANOVA with Tukey’s multiple comparisons test; significant changes relative to the no-treatment control (Ctrl), and between the DFP and bafilomycin+DFP conditions, are indicated.
4. Discussion
We consistently observed that SH-SY5Y cells concomitantly treated with bafilomycin and DFP exhibited an increase in both exosome fraction particle number and, in some instances, mitochondrial cargo. Bafilomycin alone increased exosome fraction particle number, but to a lesser extent than the combination, and did not increase per exosome mitochondrial cargo. This suggests the bafilomycin plus DFP combination, in addition to increasing exosome release, uniquely enriched the mitochondrial content of at least some individual exosomes.
Consistent with other investigators, we found the status of exosome release and content predictably reflects the status of the cells that produce them. Previous studies reported bafilomycin can increase exosome yields [31], presumably by redirecting MVBs from lysosomal digestion and towards MVB-plasma membrane fusion with subsequent ILV release. In our study, the bafilomycin-induced rise in particle concentration we saw appeared partly driven by an increase in the number of non-ILV derived particles that were present, as the CD9 level did not statistically change. Tsg101 protein did increase, though, which indicates the concentration of true exosomes rose in the exosome fraction.
Concomitant bafilomycin plus DFP treatment increased the amount of DNA, RNA, and protein but resulted in a relative decrease, as opposed to increase, in the mtDNA:nDNA ratio. We previously reported exosome DNA, including exosome mtDNA, exists in short fragments [20]. Perhaps this contributes in some way to the apparent lesser degree of mtDNA enrichment relative to nuclear DNA enrichment.
The bafilomycin plus DFP treatment produced a robust and quantitatively consistent increase in exosome mtDNA-derived mRNAs. This included an increase in the mRNA for humanin, which is contained within a larger mtDNA rRNA gene and potentially translated on either mitochondrial or cytoplasmic ribosomes [32]. We cannot determine whether the increase in mtDNA-encoded mRNA transcripts solely reflects an increased number of exosomes in the exosome fraction, with an unchanged amount of mtDNA-encoded mRNAs within individual exosomes, or an increased exosome concentration with an enriched amount of individual exosome mtDNA-encoded mRNAs.
The fact that bafilomycin plus DFP, but not bafilomycin alone, increased the level of ubiquitinated exosome protein suggests some degree of exosome enrichment with mitochondrial proteins occurred. Levels of APP, a protein that only partly colocalizes with mitochondria [33, 34], rose equivalently with the bafilomycin and bafilomycin plus DFP treatments, which indicates much of the APP increase resulted from a general autophagy inhibition. CS, which is primarily found within mitochondria, robustly increased with the combination treatment as did FGF21. FGF21 is a secreted protein whose levels reflect mitochondrial function despite its lack of mitochondrial colocalization [35, 36]. Collectively, this pattern of protein changes within our exosomes suggests the pharmacologic manipulations we tested may influence exosome protein content through multiple mechanisms. This could include strategic protein transfers from mitochondria to MVBs, a property previously attributed to MDVs [21], or an unintended downstream effect of a pharmacologically altered mitochondrial or overall cell environment.
Our observations suggest a model in which inhibiting mitophagy and autophagy by blocking lysosome acidification and autophagosome-lysosome fusion diverts MVBs to the plasma membrane. This enhances exosome release and increases the fluid exosome concentration. While it is possible blocking lysosome acidification and autophagosome-lysosome fusion also causes the release of whole mitochondria, because mitochondria are much larger than exosomes augmentation of the exosome fraction mitochondrial content through direct mitochondrial release would likely require fissioned mitochondria. Meanwhile, concomitant initiation and inhibition of mitophagy may divert mitochondrial components to MDVs, which access MVBs to enrich the MDV to non-MDV ILV particle ratio. This could occur prior to or after incorporation of mitochondria into autophagosomes. Collectively, this combination of manipulations, in addition to increasing the number of exosomes cells produce, for at least some parameters also enriches the amount of mitochondrial cargo contained within the exosomes themselves (Fig. 7).
Figure 7. Proposed model of how mitophagy and autophagy inhibition at the lysosome or autophagosome-lysosome fusion stages, with concomitant enhancement of receptor-mediated mitophagy initiation, affects the amount of mitochondrial cargo in an exosome fraction.
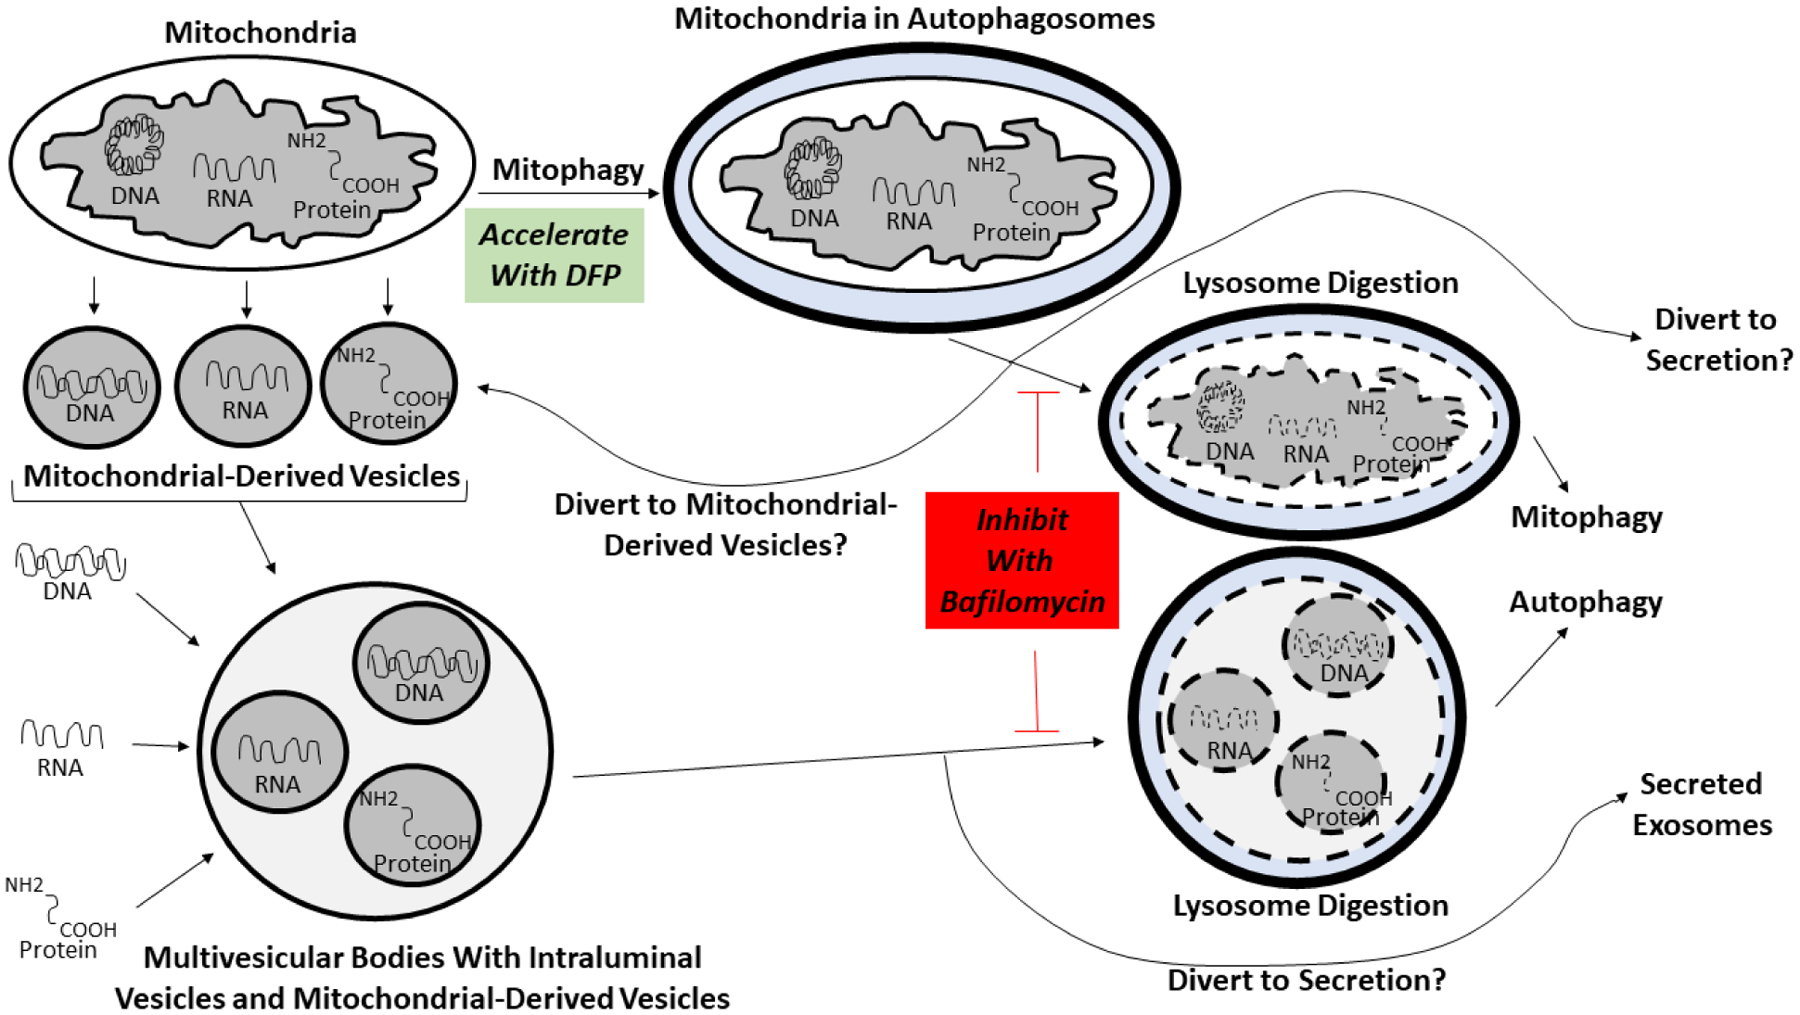
See the text for a complete explanation of the model. Briefly, in the presence of bafilomycin cells cannot use lysosomes to internally remove mitochondrial or endosome waste. Debris-loaded MVB vesicles intended for acid digestion at the end of the endolysosomal pathway are instead secreted as exosomes. Also, as cells cannot complete mitophagy they depend more on alternative mitochondrial control mechanisms such as MDV formation. Using DFP to initiate mitophagy while blocking its termination steps further diverts mitochondrial contents to MDVs, MVBs, and ultimately exosomes. To simplify this depiction the diagram only explicitly indicates diversion of mitochondrial contents to MDVs after mitochondria undergo autophagosome engulfment, but we expect the DFP-induced diversion of mitochondrial contents to MDVs also occurs prior to autophagosome formation. The ultimate effect is to increase the amount of mitochondrial cargo contained in an exosome fraction by increasing exosome production, and by increasing the packing of mitochondrial cargo into the exosomes themselves.
Our studies were performed in a neuroblastoma cell line, and our findings may not extrapolate well to the differentiated cells of an actual brain. Our experimental model and protocols allowed us to harvest adequate numbers of exosomes under ideal conditions and replicating this study in human individuals could fail due to technical or other barriers. As for the pharmacologic agents we utilized, DFP is used in humans but bafilomycin is not. Other drugs, such as chloroquine, inhibit lysosome function and are used clinically [37], but we do not know if chloroquine, if used in conjunction with DFP, would similarly impact exosome release or exosome mitochondrial enrichment.
For several diseases, including AD, there is considerable interest in developing and implementing exosome-based biomarkers for diagnostic, prognostic, and drug target engagement applications [38, 39]. Exosomes are obtained from body fluids and could potentially facilitate “liquid biopsies” of difficult to reach tissues such as the brain. In terms of using exosomes as a biomarker of brain integrity, in addition to harvesting neuron-derived exosomes from blood, harvesting exosomes from cerebrospinal fluid (CSF) also seems worth considering. CSF exosomes would presumably arise from the brain and contain mitochondrial cargo from brain cells. If CSF exosome mitochondrial cargos reflect the state of brain mitochondria their biomarker potential could prove substantial. However, low exosome yields or small amounts of mitochondrial material per exosome could limit assay precision. Approaches that increase exosome yields, or enrich for mitochondrial cargo, could enhance feasibility. The manipulations we report here are therefore worth considering as the field moves to develop exosome-based mitochondrial biomarkers.
5. Conclusions
Bafilomycin plus DFP can increase the number of exosome particles cells produce and release. For some parameters, individual exosomes generated through this treatment combination can also contain increased amounts of mitochondrial material, which could reflect enhanced MDV production with subsequent packing into MVBs. By promoting exosome yields, as well as an enrichment of per-exosome mitochondrial cargo, bafilomycin plus DFP can enhance the signal-to-noise ratio of exosome-contained mitochondrial components. Collectively, our data suggest pharmacologic manipulations that enhance mitophagy initiation, while inhibiting the lysosomal digestion of autophagosomes and MVBs, could potentially enhance the sensitivity of exosome-based biomarker assays intended to inform the status of an individual’s mitochondria.
Highlights.
Exosomes contain mitochondria-pertinent proteins
The mitophagy pathway influences exosome mitochondrial content
Mitophagy manipulations can enhance exosome biomarker potential
Acknowledgements
This work was supported by the University of Kansas Alzheimer’s Disease Center (P30AG072973). XW was supported by a Mabel Woodyard Fellowship award.
Abbreviations:
- AD
Alzheimer’s disease
- APP
amyloid precursor protein
- BSA
bovine serum albumin
- CO2
cytochrome oxidase subunit 2
- CS
citrate synthase
- CSF
cerebrospinal fluid
- DFP
deferiprone
- EV
extracellular vesicle
- FBS
fetal bovine serum
- FGF21
fibroblast growth factor 21
- ILV
intraluminal vesicle
- mtDNA
mitochondrial DNA
- MDV
mitochondrial-derived vesicle
- MVB
multivesicular body
- NTA
nanoparticle tracking analysis
- ND2
NADH dehydrogenase subunit 2
- NUMT
nuclear mitochondrial DNA sequence
- PBS
phosphate-buffered saline
- PBST
PBS-Tween 20
- RT
reverse transcription
- SE
standard error
Footnotes
Publisher's Disclaimer: This is a PDF file of an unedited manuscript that has been accepted for publication. As a service to our customers we are providing this early version of the manuscript. The manuscript will undergo copyediting, typesetting, and review of the resulting proof before it is published in its final form. Please note that during the production process errors may be discovered which could affect the content, and all legal disclaimers that apply to the journal pertain.
Financial Disclosures: The authors report no conflicts of interest.
References
- [1].Swerdlow RH (2018) Mitochondria and Mitochondrial Cascades in Alzheimer’s Disease. J Alzheimers Dis 62, 1403–1416. [DOI] [PMC free article] [PubMed] [Google Scholar]
- [2].Swerdlow RH (2014) Bioenergetic medicine. Br J Pharmacol 171, 1854–1869. [DOI] [PMC free article] [PubMed] [Google Scholar]
- [3].Kish SJ, Bergeron C, Rajput A, Dozic S, Mastrogiacomo F, Chang LJ, Wilson JM, DiStefano LM, Nobrega JN (1992) Brain cytochrome oxidase in Alzheimer’s disease. J Neurochem 59, 776–779. [DOI] [PubMed] [Google Scholar]
- [4].Parker WD Jr., Filley CM, Parks JK(1990) Cytochrome oxidase deficiency in Alzheimer’s disease. Neurology 40, 1302–1303. [DOI] [PubMed] [Google Scholar]
- [5].Swerdlow RH, Parks JK, Cassarino DS, Maguire DJ, Maguire RS, Bennett JP Jr., Davis RE, Parker WD Jr. (1997) Cybrids in Alzheimer’s disease: a cellular model of the disease? Neurology 49, 918–925. [DOI] [PubMed] [Google Scholar]
- [6].Manczak M, Jung Y, Park BS, Partovi D, Reddy PH (2005) Time-course of mitochondrial gene expressions in mice brains: implications for mitochondrial dysfunction, oxidative damage, and cytochrome c in aging. J Neurochem 92, 494–504. [DOI] [PubMed] [Google Scholar]
- [7].Swerdlow RH (2012) Mitochondria and cell bioenergetics: increasingly recognized components and a possible etiologic cause of Alzheimer’s disease. Antioxid Redox Signal 16, 1434–1455. [DOI] [PMC free article] [PubMed] [Google Scholar]
- [8].Wilkins HM, Mahnken JD, Welch P, Bothwell R, Koppel S, Jackson RL, Burns JM, Swerdlow RH (2017) A Mitochondrial Biomarker-Based Study of S-Equol in Alzheimer’s Disease Subjects: Results of a Single-Arm, Pilot Trial. J Alzheimers Dis 59, 291–300. [DOI] [PMC free article] [PubMed] [Google Scholar]
- [9].Mosconi L, Mistur R, Switalski R, Tsui WH, Glodzik L, Li Y, Pirraglia E, De Santi S, Reisberg B, Wisniewski T, de Leon MJ (2009) FDG-PET changes in brain glucose metabolism from normal cognition to pathologically verified Alzheimer’s disease. Eur J Nucl Med Mol Imaging 36, 811–822. [DOI] [PMC free article] [PubMed] [Google Scholar]
- [10].Bero AW, Yan P, Roh JH, Cirrito JR, Stewart FR, Raichle ME, Lee JM, Holtzman DM (2011) Neuronal activity regulates the regional vulnerability to amyloid-beta deposition. Nat Neurosci 14, 750–756. [DOI] [PMC free article] [PubMed] [Google Scholar]
- [11].Vlassenko AG, Vaishnavi SN, Couture L, Sacco D, Shannon BJ, Mach RH, Morris JC, Raichle ME, Mintun MA (2010) Spatial correlation between brain aerobic glycolysis and amyloid-beta (Abeta) deposition. Proc Natl Acad Sci U S A 107, 17763–17767. [DOI] [PMC free article] [PubMed] [Google Scholar]
- [12].Fukuyama H, Ogawa M, Yamauchi H, Yamaguchi S, Kimura J, Yonekura Y, Konishi J (1994) Altered cerebral energy metabolism in Alzheimer’s disease: a PET study. J Nucl Med 35, 1–6. [PubMed] [Google Scholar]
- [13].Terada T, Obi T, Bunai T, Matsudaira T, Yoshikawa E, Ando I, Futatsubashi M, Tsukada H, Ouchi Y (2020) In vivo mitochondrial and glycolytic impairments in patients with Alzheimer disease. Neurology 94, e1592–e1604. [DOI] [PubMed] [Google Scholar]
- [14].Vidoni ED, Choi IY, Lee P, Reed G, Zhang N, Pleen J, Mahnken JD, Clutton J, Becker A, Sherry E, Bothwell R, Anderson H, Harris RA, Brooks W, Wilkins HM, Mosconi L, Burns JM, Swerdlow RH (2021) Safety and target engagement profile of two oxaloacetate doses in Alzheimer’s patients. Alzheimers Dement 17, 7–17. [DOI] [PMC free article] [PubMed] [Google Scholar]
- [15].Shah R, Patel T, Freedman JE (2018) Circulating Extracellular Vesicles in Human Disease. N Engl J Med 379, 958–966. [DOI] [PubMed] [Google Scholar]
- [16].Raposo G, Stoorvogel W (2013) Extracellular vesicles: exosomes, microvesicles, and friends. J Cell Biol 200, 373–383. [DOI] [PMC free article] [PubMed] [Google Scholar]
- [17].Desdín-Micó G, Mittelbrunn M (2017) Role of exosomes in the protection of cellular homeostasis. Cell Adh Migr 11, 127–134. [DOI] [PMC free article] [PubMed] [Google Scholar]
- [18].Kapogiannis D, Mustapic M, Shardell MD, Berkowitz ST, Diehl TC, Spangler RD, Tran J, Lazaropoulos MP, Chawla S, Gulyani S, Eitan E, An Y, Huang CW, Oh ES, Lyketsos CG, Resnick SM, Goetzl EJ, Ferrucci L (2019) Association of Extracellular Vesicle Biomarkers With Alzheimer Disease in the Baltimore Longitudinal Study of Aging. JAMA Neurol. [DOI] [PMC free article] [PubMed] [Google Scholar]
- [19].Mustapic M, Eitan E, Werner JK Jr., Berkowitz ST, Lazaropoulos MP, Tran J, Goetzl EJ, Kapogiannis D (2017) Plasma Extracellular Vesicles Enriched for Neuronal Origin: A Potential Window into Brain Pathologic Processes. Front Neurosci 11, 278. [DOI] [PMC free article] [PubMed] [Google Scholar]
- [20].Wang X, Weidling I, Koppel S, Menta B, Perez Ortiz J, Kalani A, Wilkins HM, Swerdlow RH (2020) Detection of mitochondria-pertinent components in exosomes. Mitochondrion 55, 100–110. [DOI] [PMC free article] [PubMed] [Google Scholar]
- [21].Sugiura A, McLelland GL, Fon EA, McBride HM (2014) A new pathway for mitochondrial quality control: mitochondrial-derived vesicles. Embo j 33, 2142–2156. [DOI] [PMC free article] [PubMed] [Google Scholar]
- [22].Bozi LH, Bechara LR, Dos Santos AF, Campos JC (2016) Mitochondrial-derived vesicles: a new player in cardiac mitochondrial quality control. J Physiol 594, 6077–6078. [DOI] [PMC free article] [PubMed] [Google Scholar]
- [23].Picca A, Guerra F, Calvani R, Bucci C, Lo Monaco MR, Bentivoglio AR, Coelho-Júnior HJ, Landi F, Bernabei R, Marzetti E (2019) Mitochondrial Dysfunction and Aging: Insights from the Analysis of Extracellular Vesicles. Int J Mol Sci 20. [DOI] [PMC free article] [PubMed] [Google Scholar]
- [24].Soto-Heredero G, Baixauli F, Mittelbrunn M (2017) Interorganelle Communication between Mitochondria and the Endolysosomal System. Front Cell Dev Biol 5, 95. [DOI] [PMC free article] [PubMed] [Google Scholar]
- [25].Yamamoto A, Tagawa Y, Yoshimori T, Moriyama Y, Masaki R, Tashiro Y (1998) Bafilomycin A1 prevents maturation of autophagic vacuoles by inhibiting fusion between autophagosomes and lysosomes in rat hepatoma cell line, H-4-II-E cells. Cell Struct Funct 23, 33–42. [DOI] [PubMed] [Google Scholar]
- [26].Allen GF, Toth R, James J, Ganley IG (2013) Loss of iron triggers PINK1/Parkin-independent mitophagy. EMBO Rep 14, 1127–1135. [DOI] [PMC free article] [PubMed] [Google Scholar]
- [27].Zhao JF, Rodger CE, Allen GFG, Weidlich S, Ganley IG (2020) HIF1α-dependent mitophagy facilitates cardiomyoblast differentiation. Cell Stress 4, 99–113. [DOI] [PMC free article] [PubMed] [Google Scholar]
- [28].Ajaz S, Czajka A, Malik A (2015) Accurate Measurement of Circulating Mitochondrial DNA Content from Human Blood Samples Using Real-Time Quantitative PCR In Mitochondrial Medicine: Volume I, Probing Mitochondrial Function, Weissig V, Edeas M, eds. Springer New York, New York, NY, pp. 117–131. [DOI] [PubMed] [Google Scholar]
- [29].Liu J, Zou Y, Tang Y, Xi M, Xie L, Zhang Q, Gong J (2016) Circulating cell-free mitochondrial deoxyribonucleic acid is increased in coronary heart disease patients with diabetes mellitus. J Diabetes Investig 7, 109–114. [DOI] [PMC free article] [PubMed] [Google Scholar]
- [30].Perez-Gonzalez R, Gauthier SA, Kumar A, Levy E (2012) The exosome secretory pathway transports amyloid precursor protein carboxyl-terminal fragments from the cell into the brain extracellular space. J Biol Chem 287, 43108–43115. [DOI] [PMC free article] [PubMed] [Google Scholar]
- [31].Alvarez-Erviti L, Seow Y, Schapira AH, Gardiner C, Sargent IL, Wood MJ, Cooper JM (2011) Lysosomal dysfunction increases exosome-mediated alpha-synuclein release and transmission. Neurobiol Dis 42, 360–367. [DOI] [PMC free article] [PubMed] [Google Scholar]
- [32].Niikura T, Chiba T, Aiso S, Matsuoka M, Nishimoto I (2004) Humanin: after the discovery. Mol Neurobiol 30, 327–340. [DOI] [PubMed] [Google Scholar]
- [33].Anandatheerthavarada HK, Biswas G, Robin MA, Avadhani NG (2003) Mitochondrial targeting and a novel transmembrane arrest of Alzheimer’s amyloid precursor protein impairs mitochondrial function in neuronal cells. J Cell Biol 161, 41–54. [DOI] [PMC free article] [PubMed] [Google Scholar]
- [34].Anandatheerthavarada HK, Devi L (2007) Amyloid precursor protein and mitochondrial dysfunction in Alzheimer’s disease. Neuroscientist 13, 626–638. [DOI] [PubMed] [Google Scholar]
- [35].Tezze C, Romanello V, Sandri M (2019) FGF21 as Modulator of Metabolism in Health and Disease. Front Physiol 10, 419. [DOI] [PMC free article] [PubMed] [Google Scholar]
- [36].Forsström S, Jackson CB, Carroll CJ, Kuronen M, Pirinen E, Pradhan S, Marmyleva A, Auranen M, Kleine IM, Khan NA, Roivainen A, Marjamäki P, Liljenbäck H, Wang L, Battersby BJ, Richter U, Velagapudi V, Nikkanen J, Euro L, Suomalainen A (2019) Fibroblast Growth Factor 21 Drives Dynamics of Local and Systemic Stress Responses in Mitochondrial Myopathy with mtDNA Deletions. Cell Metab 30, 1040–1054.e1047. [DOI] [PubMed] [Google Scholar]
- [37].Nelson MP, Shacka JJ (2013) Autophagy Modulation in Disease Therapy: Where Do We Stand? Curr Pathobiol Rep 1, 239–245. [DOI] [PMC free article] [PubMed] [Google Scholar]
- [38].Kapogiannis D (2020) Exosome Biomarkers Revolutionize Preclinical Diagnosis of Neurodegenerative Diseases and Assessment of Treatment Responses in Clinical Trials. Adv Exp Med Biol 1195, 149. [DOI] [PubMed] [Google Scholar]
- [39].Boukouris S, Mathivanan S (2015) Exosomes in bodily fluids are a highly stable resource of disease biomarkers. Proteomics Clin Appl 9, 358–367. [DOI] [PMC free article] [PubMed] [Google Scholar]


