

Abstract
Biomolecular condensates organize biochemistry, yet little is known about how cells control the position and scale of these structures. In cells, condensates often appear as relatively small assemblies that do not coarsen into a single droplet despite their propensity to fuse. Here we report that ribonucleoprotein condensates of the Q-rich protein Whi3 interact with the endoplasmic reticulum, prompting us to examine how membrane association controls condensate size. Reconstitution reveals that membrane recruitment promotes Whi3 condensation under physiological conditions. These assemblies rapidly arrest, resembling size distributions seen in cells. The temporal ordering of molecular interactions and the slow diffusion of membrane-bound complexes can limit condensate size. Our experiments reveal a tradeoff between locally-enhanced protein concentration at membranes, favoring condensation, and an accompanying reduction in diffusion, restricting coarsening. Given that many condensates bind endomembranes, we predict that the biophysical properties of lipid bilayers are key for controlling condensate sizes throughout the cell.
Compartmentalization of biochemistry is critical for diverse cell functions. Biomolecular condensates, composed of a concentrated assembly of protein and nucleic acid, are emerging as centers of compartmentalization throughout the cell1. Many biomolecular condensates have been categorized as forming by liquid-liquid phase separation (LLPS), though a more precise term is phase-separated assisted percolation (PSAP), in which multivalent interactions facilitate the formation of a condensed phase comprising a network of interacting polymers. PSAP occurs when the bulk concentration exceeds a saturation concentration, above which molecules spontaneously partition into dense and dilute phases2, 3. Condensates formed by PSAP can display properties of liquid-like droplets and dynamically exchange molecules with the surrounding environment4.
Condensates can coarsen, or increase in size over time, through processes such as Ostwald ripening and Brownian motion coalescence2, 5, both of which are characterized by power law dynamic scaling with an exponent of 1/32, 6–8. Equilibrium thermodynamics predicts that coarsening will result in a single large droplet that minimizes the system’s interfacial energy. Indeed, protein and RNA condensates frequently coarsen into large, micrometer-size droplets when reconstituted in vitro5, 9–12. However, cells are not in equilibrium, and condensates within living cells are often an emulsion of diffraction-limited puncta or small droplets that do not increase beyond a certain size12–16. The cellular mechanisms that restrict coarsening and control condensate size remain poorly understood.
Recent studies have shown that diverse condensates are associated with and potentially regulated by membrane surfaces17–19. For example, the plasma membrane controls formation of condensates involved in immune cell activation20–24, actin assembly25, 26, presynaptic active zones27, 28, and endocytosis29. Many condensates also associate with endomembranes for assembly, transport, and positioning30–34, suggesting that interactions with membrane-bound organelles are important for condensate formation. Consistent with this idea, growing evidence indicates that the assembly and morphology of many condensates are closely linked with the endoplasmic reticulum (ER)16, 18, 35–37.
Our group discovered that the RNA-binding, glutamine (Q)-rich protein Whi3 forms spatially-distinct condensates in the multinucleate fungus Ashbya gossypii12, 38–40. Specifically, Whi3 forms punctate, diffraction-limited condensates containing either cyclin or formin RNA transcripts, which are positioned near nuclei and sites of polarized growth, respectively. In vitro, Whi3 and its binding RNAs form condensates that coarsen into large, macroscopic droplets12, 40. However, it is unknown how Ashbya cells restrict Whi3 condensate coarsening and maintain populations of small puncta in distinct locations.
In this work, we find that Whi3 condensates associate with the ER, suggesting that endomembrane surfaces may contribute to regulating Whi3 condensate assembly. In support of this idea, direct recruitment of Whi3 to synthetic membranes promotes assembly of protein-only condensates at substantially lower protein concentration compared to solution droplets. However, RNA is a central component of Whi3 condensates in Ashbya cells, prompting us to examine how membrane-tethered RNA influences assembly. Recruitment of Whi3 by membrane-tethered RNA drives formation of punctate condensates which do not coarsen into micrometer-scale droplets, similar to in vivo Whi3 assemblies. Our results reveal that membranes can both promote ribonucleoprotein condensate assembly and control condensate size, suggesting that membrane attachment is likely a key mechanism for controlling the formation and sizing of condensates throughout the cell.
Results
Whi3 condensates associate with the endoplasmic reticulum
Ashbya gossypii Whi3 is a 79 kDa protein containing a low-complexity, Q-rich region followed by a structured RNA recognition motif. Our previous work found that Whi3 forms micrometer-sized, liquid-like droplets in the presence of its binding RNAs in vitro12, 40. Droplet formation is mediated by interactions among the Q-rich region as well as RNA binding. However, Whi3-based assemblies in cells appear as small puncta rather than micrometer-size droplets. We set out to understand this scaling difference between in vivo and in vitro Whi3 condensates, and to identify cellular mechanisms that control coarsening.
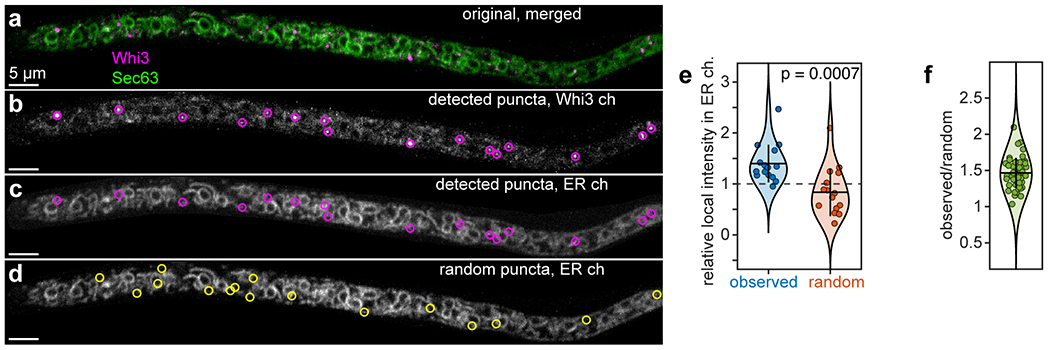
Some target RNAs of Whi3 are enriched near nuclei and at the cell cortex38, 39, prompting us to hypothesize that Whi3 condensates may associate with the endoplasmic reticulum (ER), which is associated with both nuclei and the cortex. To test this, we created an Ashbya strain in which Whi3 was tagged endogenously with tdTomato41 and a GFP-tagged ER marker, the translocon component Sec63, was expressed from a plasmid. Whi3 puncta appeared co-localized with multiple types of ER structures, including tubules and nuclear-associated ER (Fig. 1a). To quantify co-localization, we detected Whi3 puncta42 and determined the associated, local intensity in the ER channel (Extended Data Fig. 1). Approximately 81% of Whi3 puncta were co-localized with the ER, compared to approximately 50% of puncta appearing co-localized with the ER by chance when simulated as a random distribution (Fig. 1b). When compared to 50 different random distributions, Whi3 puncta consistently showed greater ER co-localization by a factor of 1.62 ± 0.36 s.d. (Fig. 1c).
Figure 1.
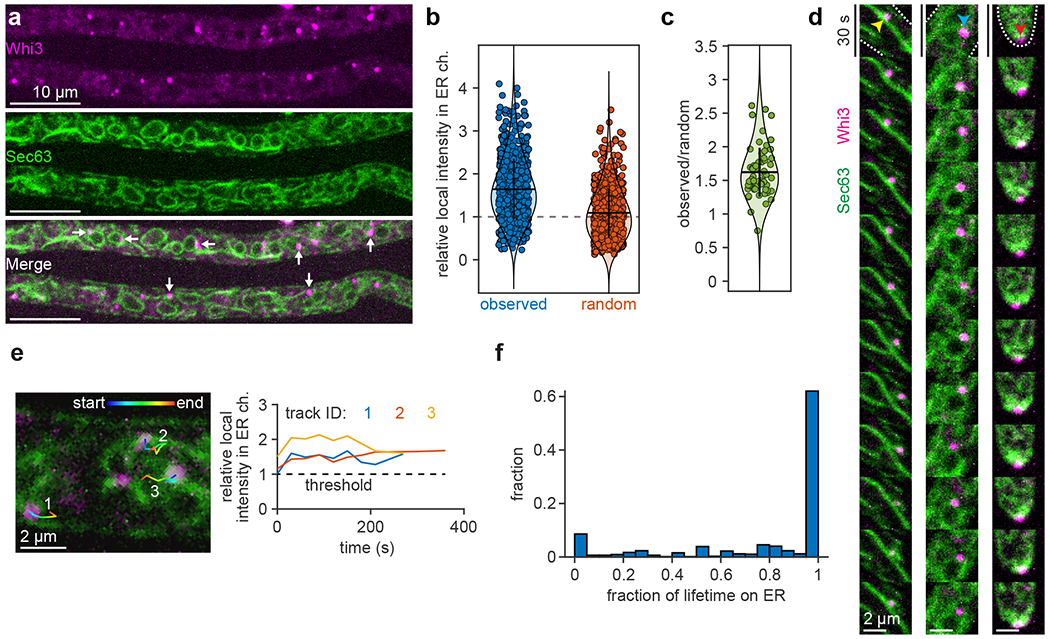
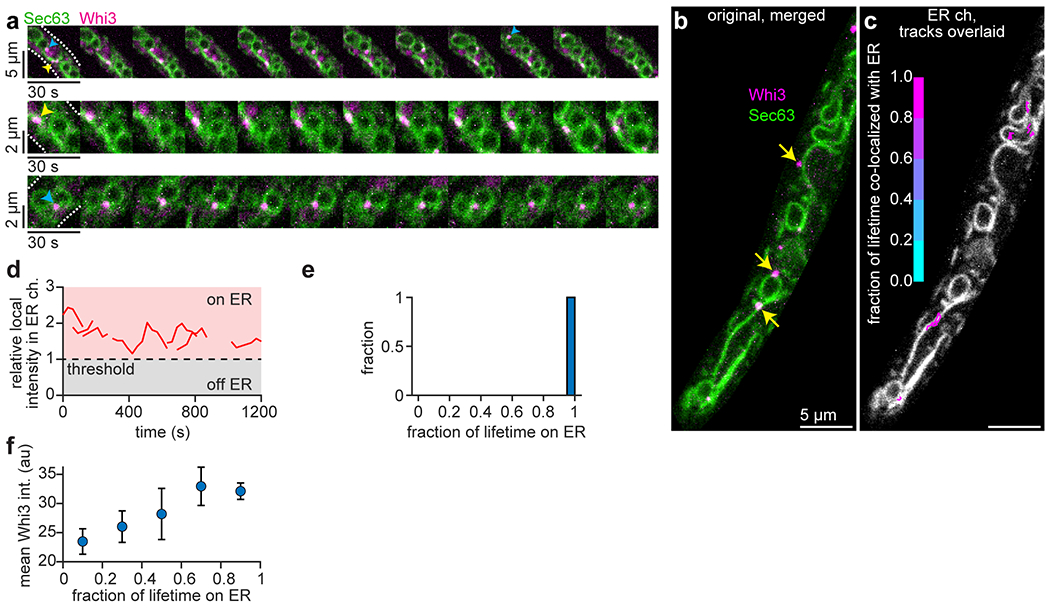
Whi3 puncta persistently associate with the endoplasmic reticulum in Ashbya gossypii. (a) Ashbya hyphae expressing Whi3-tdTomato and Sec63-GFP (ER marker). White arrows indicate example Whi3 puncta showing ER co-localization. (b) Local intensity in the ER channel at detected Whi3 puncta, expressed as a fraction of the median intensity of the ER channel throughout the hypha, after masking and background subtraction (see methods). Blue points: observed Whi3 positions, orange points: randomized Whi3 positions. n = 642 puncta from 60 hyphae. Dashed line indicates the threshold for co-localization, corresponding to the median intensity of the ER channel. Horizontal bar represents mean, vertical bar represents first s.d. (c) Ratio of the average local intensity in the ER channel at detected Whi3 puncta within a hypha relative to randomized Whi3 positions. Each data point represents the average of 50 random distributions per hypha, n = 60 hyphae (see methods). Horizontal bar represents mean, vertical bar represents first s.d. (d) Montages of Whi3 puncta associated with ER tubule (left, yellow arrowhead), nuclear-associated ER (middle, blue arrowhead), and hyphal tip (right, red arrowhead). White dashed lines in first frame indicate cell periphery. Montages span 6 min, 30 s/frame. (e) First frame from a time-lapse showing ER (green) and Whi3 (magenta) with three overlaid Whi3 tracks. Plot shows the associated, local intensity in the ER channel at each time point of the three tracks, expressed as a fraction of the median intensity of the ER channel throughout the hypha. All three tracks spend the entire lifetime co-localized with the ER. (f) Histogram of Whi3 tracks, binned according to the fraction of track lifetime co-localized with the ER. n = 769 tracks from 60 hyphae.
To assess whether Whi3 puncta associate with the ER transiently, or if puncta are stably tethered, we tracked Whi3-ER co-localization over time (Extended Data Fig. 2a–e). The movement of Whi3 puncta frequently tracked with the movement of the ER (Fig. 1d and Supplementary Video 1) and the majority of Whi3 tracks were strongly associated with the ER for most of the track lifetime (Fig. 1e,f). In particular, 74% of tracks spent 75% or more of the lifetime co-localized with the ER, while 62% of tracks spent the entire lifetime co-localized with the ER (Fig. 1f). Collectively, these findings indicate that a substantial fraction of Whi3 puncta are stably tethered to the ER, consistent with a previous report that ribonucleoprotein condensates associate with the ER in mammalian cells16.
Notably, Whi3 puncta appeared progressively brighter as the fraction of the track lifetime associated with the ER increased (Extended Data Fig. 2f), prompting us to hypothesize that ER surface attachment may influence the condensate assembly process. Specifically, we imagined that membranes may lower the concentration of protein required for phase separation9, 25 and/or supply factors that control coarsening. To examine the biophysical properties of membranes that contribute to condensate formation and size distributions seen in cells, we reconstituted Whi3 condensate formation on synthetic membrane surfaces.
Membranes promote Whi3 condensate assembly
To analyze how membrane association influences condensate assembly, we reconstituted Whi3 condensates on planar, supported lipid bilayers (SLBs) composed primarily of the lipid DOPC. Because Whi3 does not contain an obvious lipid interaction domain, 4 mol% of the lipid DGS NTA-Ni was included, and Whi3 was recruited to membranes via an N-terminal hexa-histidine (6his) motif (Fig. 2a). We first asked whether membranes may promote condensate assembly by increasing the local concentration of Whi3 relative to solution. We therefore added Whi3 to SLBs at a concentration of 50 nM, comparable to previous measurements of the soluble Whi3 concentration in Ashbya cells but several orders of magnitude lower than required to drive protein-only phase separation in vitro12. We found that circular, patch-like Whi3 condensates formed on SLBs within 5 min of protein addition (Fig. 2b; Supplementary Video 2). Notably, SLB experiments were performed in buffer with physiological ionic strength (150 mM KCl), while a lower ionic strength (75 mM) and micromolar concentrations of Whi3 are required to drive protein-only demixing in solution12. Therefore, membrane association appears to dramatically shift the phase boundary, reducing the Whi3 concentration and salt barrier required for condensate assembly in the absence of RNA.
Figure 2.
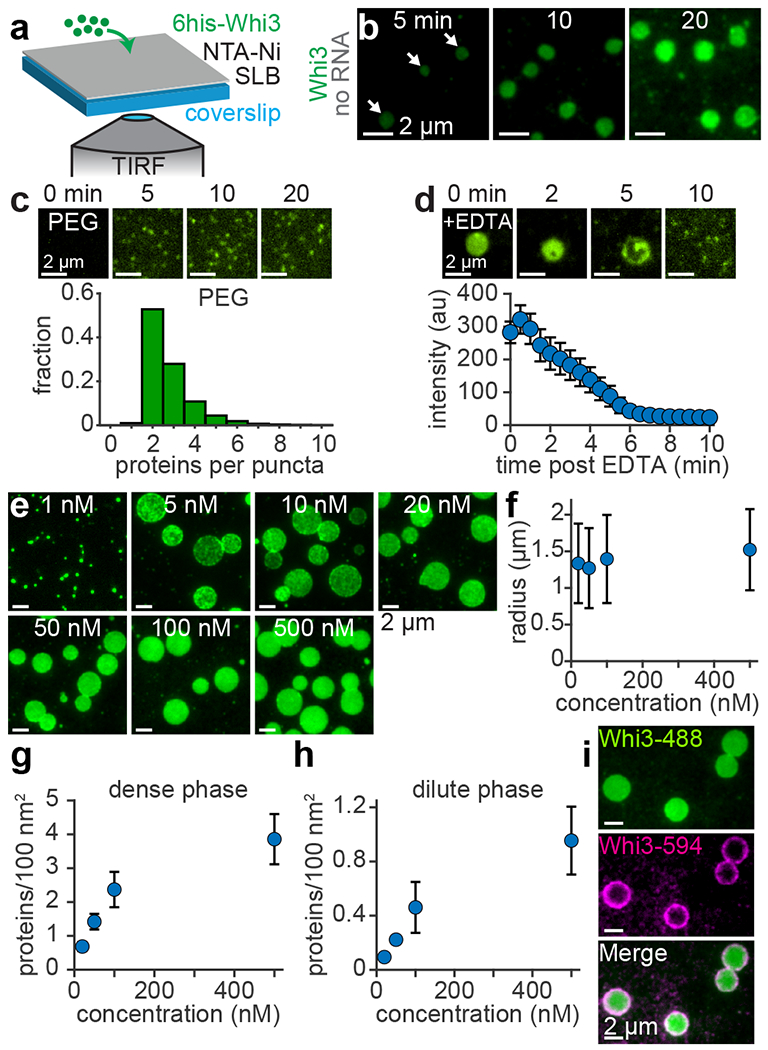
Membranes promote assembly of protein-only condensates with properties that deviate from LLPS predictions. (a) Schematic of SLB experiment. (b) Time series of SLB after addition of 50 nM Whi3-Atto488. Frames show different SLB regions at the indicated times. White arrows indicate condensates apparent after 5 min. (c) Top: Time-lapse of PEG surface after addition of 50 nM Whi3. Bottom: Histogram of the number of Whi3 proteins per puncta on PEG surfaces. n = 10,791 puncta from 3 biologically independent samples. (d) Top: Time-lapse of membrane-associated condensate, formed with 50 nM Whi3, after addition of 10 mM EDTA. Bottom: Average condensate intensity as a function of time after addition of 10 mM EDTA. Data are mean ± s.e.m. n = 10 condensates from 3 biologically independent samples. (e) Membrane-associated condensates 180 min after addition of Whi3 at the indicated bulk concentrations. Images are contrasted unequally to clearly show puncta or condensates. (f) Radius of membrane-associated condensates as a function bulk Whi3 concentration. Data are mean ± first s.d. (g-h) Protein density within the condensate dense phase (g) and dilute phase (h) as a function of bulk Whi3 concentration. Data in (g-h) are mean ± first s.d. Data in (f-g) from n = 717, 719, 592, and 687 condensates with 20, 50, 100, and 500 nM Whi3, respectively, from 3 biologically independent samples. Data in (h) from n = 30 images per Whi3 concentration, from 3 biologically independent samples. (i) Membrane-associated condensates, initially assembled with 50 nM Whi3-Atto488, approximately 20 min after addition of 50 nM Whi3-Atto594. SLB membrane composition: 96 mol% DOPC, 4 mol% DGS NTA-Ni.
Membrane binding is required for condensation
We next tested if the shift in the phase boundary was simply driven by surface interactions, or if a diffusive membrane was required. Condensates did not appear when 50 nM Whi3 was added to an immobile, PEG-coated surface (Fig. 2c). Instead, proteins remained primarily as dimers or trimers, as revealed by particle detection and single molecule calibration (Fig. 2c and Extended Data Fig. 3). Whi3 also formed puncta on membranes comprising DOPC alone or supplemented with the anionic lipid DOPS (Extended Data Fig. 4a). Thus, Whi3 puncta can passively interact with inert surfaces and membranes, but a direct membrane interaction is required to form condensates. Importantly, we confirmed that SLB lipids were diffusive using fluorescence recovery after photobleaching (FRAP) (Extended Data Fig. 4b). However, the solid glass support is known to reduce lipid diffusion in SLBs compared to free-standing model membranes such as giant unilamellar vesicles (GUVs)43, 44. Nonetheless, Whi3 formed circular condensates when recruited to NTA-Ni GUVs (Extended Data Fig. 4c), suggesting that condensate assembly was not substantially altered by the glass surface in SLB experiments. Notably, condensates on both SLBs and GUVs showed no fusion or rounding upon contact after approximately 20 min of assembly (Extended Data Fig. 4d), prompting us to examine if membrane association affected Whi3 condensate material properties.
Membranes alter condensate material properties
We hypothesized that if membranes promote a transition to a more gel-like material state, condensates should resist dissolution if the driving force for condensation is dissipated. To test this hypothesis, we added 10 mM EDTA to SLBs, which chelated Ni2+ ions and disrupted Whi3-membrane binding. Condensates did not uniformly dissolve upon EDTA exposure, instead dissolving from the center and breaking into fragments before disappearing after approximately 6 min (Fig. 2d and Extended Data Fig. 4e). Thus, proteins near the periphery may have formed a gel-like network that initially resisted dissolution45 while the center remained more liquid-like. Moreover, the radii of membrane-associated condensates did not increase substantially when the bulk Whi3 concentration ranged from 20-500 nM (Fig. 2e,f). By contrast, Whi3 protein-only droplets assembled in solution at low ionic strength (75 mM KCl) coarsened as expected for liquid-like droplets and showed rapid fusion more than 3 h after assembly (Extended Data Fig. 4f–h). Thus, membrane surfaces appear to alter the material properties of Whi3 protein-only condensates compared to solution droplets, restricting condensates to a relatively narrow size distribution over a broad range of concentrations. What is the physical mechanism by which Whi3 condensates assemble on membranes? We next examined whether membrane-associated condensates form via LLPS or a different mechanism.
Protein-only condensates do not follow predictions of LLPS
A key prediction of protein-only LLPS is that above a saturation concentration, protein should demix into fixed dilute and dense phase concentrations at a given temperature, regardless of the initial concentration. Below the saturation concentration, protein should remain well-mixed. To test if membrane-associated condensates follow these predictions, we examined the equilibrium phase behavior of Whi3 on SLBs after 3 h incubation with bulk concentrations ranging from 1-500 nM. While 5 nM Whi3 and higher was required to form macroscopic condensates (Fig. 2e), Whi3 still formed discrete, bright puncta on SLBs at 1 nM, rather than a homogenous distribution (Fig. 2e). Thus, higher-order Whi3 clusters can form below the saturation concentration for macroscopic condensate assembly. Condensates formed with 5 and 10 nM Whi3 also displayed non-uniform intensity (Fig. 2e), suggesting that condensates may have begun to accumulate multiple protein layers as the concentration increased46. Indeed, the dense phase protein density increased from 0.69 ± 0.14 to 3.86 ± 0.74 proteins/100 nm2 s.d. between 20 and 500 nM bulk Whi3 (Fig. 2g), contrasting with simple LLPS predictions. The “dilute” phase protein density on the surrounding membrane also increased monotonically as the Whi3 concentration increased from 20 to 500 nM (Fig. 2h). To assess if protein is incorporated into condensates via this population of dilute phase membrane-bound Whi3, or directly from solution, we added Whi3 labeled with a different fluorophore to pre-formed condensates. Newly-added Whi3 formed a ring at the condensate periphery (Fig. 2i), suggesting that membrane-bound protein is laterally incorporated into condensates, rather than recruited uniformly from solution. Collectively, these findings reveal that Whi3 protein-only condensates do not assemble on membranes by simple LLPS.
Reconstitution experiments to this point reveal that 6his-NTA-Ni membrane binding strongly favors Whi3-Whi3 interactions, driving assembly of protein-only condensates with properties that deviate from solution droplets. However, Whi3 co-assembles with RNA in cells38–40, and RNA promotes Whi3 phase separation in vitro12, 40. We next asked if RNA recruited by membrane-bound Whi3 may influence the assembly process.
RNA reduces the sizes of pre-assembled Whi3 condensates
To begin analyzing the role of RNA in assembly of membrane-associated condensates, a Whi3-interacting RNA, the cyclin CLN3, was added in solution prior to addition of Whi3. CLN3 was included at a concentration of 100 pM, comparable to a previous estimate of the CLN3 concentration in Ashbya38. Similar to RNA-free experiments (Fig. 2b), patch-like Whi3 condensates formed within 5 min of protein addition (Fig. 3a; Supplementary Video 3). During assembly, RNA was recruited from solution and appeared as puncta distributed around the membrane (Fig. 3a; Supplementary Video 3). However, RNA was not required for condensate nucleation (Extended Data Fig. 5a) and was clearly excluded from the interior of condensates, instead interacting with the periphery up to 20 min after Whi3 addition (Fig. 3a). At longer times up to 180 min, RNA puncta began to accumulate within condensates (Fig. 3b), suggesting that RNA may have passively partitioned into condensates without serving as a scaffold component. Nonetheless, condensate radii were somewhat smaller on average in the presence of RNA compared to RNA-free condensates (Fig. 3c). Thus, recruitment of RNA from solution may slow the coarsening rate of membrane-associated condensates.
Figure 3.
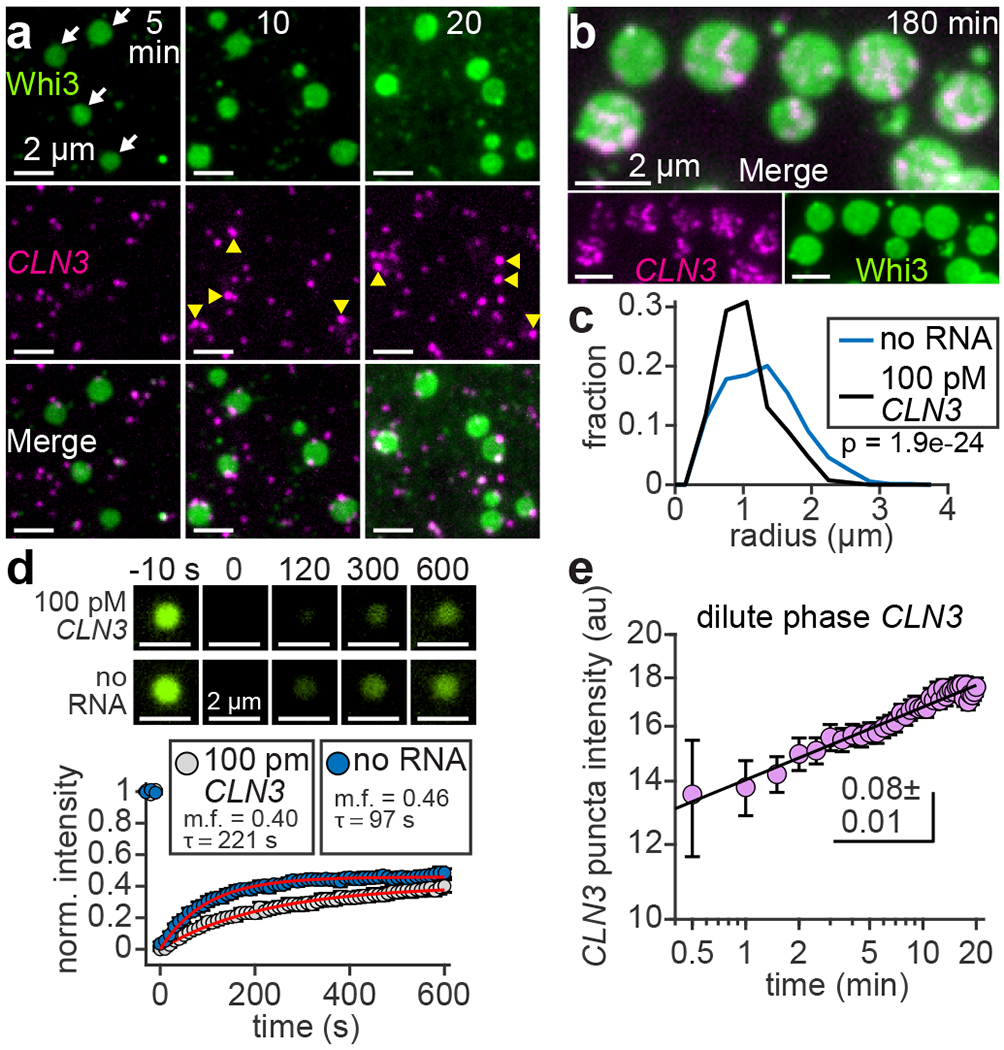
Delayed interactions with RNA reduce the sizes of pre-assembled Whi3 condensates. (a) Time series of SLB with CLN3-Cy3 in solution prior to Whi3 addition. Frames show different SLB regions at the indicated times after addition of 50 nM Whi3-Atto488. Final CLN3 concentration is 100 pM. White arrows indicate condensates apparent after 5 min. Yellow arrowheads indicate relatively bright CLN3 puncta at condensate edges. (b) Membrane-associated condensates 180 min after assembly with 50 nM Whi3 and 100 pM CLN3. (c) Histograms of condensate radii formed with 50 nM Whi3, in the presence and absence of CLN3, approximately 180 min after condensate assembly. n = 1,080 and 719 condensates in the presence and absence of CLN3, respectively, from 3 biologically independent samples. p-value from two-sided Kolmogorov-Smirnov test. (d) FRAP of condensates formed with 50 nM Whi3 in the presence (upper) and absence (lower) of 100 pM CLN3. Plot shows corresponding FRAP profiles. Red curves show fits to single-component exponential recovery model, with mobile fractions (m.f.) and recovery time constants (τ) indicated. Data are mean ± s.e.m. n = 12 and 8 condensates with and without RNA, respectively, from 2 biologically independent samples. (e) Intensity of “dilute” phase CLN3 puncta recruited by membrane-bound Whi3 as a function of time after addition of 50 nM Whi3. Black line shows fit to a power law function with indicated exponent. Data are mean ± 95% c.i. n = 44 - 2,264 puncta per data point, from 4 biologically independent samples. Exact n per data point provided in Source Data Fig. 3e. SLB membrane composition: 96 mol% DOPC, 4 mol% DGS NTA-Ni.
We imagined that RNA may affect coarsening by altering the mobility of Whi3 proteins in the “dense” phase (at the surface or within condensates) and/or the “dilute” phase (on the surrounding membrane). We found that the dense phase Whi3 recovery time constant from FRAP was more than twice as slow in the presence of RNA (Fig. 3d; 221 ± 15 and 97 ± 4 s, 95% c.i. of fits, with and without RNA, respectively), indicating that RNA reduced dense phase Whi3 mobility. Additionally, coarsening could be impacted if surface tension was altered by interfacial RNA clusters, which appeared brighter compared to “free” RNA puncta on the surrounding membrane (Fig. 3a and Extended Data Fig. 5b,c; Supplementary Video 4). Specifically, accumulation of negative charge at droplet interfaces can reduce surface tension47, a key determinant of the coarsening rate. However, confocal imaging revealed an apparent condensate contact angle of 0° (Extended Data Fig. 5d), indicating that the membrane interaction strength was substantially greater than surface tension. The role of interfacial RNA clusters on the surface tension of membrane-associated condensates remains to be uncovered.
Coarsening may also be impacted by the behavior of protein and/or RNA in the dilute phase. Specifically, the intensity of CLN3 puncta in the “dilute” phase (on the surrounding membrane, outside of condensates) increased over time, indicating that RNA was clustered into higher-order assemblies (Fig. 3a,e; Supplementary Video 3). However, RNA clusters displayed a power law scaling exponent of 0.08 ± 0.01, 95% c.i. of fit (Fig. 3e), substantially slower than the 1/3 exponent expected for liquid-like droplets2. It is possible that these slow-growing RNA clusters in the dilute phase may act as “sinks” that hinder coarsening by trapping Whi3 in low-mobility complexes.
Collectively, our observations reveal that direct Whi3-membrane binding promotes condensate assembly under physiological conditions. However, RNA is not well-mixed, and condensates are substantially larger compared to assemblies in cells (Fig. 1a). We therefore sought to identify parameters that better capture the scaling properties of in vivo assemblies.
Whi3-interacting RNA co-localizes with the ER
Because Whi3 does not contain an obvious lipid interaction domain, other factors are likely required to recruit Whi3 to the ER in cells. A potential candidate for such a factor is Whi3-interacting RNAs that reside on the ER. In support of this idea, previous work found that a fraction of virtually all mRNA transcripts associate with the ER for translation, regardless of the type of protein encoded, and that the majority of protein synthesis on the ER is directed toward cytosolic proteins48. To explore the possibility that Whi3 binds to ER-tethered RNAs, we visualized the ER and RNA transcripts in Ashbya cells, using an ER stain and single-molecule RNA fluorescence in situ hybridization (smFISH) of CLN3 transcripts. We found that a portion of CLN3 puncta were clearly co-localized with diverse ER structures, including tubules and nuclear-associated ER (Fig. 4a and Extended Data Fig. 6a). The fixation and permeabilization process appeared to degrade the ER somewhat (Fig. 4a, compare to Fig. 1a), suggesting that this approach may underestimate the proportion of ER-associated CLN3 puncta. These results support the hypothesis that ER membrane-associated RNAs could recruit Whi3 and influence condensation. Specifically, we predicted that if the recruitment mechanism was inverted such that membrane-tethered RNA recruited Whi3, the resulting assemblies may better capture features of condensates in cells. Therefore, we developed an approach to monitor Whi3 condensation with membrane-tethered RNA.
Figure 4.
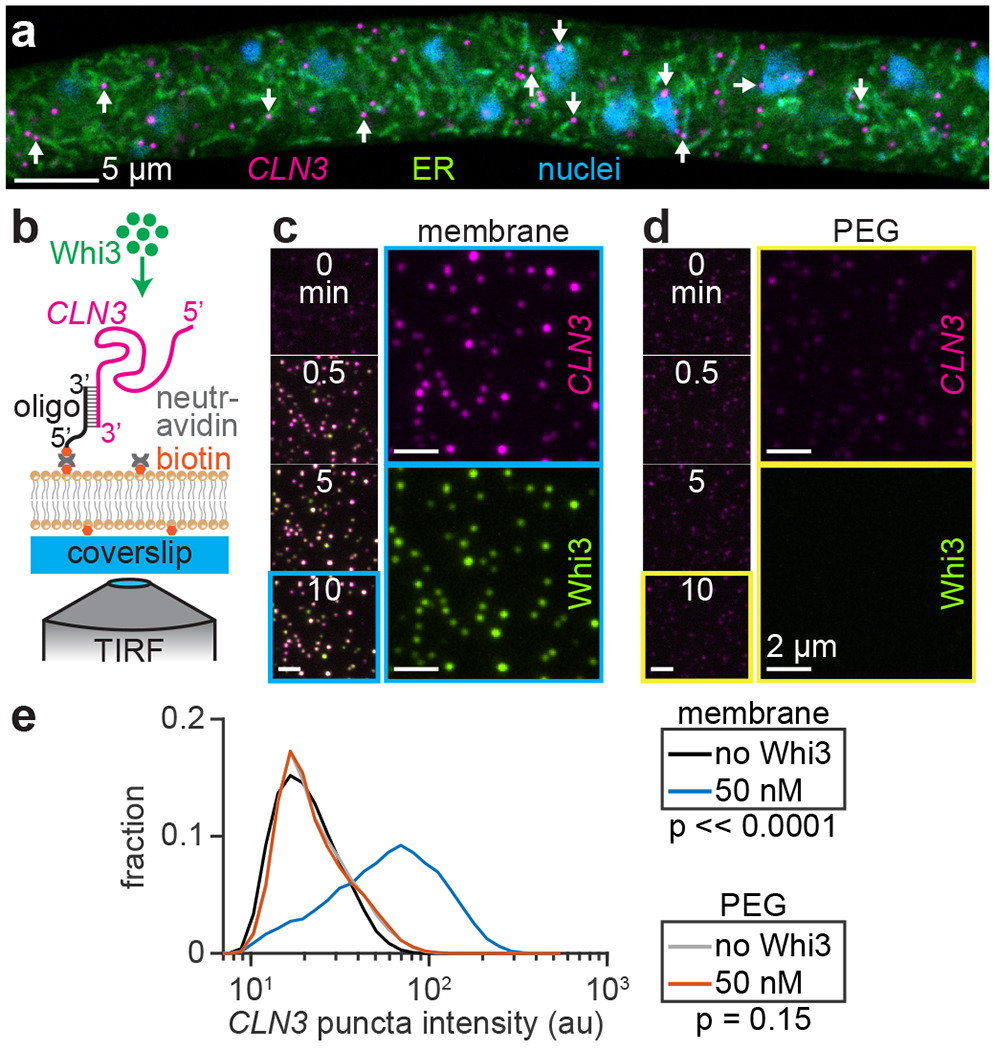
Whi3 forms condensates with membrane-tethered RNA. (a) Representative confocal section of ER and CLN3 smFISH in Ashbya cell. Arrows indicate example CLN3 puncta showing ER co-localization. (b) Schematic of membrane-tethered RNA experiment. (c,d) SLB (c) and immobile, PEG-coated surface (d) with tethered CLN3 at indicated times after addition of 50 nM Whi3. Time lapse images show merged CLN3 and Whi3 channels, while the cyan (c) or yellow (d) boxed frames show separate channels at 10 min time point. CLN3 and Whi3 channels contrasted equally. (e) Intensity histograms of membrane or PEG surface-tethered CLN3 puncta before and after addition of 50 nM Whi3. SLB experiment: n = 35,945 and 13,198 puncta before and after Whi3, from 18 and 3 biologically independent samples, respectively. PEG experiment: n = 37,992 and 10,084 puncta before and after Whi3, from 12 and 3 biologically independent samples, respectively. p-values from two-sided Kolmogorov-Smirnov tests. SLB membrane composition: 99 mol% DOPC, 1 mol% DOPE cap-biotin.
Punctate condensates form with membrane-tethered RNA
Based on our finding that RNA recruitment by membrane-bound Whi3 drove slow RNA clustering (Fig. 3a,e), we hypothesized that even smaller condensates may form if Whi3-RNA interactions were biased to occur earlier in the assembly process. To test this hypothesis, we directly tethered CLN3 RNA to membranes by hybridizing RNA to a biotinylated DNA oligonucleotide. Neutravidin protein facilitated RNA tethering to SLBs containing a biotinylated lipid (Fig. 4b). SLBs did not contain NTA-Ni lipid, ensuring that Whi3 recruitment occurred only through RNA binding. Experiments were again performed at physiological ionic strength (150 mM KCl), and Whi3 was added at concentrations far below the saturation concentration for solution LLPS (Fig. 4c)12.
Prior to addition of Whi3, RNA molecules appeared as sparse puncta diffusing rapidly on the membrane at an initial density of approximately 4.6 ± 0.6 puncta/10 μm2 s.d. (Extended Data Fig. 6b,c). Upon addition of 50 nM Whi3, membrane-tethered RNA recruited protein from solution and RNA puncta rapidly increased in fluorescence intensity within 30 s (Fig. 4c and Extended Data Fig. 6d; Supplementary Video 5). By contrast, when RNA was tethered to an immobile, PEG-biotin surface at a density of approximately 7.4 ± 0.7 puncta/10 μm2 s.d. (Extended Data Fig. 6b,c), tethered RNA only minimally recruited Whi3 and RNA puncta did not increase in fluorescence intensity over time (Fig. 4d and Extended Data Fig. 6d; Supplementary Video 6). Thus, Whi3 rapidly clustered RNA into higher-order assemblies only when RNA was tethered to a diffusive membrane surface (Fig. 4e). We next asked if clusters formed with membrane-tethered RNA display properties of liquid-like droplets.
Membrane-tethered RNA condensates fuse but rapidly arrest
Liquid-like droplets can coarsen via Ostwald ripening and/or Brownian motion coalescence (BMC), both of which show power law size scaling over time with an exponent of 1/32, 8. We observed that membrane-tethered RNA assemblies readily fused upon contact (Fig. 5a), suggesting that BMC contributed to coarsening. Indeed, the scaled distributions of Whi3 puncta intensities from live cells and from membrane-tethered RNA experiments were both right-skewed in shape (Extended Data Fig. 6e), a feature of assemblies that form by BMC. However, the intensity of membrane-tethered CLN3 puncta displayed an initial power law scaling exponent of 0.11 ± 0.04, 95% c.i. of fit (Fig. 5b), substantially slower than the expected BMC exponent. CLN3 puncta intensity also reached a plateau within approximately 5 min of Whi3 addition (Fig. 5b), suggesting that coarsening was rapidly arrested after the initial clustering process.
Figure 5.
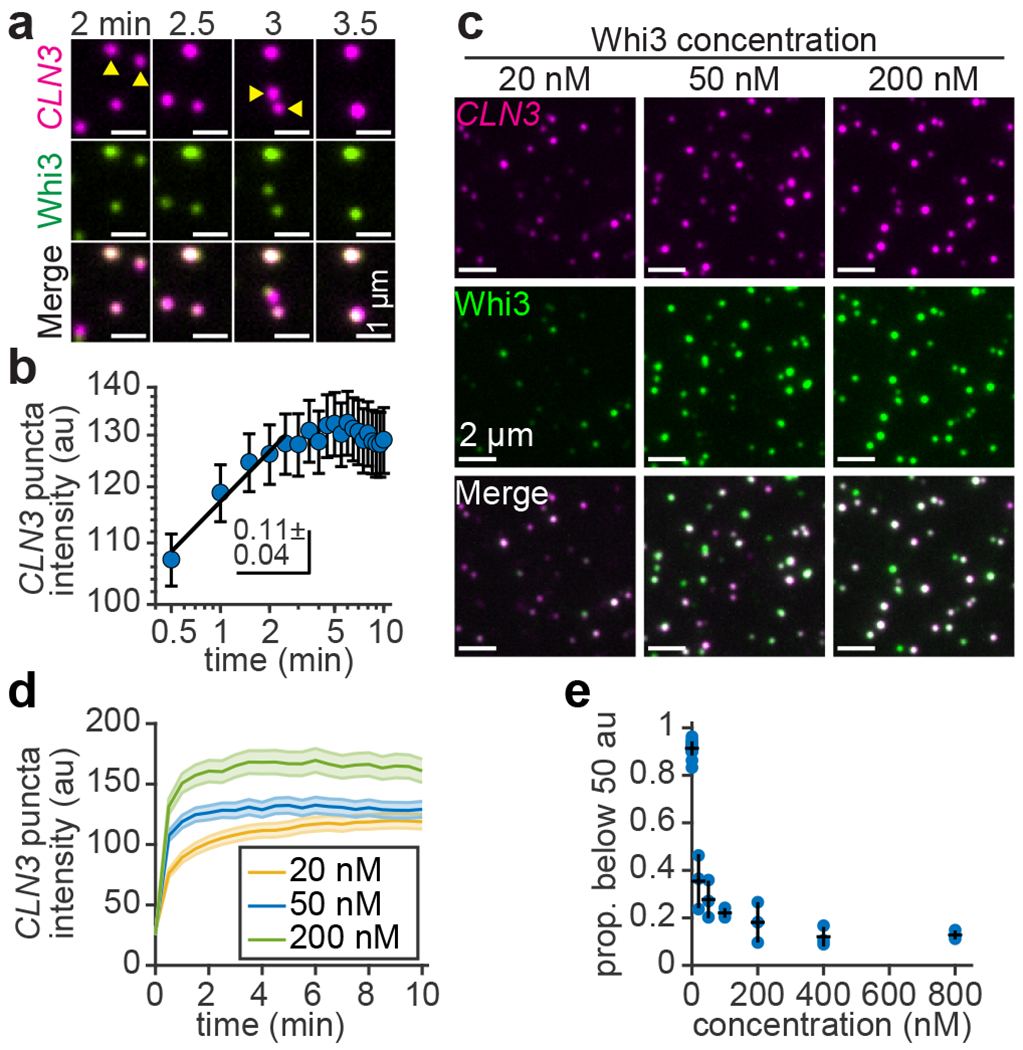
Condensates formed with membrane-tethered RNA coarsen by fusion but rapidly arrest. (a) Time series of two condensate fusion events at the indicated times after addition of 50 nM Whi3. Yellow arrowheads indicate condensate pairs one frame prior to fusion. (b) CLN3 intensity as a function of time after addition of 50 nM Whi3, plotted on log-log axes. Black line shows fit to a power law function over the first 5 data points, with indicated exponent. Data are mean ± 95% c.i. n = 1,059 - 1,335 puncta per data point, from 3 biologically independent samples. Exact n per data point provided in Source Data Fig. 5b. (c) Membrane-tethered RNA condensates 15 min after exposure to Whi3 at the indicated concentrations. CLN3 and Whi3 channels contrasted equally in all images. (d) CLN3 intensity as a function of time after addition of Whi3 at the indicated concentrations. 50 nM Whi3 data repeated from (b). Data are mean ± 95% c.i. n = 952 - 1,299 and 845 - 1,192 puncta per data point with 20 and 200 nM Whi3, respectively, from 3 biologically independent samples. Exact n per data point provided in Source Data Fig. 5d. (e) Proportion of CLN3 puncta with intensity below 50 brightness units as a function of Whi3 concentration. Data are mean ± first s.d. n = 18 biologically independent samples for 0 nM Whi3, n = 3 for all other data points. SLB membrane composition: 99 mol% DOPC, 1 mol% DOPE cap-biotin.
We wondered if condensates formed with membrane-tethered CLN3 may eventually coarsen into macroscopic droplets if the Whi3 concentration in solution was sufficiently high. However, we consistently observed punctate condensates that plateaued at a relatively constant intensity when the Whi3 concentration ranged from 20-800 nM (Fig. 5c,d and Extended Data Fig. 6f). The proportion of relatively small assemblies, defined as CLN3 puncta with intensity below 50 brightness units, decreased from 91% to 13% between 0 nM and 800 nM Whi3, respectively (Fig. 5e). Moreover, the intensity of both CLN3 and Whi3 within condensates increased as a function of Whi3 concentration (Extended Data Fig. 6g,h). Thus, smaller puncta likely fused into progressively larger assemblies as the Whi3 concentration increased. As a control, we consistently observed no substantial clustering when RNA was tethered to immobile, PEG-biotin surfaces and the Whi3 concentration ranged from 50-400 nM (Extended Data Fig. 6g).
Importantly, the diffraction-limited sizes of these condensates preclude the precise quantification of dense phase concentrations, hampering our ability to map the phase diagram and determine if membrane-tethered RNA condensates form by two-dimensional LLPS. Nonetheless, our findings reveal that membrane-tethered RNA promotes formation of condensates with liquid-like properties that rapidly arrest. What drives coarsening of membrane-tethered RNA condensates to arrest shortly after assembly?
Diffusion slows as membrane-bound complexes gain mass
Coarsening via BMC implies that clusters should continue to fuse and grow over time if diffusion remains unaffected, i.e. if assemblies undergo pure Brownian motion. However, the plateau in cluster intensity within 5 min (Fig. 5b) suggests that particle diffusion may have been hindered. To better understand how membrane association affects mobility, we first used fluorescence correlation spectroscopy (FCS) to examine the diffusion of Whi3 in solution or bound to NTA-Ni SLBs49. We observed a more than 600-fold reduction in the Whi3 diffusion coefficient, from 108 ± 16 to 0.17 ± 0.04 μm2 s−1 s.d., in solution and at membranes, respectively (Fig. 6a,b). By comparison, the diffusion coefficient of GFP, which does not self-assemble, was reduced approximately 23-fold when membrane-bound (Fig. 6b and Extended Data Fig. 7). Therefore, Whi3 recruitment to membranes likely promoted formation of oligomers that diffuse slower compared to monomeric proteins. Particle tracking and diffusion analysis of membrane-tethered CLN3 RNA also revealed a dramatic reduction in RNA motion after Whi3 addition (Fig. 6c,d). Specifically, the proportion of slow-diffusing RNAs, defined as particles with average velocity below 0.5 μm/s, increased from 21% to 98% between 0 nM and 800 nM Whi3 (Fig. 6e). To better understand the type of diffusion experienced by membrane-tethered RNAs, we performed mean-squared displacement analysis to estimate the diffusion exponent α, which describes whether particles undergo Brownian motion, sub-diffusion, or super-diffusion (α = 1, < 1, or > 1, respectively). Although RNA mobility was somewhat sub-diffusive prior to Whi3 addition, RNA became progressively more sub-diffusive after Whi3 addition (Fig. 6f; α of 0.76 ± 0.18 and 0.44 ± 0.18 s.d. before and after addition of 50 nM Whi3, respectively).
Figure 6.
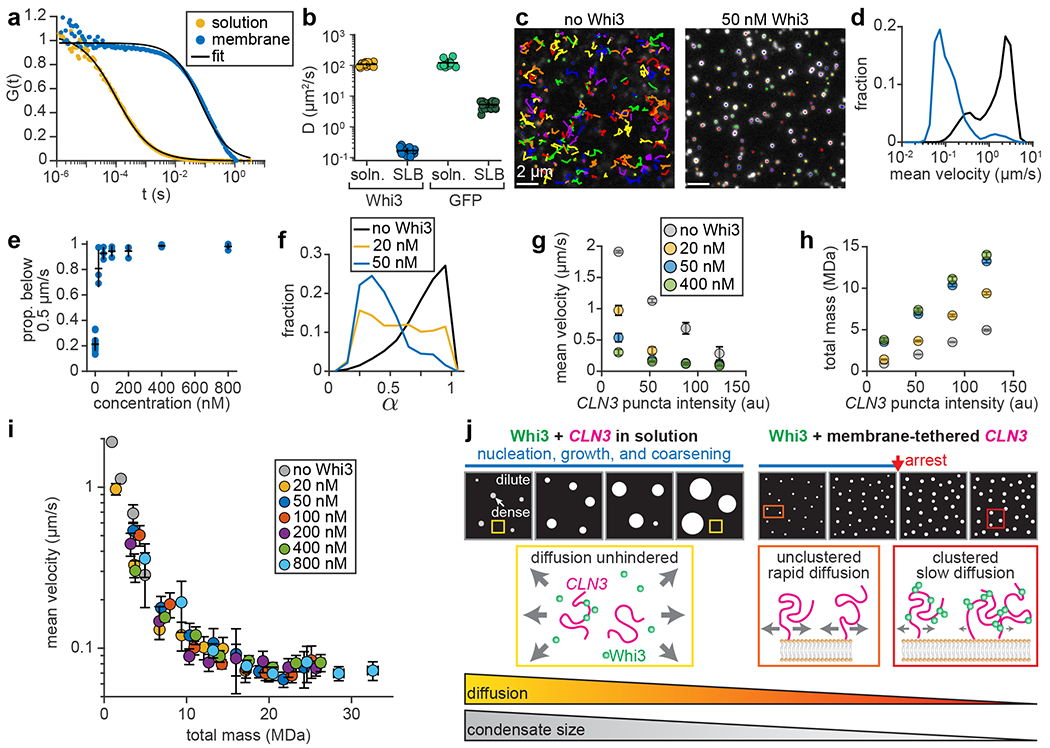
Diffusion slows as particles gain mass. (a) Average, normalized FCS traces of Whi3 diffusion in solution or at membrane. Black curves indicate fits to single-component diffusion model. n = 15 and 20 FCS traces in solution and membrane experiments, respectively, from 3 biologically independent samples. (b) Diffusion coefficients of Whi3 and GFP in solution or at membranes. Data are mean ± first s.d., n = 15, 20, 10, and 27 FCS traces in Whi3 solution, Whi3 SLB, GFP solution, and GFP SLB experiments, respectively. GFP solution and SLB data from 2 and 4 biologically independent samples, respectively. (c) RNA puncta tracks before (left) and after (right) addition of 50 nM Whi3. Images contrasted equally. Each color represents a separate track. Tracks corresponding to low-mobility puncta appear as dots. (d) Histograms of mean CLN3 puncta velocity on SLBs before (black) and after (blue) addition of 50 nM Whi3. n = 20,485 and 1,668 tracks before and after Whi3, from 18 and 3 biologically independent samples, respectively. (e) Proportion of CLN3 puncta with average velocity below 0.5 μm/s as a function of Whi3 concentration. Data are mean ± first s.d. n = 18 biologically independent samples for 0 nM Whi3, n = 3 for all other data points. (f) Histograms of CLN3 puncta diffusion exponent, α, before and after addition of Whi3 at the indicated concentrations. n = 3,544, 384, and 510 tracks with 0, 20, and 50 nM Whi3, from 18, 3, and 3 biologically independent samples, respectively. (g,h) Mean CLN3 velocity (g) and total mass of Whi3 and CLN3 (h) plotted as a function of CLN3 intensity (measured at the start of the track), before and after addition of Whi3 at the indicated concentrations. Data in (g-h) are mean ± 95% c.i. and represent moving averages of the raw data, with CLN3 intensity bins of 35. Each bin in (g) contains n = 17 - 16,311, 123 - 623, 198 - 417, and 169 - 219 puncta with 0, 20, 50, and 400 nM Whi3, from 18, 3, 3, and 3 biologically independent samples, respectively. Each bin in (h) contains n = 46 - 27,372, 1,085 - 2,766, 1,741 - 3,084, and 737 - 1,432 puncta with 0, 20, 50, and 400 nM Whi3, from 18, 3, 3, and 3 biologically independent samples, respectively. Exact n per data point provided in Source Data Fig. 6g,h. (i) Mean CLN3 velocity as a function of the total mass of Whi3 and CLN3. Plot shows data points repeated from (g,h) and additional Whi3 concentrations. Plot also includes four additional CLN3 intensity bins per Whi3 concentration. Data points represent mean, horizontal and vertical error bars represent 95% c.i. Exact n per data point provided in Source Data Fig. 6i. Data are from 18 biologically independent samples for 0 nM Whi3 and 3 biologically independent samples for all other data points. (j) Summary schematic. Left: Whi3-CLN3 condensates assembled in solution nucleate, grow, and coarsen into micrometer-scale droplets over several hours12, 40 (blue regime). Right: Addition of Whi3 to membrane-tethered CLN3 drives assembly of condensates that arrest within minutes (red arrow), resulting in condensates that more closely resemble size distributions in cells. While diffusion of Whi3 and CLN3 in solution remains unhindered throughout assembly (yellow boxes), the lateral diffusion of membrane-tethered CLN3 is reduced upon Whi3 binding and clustering (orange and red boxes). Sizes of gray arrows indicate relative magnitudes of diffusion. SLB membrane composition in (a-b): 96 mol% DOPC, 4 mol% DGS NTA-Ni; in (c-i): 99 mol% DOPC, 1 mol% DOPE cap-biotin.
How does Whi3 hinder RNA motion? The simplest possibility is that particle diffusion is determined by size. Indeed, RNA diffusion was inversely correlated with intensity prior to Whi3 addition (Fig. 6g), suggesting that puncta containing more RNA molecules experienced greater drag. The average velocity of a given RNA puncta density was also consistently slower as Whi3 concentration increased (Fig. 6g), suggesting that the RNA-bound Whi3 proteins can also slow diffusion by increasing particle drag. Consistent with this idea, particles of a given RNA density became more massive with increasing Whi3 concentration (Fig. 6h), suggesting that particle velocities should follow a single curve after accounting for the mass of adsorbed Whi3 proteins. Indeed, particle velocities fell along a common trend when plotted as a function of the total mass of Whi3 and CLN3, regardless of the Whi3 concentration in solution (Fig. 6i). Together, these findings reveal that Whi3 adsorption and associated RNA clustering dramatically reduce particle diffusion by increasing mass. This negative feedback between clustering and diffusion likely reduces the encounter probability between condensates and with molecules in the dilute phase, thereby rapidly halting growth. These results may explain why condensates remain diffraction-limited and do not coarsen into macroscopic droplets.
Discussion
The mechanisms by which cells localize condensates and control their sizes remain relatively unknown. Whi3-RNA condensates function by positioning cell cycle and cell polarity signaling to distinct regions in the cell, indicating that condensate localization is intimately tied to function12, 38–41. Our finding that Whi3 assemblies associate with the ER suggests that endomembranes may control condensate localization. The stable, punctate sizes of Whi3 condensates prompted us to examine how membranes inform Whi3-RNA condensate assembly. We discovered that membrane surfaces can stabilize relatively small condensates, which mimic features of in vivo assemblies, by reducing the diffusive motion of protein and RNA (Fig. 6j). Specifically, membrane-associated ribonucleoprotein assemblies may resist coarsening into macroscopic condensates simply due to the diffusion constraints experienced by macromolecular complexes. Thus, our findings suggest a tradeoff between a local enhancement in protein concentration at membrane surfaces, which favors condensation, and a simultaneous reduction in mobility, which restricts coarsening. The relative reduction in diffusion appears to determine the condensate size distribution (Fig. 6j). Importantly, this mechanism of size control contrasts with the view that non-equilibrium processes are required to maintain an emulsion of small condensates50–52.
Our findings suggest that membrane-driven oligomerization in the dilute phase, outside of condensates, may play a critical role in controlling condensate size. Specifically, recent work found that condensates can become kinetically arrested if molecules within small oligomers can self-interact on a faster timescale compared to the encounter rate with new molecules53. We speculate that Whi3 condensates may be prone to kinetic arrest if slow-diffusing oligomers or ribonucleoprotein clusters on membranes self-interact and saturate before encountering condensates, thus becoming “inert,” off-pathway assemblies which negatively regulate coarsening. In support of this hypothesis, we recently found that a transient ordered domain within Whi3 is also capable of driving dilute phase oligomerization that negatively regulates phase separation in solution54.
Membrane surfaces may also suppress coarsening by driving structural changes within the dense phase. Specifically, Whi3-membrane recruitment may be analogous to polyphasic linkage, in which ligand interactions modulate the driving forces for condensation55. From this perspective, membrane surfaces act as “ligands” that bind Whi3 and stabilize condensates under unfavorable conditions for phase separation. However, this additional interaction may over-stabilize protein-protein interactions, accelerating a percolation transition that further slows coarsening. Consistent with this idea, Whi3 protein-only condensates on membranes do not fuse (Extended Data Fig. 4d), and display a relatively low mobile protein fraction measured by FRAP (Fig. 3d), similar to previous measurements of aged, gel-like Whi3 droplets12. Notably, other multicomponent protein condensates assembled on NTA-Ni membranes were found to display liquid-like properties such as rapid fusion20, 21, 25, 56, suggesting that viscoelastic properties may not be a general feature of membrane-associated condensates. Rather, these previous reports20, 21, 25, 56 suggest that inclusion of other interaction partners may help to de-couple membrane binding from the multivalent interactions that drive condensation, thus helping the network to retain liquid-like properties. In line with this thinking, addition of Whi3 to membrane-tethered RNA enabled membrane recruitment without direct Whi3-membrane binding, and the resulting condensates displayed liquid-like properties (Fig. 5a).
Our experiments reveal that assembly of multicomponent condensates can be regulated when the membrane-tethered component displays a relatively weak propensity to self-assemble. Specifically, membrane tethering does not promote self-assembly of CLN3 RNA to the same extent as Whi3 protein (Fig. 2b and 4e). As such, a homogeneous density of membrane-bound CLN3 can be established, and protein-RNA co-assembly can be triggered when Whi3 is added in solution. Based on these findings, we hypothesize that Whi3 recruitment to ER membrane-tethered RNAs may be a relevant mechanism of condensate assembly in vivo. ER-tethered RNAs may also help control the size and localization of other condensates such as P-bodies and stress granules16.
Biological surfaces such as membranes22, 26, 32, 34, microtubules57, 58, long noncoding RNA15, and DNA59–62 are central features of biomolecular phase separation, but the precise roles of these large surfaces remain unclear. We speculate that the reduction and tuning of diffusion via surface tethering may serve a general function in controlling condensate sizes throughout the cell.
Methods
Chemical reagents
HEPES, TCEP, β-mercaptoethanol, Atto488- and Atto594-NHS-ester were purchased from Sigma-Aldrich. KCl was purchased from VWR. IPTG, lysozyme, imidazole, EDTA, Pierce protease inhibitor tablets, and Texas Red 1,2-dihexadecanoyl-sn-glycero-3-phosphoethanolamine (Texas Red-DHPE) were purchased from Thermo Fisher Scientific. 1,2-dioleoyl-sn-glycero-3-phosphocholine (DOPC), 1,2-dioleoyl-sn-glycero-3-[(N-(5-amino-1-carboxypentyl)iminodiacetic acid)succinyl], nickel salt (DGS NTA-Ni), and 1,2-dioleoyl-sn-glycero-3-phosphoethanolamine-N-(cap biotinyl) (DOPE cap-biotin) were purchased from Avanti Polar Lipids.
Plasmids
Full-length A. gossypii Whi3 was cloned into a modified version of the pET-30b bacterial expression vector, resulting in a construct with an N-terminal 6his tag followed by an ‘SSG’ linker and a TEV protease cleavage site (although the 6his tag was not removed by TEV cleavage for experiments in this manuscript). The modified pET-30b vector was created by digesting with NdeI and SalI to remove the original purification tags and cleavage sites. A DNA oligonucleotide duplex was made by annealing and phosphorylating the following oligonucleotides (encoding the 6his tag, ‘SSG’ linker, and TEV site): 5’-TATGCACCATCATCATCATCATTCTTCTGGTGAAAACCTGTATTTTCAGGGCG-3’ and 5’-TCGACGCCCTGAAAATACAGGTTTTCACCAGAAGAATGATGATGATGATGGTGCA-3’. This duplex was ligated into the digested pET-30b vector to create the modified plasmid backbone. The Whi3 coding sequence was finally inserted into this vector with SalI and NotI restriction sites, using the primers 5’-GACTGTCGACATGTCGCTGGTTAACAGTCAC-3’ and 5’-GACTGCGGCCGCTCAAGATTTGCCGAA-3’.
The A. gossypii CLN3 sequence used for in vitro transcription was cloned into the pJet vector (ThermoFisher Scientific K1231) using blunt end cloning. Primers for amplifying CLN3 were 5’-TAATACGACTCACTATAGGGGTCTGCA-3’ and 5’-CAGCTCCAGCGCCTGCA-3’. Directionality and sequence were confirmed by Sanger sequencing (Genewiz).
Protein purification and labeling
Whi3 was expressed as an N-terminal 6his-fusion construct in BL21 E. coli cells following induction with 1 mM IPTG for 16 h at 18 °C. Cells were harvested by centrifugation, and bacteria were lysed using lysis buffer and probe sonication. Lysis buffer consisted of 50 mM HEPES pH 7.4, 1.5 M KCl, 20 mM imidazole, 5 mM β-mercaptoethanol, 1x Pierce protease inhibitor cocktail, and 0.3 mg/mL lysozyme. Protein was purified from crude bacterial extract by incubating with cobalt resin, followed by extensive washing (at least 10x column volumes). Protein was eluted with 220 mM imidazole in 50 mM HEPES pH 7.4, 150 mM KCl, and 5 mM β-mercaptoethanol. Protein was dialyzed overnight against the same buffer without imidazole. Protein concentration was determined by 280 nm absorbance, and stored as small aliquots at −80 °C.
Whi3 was labeled with amine-reactive, NHS ester-functionalized Atto488 or Atto594 (Atto-Tec) in 50 mM HEPES pH 7.4, 150 mM KCl, 5 mM β-mercaptoethanol. The dye concentration was adjusted experimentally to achieve the desired labeling ratio of 0.5-1 dye molecules per protein, typically 2-3 times molar excess of dye. Reactions were performed for 20-30 min at room temperature, and unconjugated dye was removed from labeled protein by overnight dialysis against the above buffer. Before all experiments, protein was centrifuged at approximately 16,000 rcf for 5 min to remove large aggregates.
In vitro transcription
In vitro transcription of CLN3 RNA was carried out according to our established protocols40. The pJet CLN3 plasmid was linearized using PCR with the primers listed in the “Plasmids” section, and gel purified (QIAGEN 28706) to create the template for in vitro transcription. In vitro transcription (NEB E2040S) was carried out according to the manufacturer’s instructions using 100 ng of DNA template. 0.1-1 μL of Cy3-labeled UTP (Sigma PA53026) was included in the reaction to create fluorescently-labeled RNA. Following incubation at 37 °C for 18 h, the reaction was treated with DNAseI (NEB M0303L) according to the manufacturer’s instructions and purified with 2.5 M LiCl precipitation. RNA concentration was determined by 260 nm absorbance and verified for purity and size using a denaturing agarose gel and Millenium RNA ladder (ThermoFisher Scientific AM7151).
In order to tether RNA to biotinylated membranes via neutravidin, the 3’ end of CLN3 was hybridized to a biotinylated DNA oligo (Integrated DNA Technologies) with the following sequence: 5’ biotin-AAAAAAAAAACAGCTCCAGCGCCTGCACCGCGTAGTTTCT 3’. 10 nM of CLN3 RNA was mixed with 10 nM of oligo, melted at 95 °C for 5 min, then cooled to 72 °C for 10 min to hybridize.
Fluorescence microscopy
Imaging was performed on a Nikon Ti-E stand equipped with a Yokogawa CSU-W1 spinning disc confocal unit, motorized TIRF, a Plan-Apochromat 100x/1.49 NA oil immersion objective, a Prime 95b sCMOS camera (Photometrics) for TIRF, a Zyla sCMOS camera (Andor) for spinning disc, and Nikon NIS-Elements software version 4.60. The spinning disc and TIRF were illuminated with separate 405, 488, and 561 nm laser sources. A Bruker Galvo Miniscanner unit was used to perform FRAP experiments.
Particle detection using cmeAnalysis software
The openly-available cmeAnalysis software42 was used for particle detection and analysis of puncta intensities throughout this manuscript. This software was used for detection of (i) Whi3 puncta in Ashbya cells; (ii) single RNA and protein molecules for calibrated fluorescence intensity measurements; (iii) Whi3 puncta on passivated PEG surfaces; (iv) CLN3 RNA puncta in membrane-tethered Whi3 experiments; and (v) CLN3 and Whi3 intensities within clusters in membrane-tethered CLN3 experiments.
The software fit puncta in a specified “master” channel to a two-dimensional Gaussian function with standard deviation equal to the estimated standard deviation of our microscope’s point-spread function (PSF). The software reported the amplitude, “A,” of the Gaussian fit over the local background intensity, “c.” These A values were accepted as valid if they came from diffraction-limited puncta and were significantly above the local c values. The software also returned the centroid positions of detected puncta and, when applicable, searched for puncta in a corresponding secondary channel using the centroids of the detected puncta in the master channel. The search region in the secondary channel was set to three times the standard deviation of the Gaussian fit to the microscope PSF. If a puncta was detected in the secondary channel, the software fit it to a Gaussian function and reported the “A” value of the Gaussian fit over the local background intensity “c” value. If no puncta was detected, the software computed the c value as the average, local intensity in the secondary channel within the search region.
Ashbya cell culture, live cell imaging, and smFISH
The Whi3-tdTomato Ashbya strain, tagged at the endogenous locus under the native promoter, was created in our previous work40. The pRS416 A.g.Sec63-GFP:GEN plasmid was transformed into this parent strain by electroporation to create the strain used in this manuscript. Cells were grown in 10 mL Ashbya full media (AFM) under selection of G418 (200 μg/ml) and Clonat (100 μg/ml) in a 125 mL baffled flask shaking at 30 °C for 16 h. Cells were collected by centrifugation at 18 rcf for 2 min, AFM was removed, and cells were resuspended in low fluorescence media. Cells were placed on a low fluorescence media gel pad containing 2% agarose embedded in a depression slide and sealed with valap. Time-lapse movies of cells were acquired with spinning disc confocal microscopy at a single image plane. Movies were acquired for 15-20 min, 30 s/frame.
For single molecule RNA fluorescence in situ hybridization (smFISH), wild-type Ashbya cells grown for 16 h at 30 °C were collected by centrifugation at 18 rcf for 3 min in 15 mL tubes and resuspended in 10 mL AFM from the culture. Cells were then incubated with 0.5 μM ER-Tracker Green (Invitrogen E34251) while rotating for 10 minutes at 30°C before directly fixing with 3.7% formaldehyde for 1 h at 30 °C. Cells were then probed for CLN3 RNA transcripts using the smFISH strategy as previously described38 using custom, TAMRA-labeled CLN3 FISH probes from Stellaris. Cells were stained with 5 mg/mL Hoechst for 10 minutes and mounted in Vectashield Antifade Mounting Medium (Vector Laboratories H-1000-10) before imaging. The presented images were acquired using spinning disc confocal microscopy at a single image plane.
Analysis of Whi3-ER co-localization from single image frames
The first frames of time-lapse movies were used for analysis of Whi3-ER co-localization. All analysis was performed in Matlab 2019b software. The centroid positions of diffraction-limited puncta of Whi3 assemblies were estimated using cmeAnalysis software. The average, local intensity in the ER channel at each detected Whi3 centroid was then computed using a masking procedure. Specifically, a binary image was created at each detected position and dilated into a disc with radius equal to two times the standard deviation of the microscope PSF. The average intensity of the ER channel within the mask was then computed after subtraction of the camera background. We defined the threshold for co-localization as the median intensity of the ER channel throughout the cell, after automatically thresholding using the triangle method to create a mask of the cell. We found that this median intensity value corresponded approximately to the average background intensity within the ER channel outside of labeled ER structures, indicating that it was an appropriate choice for the co-localization threshold. Values of the associated intensity within the ER channel at detected puncta were expressed as a ratio of this threshold. Values greater than one were defined as co-localized.
A random number generator was used to create randomized positions of the same number of detected Whi3 puncta. Positions were defined as valid if they fell within the cell mask, did not contact the edge of the cell mask when dilated, and were separated by at least two times the standard deviation of the microscope PSF. The average intensity in the ER channel at each random position was computed using the same masking procedure described above. To validate this procedure, 50 different sets of randomized positions were generated for each cell. We used the following procedure to compute the data shown in Fig. 1c:
We computed the average of all of the local ER intensities at each detected puncta within a cell.
For a given set of randomized positions, we computed the average of all of the local ER intensities at each random position within the cell.
For each set of randomized positions, we took the ratio of the averages from steps (i) and (ii), resulting in 50 different values. A value greater than one indicates that the local intensity in the ER channel was, on average, greater at detected puncta relative to randomized puncta.
Finally, each data point in Fig. 1c was computed as the average of these 50 different ratio values.
This procedure was repeated with n = 60 cells. The average ratio of 1.62 ± 0.36 s.d. indicates that local intensity in the ER channel associated with detected Whi3 puncta was consistently greater compared to randomized puncta.
Tracking Whi3 puncta in live cells
The centroids of Whi3 puncta at each movie frame were detected using cmeAnalysis software, which then determined the local “c” values within the ER channel at each Whi3 centroid. These local intensity values in the ER channel were then expressed as a fraction of the median intensity of the ER channel throughout the cell, after masking and background subtraction. Values greater than one were defined as co-localized with the ER. Puncta centroids were linked into tracks using freely-available Matlab code from http://site.physics.georgetown.edu/matlab/. The maximum displacement between positions within a track was approximately 0.5 μm, with a maximum allowable gap of two image frames. Only tracks that included four or more image frames were accepted for further analysis. We estimated the fraction of each track’s lifetime spent co-localized with the ER by computing the proportion of frames within each track with relative, local ER intensity greater than one. Fig. 1e shows the relative, local intensity in the ER channel along three example tracks, each of which spends 100% of the lifetime co-localized with the ER. Fig 1f shows a histogram of 769 tracks, binned according to the fraction of track lifetime co-localized with the ER.
Supported lipid bilayer (SLB) preparation
Lipid films were prepared by mixing lipids in chloroform at the specified molar ratios, drying under a stream of nitrogen, and placing under vacuum for at least 2 h. All membrane compositions are provided in the figure captions. Lipid films were hydrated and resuspended in 50 mM HEPES pH 7.4, 150 mM KCl buffer at a final lipid concentration of 0.5-1 mM. Small unilamellar vesicles (SUVs) were then created by extruding lipid suspensions through 100 nm-pore filters (Whatman) or using 3 x 4 min cycles of probe sonication at 70% power (Branson Sonifier SFX150). Glass coverslips (VWR 48393-230) were treated with oxygen plasma for 15 min to clean the glass and render the surface hydrophilic. Imaging wells were created using silicone gaskets with a 13 mm-diameter hole (Grace Bio-Labs 664170), or gaskets cut from silicone sheets (Grace Bio-Labs 664172) and punched with a 5 mm-diameter hole. SUVs were added to wells at a final lipid concentration of 0.25 mM and allowed to rupture and form an SLB on the glass surface for 20 min at room temperature. The SLB was washed thoroughly, at least six times, with 50 mM HEPES pH 7.4, 150 mM KCl, 2 mM TCEP buffer to remove excess liposomes. After another 15 min period, the SLB was washed thoroughly again to ensure that all excess liposomes were removed from the well and the SLB surface. For SLBs functionalized with DOPE cap-biotin, neutravidin protein was added at a final concentration of 10 μg mL−1, incubated for 5 min, and washed repeatedly to remove unbound neutravidin before adding biotinylated CLN3 RNA.
Membrane-tethered Whi3 experiments and analysis of membrane-associated Whi3 condensates
Whi3-Atto488 was added to NTA-Ni-functionalized SLBs at the specified final concentrations and allowed to bind and form condensates for 20 min. During this time, images were collected every 30 s using TIRF microscopy. Finally, approximately 10-20 images of condensates on SLBs were acquired approximately 180 min after addition of Whi3.
Images were cropped to the center 400x400 pixels (center 1/9) of the original images to ensure even illumination across the field of view to be analyzed. Images were processed using an ImageJ script that applied an automatic threshold using the Otsu method, applied a watershed, and used the “Analyze Particles” tool (https://imagej.net/imaging/particle-analysis) to find and outline condensate edges. The resulting ROIs were used to measure condensate features, which were saved and imported into Matlab for further analysis. Condensate radii were estimated from measurements of condensate area by assuming a circular shape. The average intensity of dilute phase membrane-bound Whi3, outside of condensates, was estimated by histogramming the pixel intensities of the entire cropped image, smoothing with a 20-point moving average filter, identifying the peak intensity, and subtracting the camera background. This value was used to estimate the density of bound Whi3 proteins in the dilute phase, described in the section “Quantifying dense and dilute phase protein densities.”
To confirm that attachment to a membrane surface was required for condensate assembly, Whi3 was added to passivated, PEG-coated surfaces (described in the section “Passivating glass with PEG and PEG-biotin”) at a concentration of 50 nM. A time-lapse TIRF movie was acquired for 20 min as diffraction-limited Whi3 puncta randomly adhered to the PEG surface. Finally, 10 images of Whi3 puncta were acquired after 20 min and cmeAnalysis software was used to estimate the number of Whi3 proteins per puncta, as described in the section “Determining the intensity of single RNA and protein molecules.”
For condensate disassembly experiments, condensates were first formed on SLBs with 50 nM Whi3 and EDTA was then added to wells at a final concentration of 10 mM. Time lapse-movies of condensates were acquired for 10 min, 30 s/frame, and background-subtracted condensate intensities over time were quantified using ImageJ. As a control, 50 nM of a non-self-assembling protein, 6his-GFP, was incubated on NTA-Ni-containing SLBs for 20 min, and SLBs were washed to remove unbound protein before imaging. We found that exposure to 10 mM EDTA drove 6his-GFP to completely unbind within 1 min (Extended Data Fig. 4e). This finding supports the idea that membrane-associated Whi3 condensates may have acquired gel-like material properties that prevented rapid unbinding of protein from the membrane, as Whi3 condensates required approximately 6 min to dissolve (Fig. 2d). Of note, some Whi3 puncta remained on the membrane after dissolution by EDTA (Fig. 2d), consistent with the passive interaction of Whi3 puncta with DOPC-only membranes seen in Extended Data Fig. 4a.
To examine recruitment of CLN3 RNA from solution by membrane-bound Whi3, cmeAnalysis software was used to detect the intensities of RNA puncta as well as the associated, local average intensity in the Whi3 channel at each detected RNA puncta. RNA puncta were defined as associated with the edges of Whi3 condensates if the associated, local intensity in the Whi3 channel was greater than a threshold value of 1.25*IWM, where IWM is the median intensity of the Whi3 channel throughout the image. We found that this threshold value was in good agreement with the average intensity of condensed Whi3 patches at each time point in the movies. RNA puncta that did not meet this criteria were defined as in the “dilute” phase on the surrounding membrane. We computed the average intensity of RNA puncta in each of these categories at each time point to generate histograms and plots of RNA clustering over time.
Fluorescence recovery after photobleaching
Condensates on SLBs were bleached with a 488 nm laser and TIRF images were acquired for 10 min. A region of the SLB outside of condensates was also bleached and used for background subtraction. Fluorescence intensity values within bleached regions were exported using ImageJ. Data were normalized to prebleach levels and fitted to a single exponential recovery function, , where F(t) is the relative fluorescence intensity over time, A is the mobile fraction, and τ is the recovery time constant. Fitting was performed in Matlab 2019b software.
Passivating glass with PEG and PEG-biotin
Glass coverslips were passivated by coating with poly-L-lysine (PLL) conjugated to polyethylene glycol (PEG) and biotin-PEG, prepared according to previous protocols63, 64. Briefly, amine-reactive PEG-succinimidyl valerate (SVA) and biotin-PEG-SVA was added to a 40 mg mL−1 mixture of PLL in 50 mM sodium tetraborate pH 8.5 at a molar ratio of one PEG per five lysine subunits. PEG-biotin comprised ~2% of the total PEG amount. The mixture was stirred continuously for 6 h at room temperature and buffer exchanged into 50 mM HEPES pH 7.4, 150 mM KCl using Centri-Spin size exclusion columns (Princeton Separations). Imaging wells were made by placing silicone gaskets on oxygen plasma-treated coverslips and coated for 20-30 min with PLL-PEG diluted tenfold in 50 mM HEPES pH 7.4, 150 mM KCl. After coating, the well was washed repeatedly with the same buffer to remove excess PLL-PEG. Neutravidin was added at a final concentration of 10 μg mL−1, incubated for 5 min, and washed repeatedly again.
Surface-tethered CLN3 experiments and analysis
CLN3 RNA, hybridized to a biotinylated DNA oligo, was added to wells a final concentration of either 200 pM or 10 pM for biotin SLBs or biotin-PEG surfaces, respectively. RNA was allowed to bind to neutravidin for 15 min, and wells were washed thoroughly to remove unbound RNA. 3-5 images of RNA on SLB or PEG surfaces prior to addition of Whi3 protein were first acquired using TIRF microscopy. Whi3 protein was then added at the specified concentrations, and time-lapse images were acquired every 30 s for 10 min. Finally, approximately 10-20 images of Whi3 and CLN3 were acquired within 10-20 min after addition of Whi3 protein.
Images were cropped to the center 400x400 pixels (center 1/9) of the original images to ensure even illumination across the analyzed field of view. Images were analyzed using cmeAnalysis software with CLN3 and Whi3 specified as the master and secondary channels, respectively. We estimated the number of CLN3 and Whi3 molecules within each cluster by comparing the brightness values in each channel to the brightnesses of single molecules of CLN3-Cy3 and Whi3-Atto488, respectively (described in the next section). Finally, these values were used to compute the total mass of Whi3 and CLN3 within each cluster by multiplying by the respective molecular weight of each molecule (approximately 81 and 510 kDa for our Whi3 and CLN3 constructs, respectively).
To analyze the velocities of diffusing RNA puncta on membranes, time-lapse movies of RNA before and after addition of Whi3 were acquired for 5 s, 100 ms/frame. The RNA puncta were detected using cmeAnalysis software, and particle centroids were linked into tracks using code from http://site.physics.georgetown.edu/matlab/, with maximum displacement 0.59 μm between frames. Tracks spanning at least 4 frames were accepted for further analysis. Track velocities were extracted using the freely-available msdanalyzer package for Matlab65, which provided the instantaneous velocities between positions within each track. These values were averaged over each track to compute mean track velocities. To compute the diffusion exponent α (the slope of a linear fit to the MSD curve on log-log axes), the fitLogLogMSD function in msdanalyzer was used to fit each MSD curve, using the first 25% of each curve. α values were considered valid only if the associated fit R2 was at least 0.8.
Determining the intensity of single RNA and protein molecules
Images of single molecules were acquired by creating imaging wells on oxygen plasma-treated coverslips and adding CLN3-Cy3 or Whi3-Atto488 at a concentration of 50 pM. Images of single molecules adhered to the coverslip surface were acquired using the same TIRF and laser power settings used in SLB or PEG surfaces experiments, but with longer exposure times to acquire sufficient signal. Images were cropped to the center 400x400 pixels to ensure even illumination, and the diffraction-limited puncta of single protein molecules were detected using cmeAnalysis software. “A” values were pooled from 5-10 image frames and binned into a histogram, yielding a distribution with one clear peak corresponding to the average intensity of a single molecule. Finally, we estimated the number of molecules per puncta in experiments by comparing to this single molecule intensity, after linearly adjusting for differences in camera exposure time.
This approach was validated for Whi3-Atto488 using single-step photobleaching measurements. Specifically, 100 images of surface-adhered Whi3 proteins were acquired continuously using the same TIRF, laser, and exposure settings, and we identified puncta that bleached completely to the level of the camera background in one, clear step. We found that the average, pre-bleach peak intensities of these puncta were in agreement with our estimates from particle detection.
Quantifying dense and dilute phase protein densities
In Whi3 protein-only experiments on NTA-Ni SLBs, condensates and the surrounding SLB surface were densely covered by labeled Whi3 proteins, with relatively uniform intensities in each. The number of labeled molecules, N, per surface area, a, is given by
where I is the average, uniform intensity of either the densely labeled condensate or the dilute phase Whi3 on the surrounding SLB, and itot is the total integrated intensity of a single molecule. However, estimates of single molecule intensity obtained in the previous section correspond roughly to the integrated intensity within the full width at half maximum (FWHM) of the 2D Gaussian intensity pattern, rather than the total integrated intensity. We call this value iFWHM. Therefore, a correction factor must be applied in order to compute the number of molecules per surface area using iFWHM. This correction factor can be obtained by considering the 2D Gaussian integral in polar form. After evaluating the angular component from 0 to 2π, the normalized integral is
where is the Gaussian PSF standard deviation. When r is evaluated from 0 to ∞, the total integrated volume is itot = 1. When r is evaluated from 0 to 1.18*σ, corresponding to the Gaussian FWHM, the integrated volume is iFWHM = 0.5, indicating that the FWHM integrated intensity of a single molecule is 1/2 of the total integrated intensity. Therefore, , and the number of labeled molecules per surface area is
where a is the Gaussian PSF FWHM area. Finally, the total number of protein molecules per surface area was determined by adjusting for the known fraction of dye-labeled to unlabeled protein.
Assembly and analysis of droplets in solution
Whi3 was concentrated using a 30 kDa molecular weight cutoff centrifugal filter (Amicon) and diluted into 50 mM HEPES pH 7.4 and 2 mM TCEP buffer at the specified protein concentration such that the final KCl concentration was 75 mM. Atto488-labeled Whi3 protein was included such that approximately 0.1% of Whi3 was dye-labeled. Protein solutions were loaded into glass-bottom imaging chambers (Grace Bio-Labs). To prevent protein adsorption to the imaging surface, wells were passivated with PLL-PEG and washed thoroughly with experiment buffer prior to addition of Whi3 protein solutions. Confocal z-stacks of droplets were acquired at the specified times after droplet assembly, starting below the coverslip surface and with a z-spacing of 0.2 μm. Three z-stacks were acquired at each time point, and experiments were replicated three times. Maximum intensity projections were created from z-stacks, and images were automatically thresholded using the Otsu method and analyzed to obtain values of droplet projected area. Finally, droplet radii were calculated by assuming a circular projected area.
Fluorescence correlation spectroscopy
To ensure that all unconjugated dye was removed prior to fluorescence correlation spectroscopy (FCS) experiments, Whi3-Atto488 was buffer exchanged into 50 mM HEPES pH 7.4, 2 mM TCEP buffer containing 1 M KCl using a CentriSpin-20 size exclusion column (Princeton Separations), followed by a second buffer exchange back into 50 mM HEPES pH 7.4, 2 mM TCEP, 150 mM KCl buffer. Protein was then ultra-centrifuged for 10 min at approximately 200,000 rcfavg to remove large aggregates.
For measurements of protein diffusion at membranes, NTA-Ni SLBs were prepared as described above and washed with 50 mM HEPES pH 7.4, 150 mM KCl, and 2 mM TCEP buffer. Whi3-Atto488 was added at a concentration of 2 nM and allowed to bind the membrane for 20 min. The SLB was washed thoroughly to remove all Atto488-labeled protein from solution. Finally, unlabeled Whi3 protein was added to the well at a final concentration of 50 nM in order to match the conditions used for assembly of membrane-associated Whi3 condensates. FCS measurements of membrane-bound Whi3 were performed in the “dilute” phase, on the surrounding membrane and away from Whi3 condensates. This was achieved by imaging the SLB prior to acquisition, and checking that the average fluorescence count rate at the start of acquisition was consistent among traces. Measurements were taken at least 20 min after addition of 50 nM Whi3 to wells. For measurements of protein diffusion in solution, the glass surface was passivated with an SLB composed of DOPC alone to prevent protein adsorption, and Whi3 was added to wells at a concentration of 50 nM. Whi3-Atto488 was included in protein mixtures such that the final Atto488 dye concentration was 3-6 nM. Calibration standards of Atto488 dye alone and GFP at concentrations of 1 and 2 nM, respectively, were prepared in similar wells. For membrane-bound GFP experiments, 2 nM GFP (which contained an N-terminal 6his tag) was added to NTA-Ni SLBs, allowed to bind for 20 min, and washed thoroughly to remove unbound protein.
FCS traces were acquired on a Zeiss LSM 880 microscope equipped with a 40x water immersion objective and Zeiss ZEN Black software version 14.0.16.201. To measure protein diffusion at the membrane or free in solution, a 488 nm laser was either focused at the coverslip surface or 200 μm into solution, respectively. Fluorescence signal was collected with a Zeiss BiG.2 GaAsP detector. Each FCS trace was acquired for 100 s and fit with the 2D, single-component autocorrelation function,
where is 1/ is the number of labeled proteins in the focused laser volume, is the diffusion time, and is the anomalous diffusion coefficient. and , which correct for short time processes such as intersystem crossing, were held constant in the fitting as 0.05 and 5 μs, respectively49. Fitting was performed in Matlab 2019b software.
Using the measured of Atto488 dye, with well-characterized diffusion coefficient, , of 400 μm2/s, we computed the lateral radius of the focal volume, , by the relationship . Using this estimated , we computed the diffusion coefficients of Whi3 and GFP in solution or at membranes. To check the validity of our approach, we estimated the hydrodynamic radius, , of GFP in solution using the Stokes-Einstein relationship,
where is the Boltzmann constant, is the absolute temperature, and is the dynamic viscosity of water at room temperature. This yielded an estimated for GFP of 2.2 ± 0.6 nm s.d., in reasonable agreement with a previous estimate of 2.5 nm66.
Data availability
All data supporting the findings of this study are available from the corresponding author on reasonable request. Source data are provided with this paper.
Code availability
Data analysis was conducted using particle analysis tools in ImageJ (https://imagej.net/imaging/particle-analysis), cmeAnalysis software (https://github.com/DanuserLab/cmeAnalysis), particle tracking software (http://site.physics.georgetown.edu/matlab/), and msdanalyzer software (https://tinevez.github.io/msdanalyzer/). No custom code was generated for this study.
Biological materials
All unique biological materials are available from the corresponding author upon request.
Statistics and reproducibility
Sample sizes were not predetermined. In condensate reconstitution studies, experimental replicates were performed until the data satisfactorily captured population distributions - typically hundreds to thousands of condensates. All microscopy images from live cells, fixed cells, and in vitro studies are representative of experiments that were repeated independently on separate days with similar results using 2-4 biologically independent samples. No data was excluded during analysis. Blinding and randomization was not performed, as all microscopy experiments and related controls were performed using identical imaging conditions and analyzed using automated image analysis routines.
Extended Data
Extended Data Fig. 1. Quantifying Whi3-ER co-localization.
(a-d) Images of an Ashbya hypha expressing Whi3-tdTomato (tagged endogenously) and ER marker Sec63-GFP (plasmid expression). Images show merged channels (a), detected Whi3 puncta after particle detection (b), the same detected puncta overlaid with the ER channel (c), and a random distribution of the same number of puncta overlaid with the ER channel (d). (e) Local intensity in the ER channel at the Whi3 puncta shown in the above images, expressed as a fraction of the median intensity of the ER channel throughout the hypha after masking and background subtraction. Blue points: observed Whi3 positions, orange points: randomized Whi3 positions corresponding to the puncta in image (d). n = 16 puncta. Dashed line indicates the threshold for co-localization, corresponding to the median intensity of the ER channel. Black horizontal bars represent mean, vertical bars represent first s.d. p-value from two-tailed, unpaired Student’s t-test. (f) Ratio of the average local intensity in the ER channel at detected Whi3 puncta within the above hypha relative to randomized Whi3 puncta positions. A value greater than one indicates that the local intensity within the ER channel is greater on average at detected Whi3 puncta compared to randomized puncta. Each data point represents the ratio to one of n = 50 random distributions. The mean, indicated by the black horizontal bar, corresponds to one of the 60 data points in Fig. 1c. Vertical bar represents first s.d.
Extended Data Fig. 2. Tracking Whi3 puncta and ER co-localization.
(a) Time-lapse montages of Whi3 puncta associated with ER, including ER tubules (yellow arrowheads) and nuclear-associated ER (blue arrowheads). White dashed lines in first frame indicate cell periphery. Similar to Fig. 1d. (b) First frame from time-lapse shown in Supplementary Video 1. Yellow arrows indicate puncta that appear co-localized with the ER but moved out of the imaging plane during the movie and were not included in the tracking. (c) ER channel from the image in (b) with overlaid Whi3 tracks, colored according to the fraction of the track lifetime spent co-localized with the ER. All tracks clearly co-localize with ER structures. Not all tracks begin in the indicated frame. (d) Relative, local intensity in the ER channel as a function of time for the Whi3 tracks shown in (c), expressed as a fraction of the median intensity in the ER channel throughout the cell. Values greater than one (red region) were defined as co-localized with the ER. In this example, all tracks spend 100% of the lifetime co-localized with the ER. (e) Histogram of the tracks in (c-d), binned according to the fraction of track lifetime co-localized with the ER (similar to Fig. 1f). n = 7 tracked Whi3 puncta in this representative example from 60 hyphae. (f) Average intensity of all tracked Whi3 puncta as a function of the fraction of the track lifetime spent associated with the ER. Data points show moving average of the raw data, with lifetime fraction increments of 0.2. Data are mean ± 95% c.i. n = 83, 37, 45, 69, and 535 tracks in bins centered at 0.1, 0.3, 0.5, 0.7 and 0.9, respectively.
Extended Data Fig. 3. Particle detection and single molecule calibration.
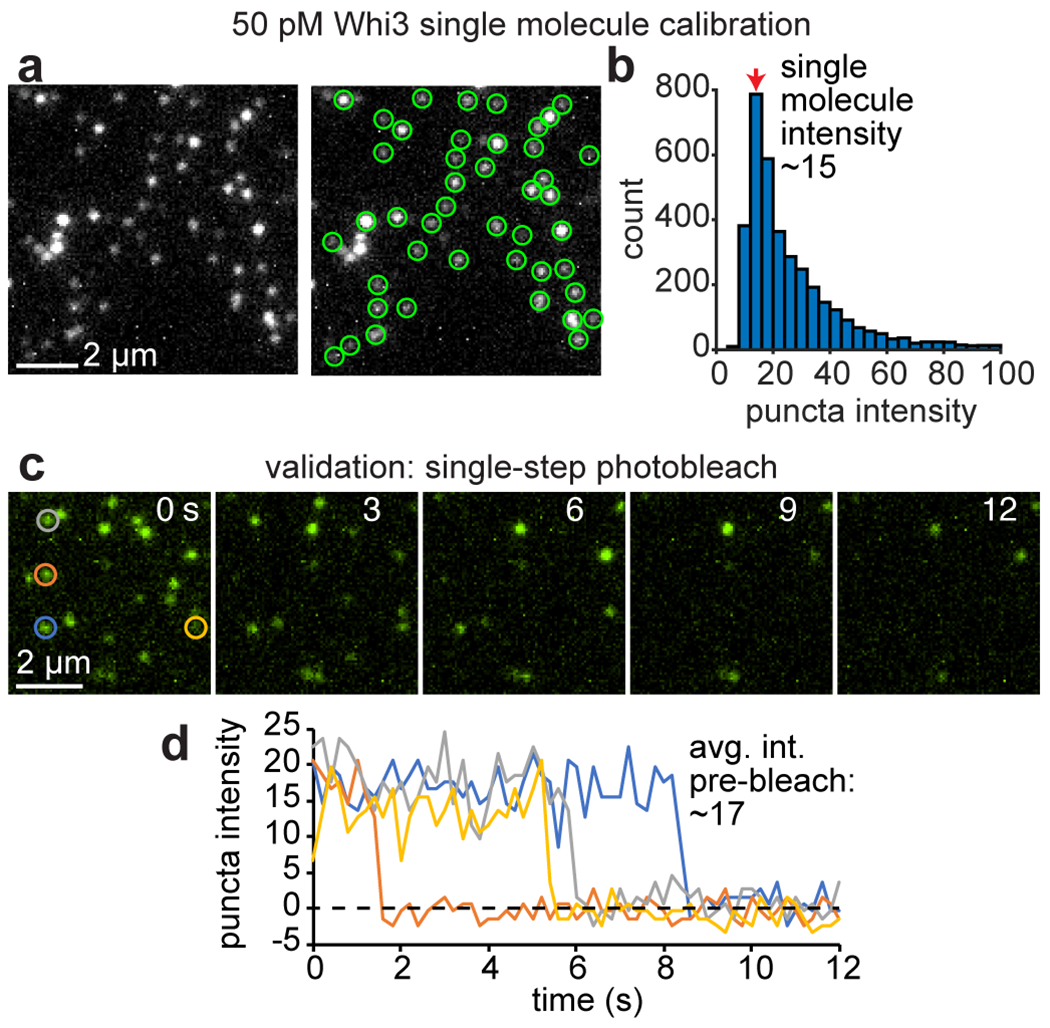
(a) TIRF image of 50 pM Whi3-Atto488 on a plasma-cleaned glass coverslip. Right image shows detected puncta from cmeAnalysis software. (b) Histogram of detected puncta intensities, obtained from fits to a two-dimensional Gaussian function with standard deviation equal to the microscope PSF. The indicated peak value (red arrow) was taken as the average intensity of a single Whi3 protein. n = 3,682 puncta from a representative example of 10 independent experiments. (c-d) This single molecule intensity estimate was validated using photobleaching measurements. (c) TIRF time-lapse of 50 pM Whi3-Atto488 puncta on glass at the indicated times. Images were acquired with the same TIRF angle, laser power, and camera exposure settings used for acquisition of single molecule calibration images in (a-b). (d) Average, background-subtracted peak intensities of the puncta in the indicated colored circles in (c). Each puncta bleaches to the level of the camera background in a single step, indicating that each puncta corresponds to a single Whi3-Atto488 protein. The average, pre-bleach intensity of each puncta was comparable to our estimate of the single molecule intensity from particle detection in (b).
Extended Data Fig. 4. Membrane binding drives Whi3 condensate assembly.
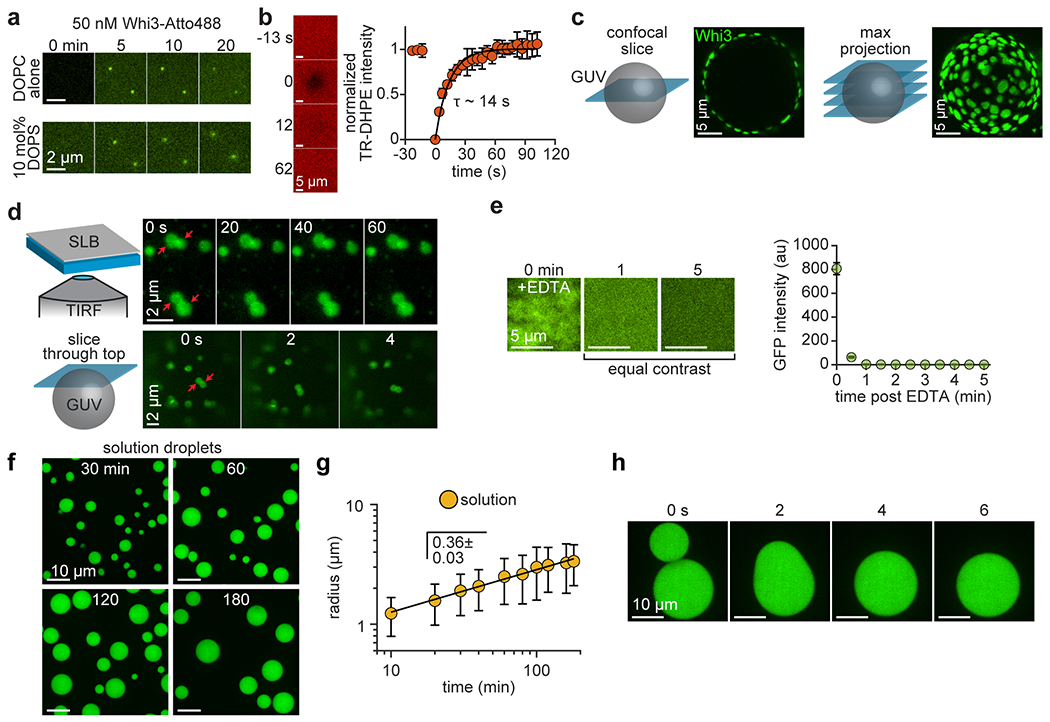
(a) Time-lapse images of SLBs composed of DOPC alone (top row) or 90 mol% DOPC + 10 mol% DOPS (lower row) at the indicated times after addition of 50 nM Whi3. Images show that Whi3 puncta non-specifically interact with SLBs, but macroscopic condensates do not form. (b) FRAP reveals rapid and complete recovery of the fluorescent lipid Texas Red (TR)-DHPE in SLBs. Plot shows normalized lipid intensity within bleached region as a function of time after bleaching. Black line shows fit to single-component exponential recovery model, with recovery time constant (τ) indicated. Data are mean ± first s.d., n = 4 bleached regions from 1 SLB. (c) Confocal section (top) and maximum intensity projection (bottom) of membrane-associated condensates assembled on a GUV after addition of 400 nM Whi3. (d) Time-lapse of membrane-associated Whi3 condensates on an SLB (top row, TIRF images) and on the top of a GUV (lower row, confocal section). Red arrows indicate contacting condensates which do not fuse or round. (e) Images of rapid and complete unbinding of membrane-bound 6his-GFP at the indicated times after addition of 10 mM EDTA. Images at 1 and 5 min are contrasted equally. Plot shows GFP intensity as a function of time after EDTA addition. Data are mean ± first s.d., n = 160,000 pixel intensity values from time-lapse images of 1 SLB. (f) Solution droplets formed with 41 μM Whi3 at the indicated times after assembly, induced by lowering the KCl concentration to 75 mM. Images are maximum intensity projections from confocal z-stacks. All images contrasted equally. (g) Average radius of solution droplets as a function of time after assembly, formed with 41 μM Whi3. Black line shows fitted power law function with indicated scaling exponent. Data are mean ± first s.d. n = 439 - 1,171 droplets per data point, from 3 biologically independent samples. Exact n per data point provided in Source Data Extended Data Fig. 4g. (h) Time-lapse of rapid droplet fusion, 4 h after assembly. GUV and SLB membrane composition: 96 mol% DOPC, 4 mol% DGS NTA-Ni; 0.03 mol% TR-DHPE included for FRAP.
Extended Data Fig. 5. RNA is clustered at the edges of pre-formed condensates.
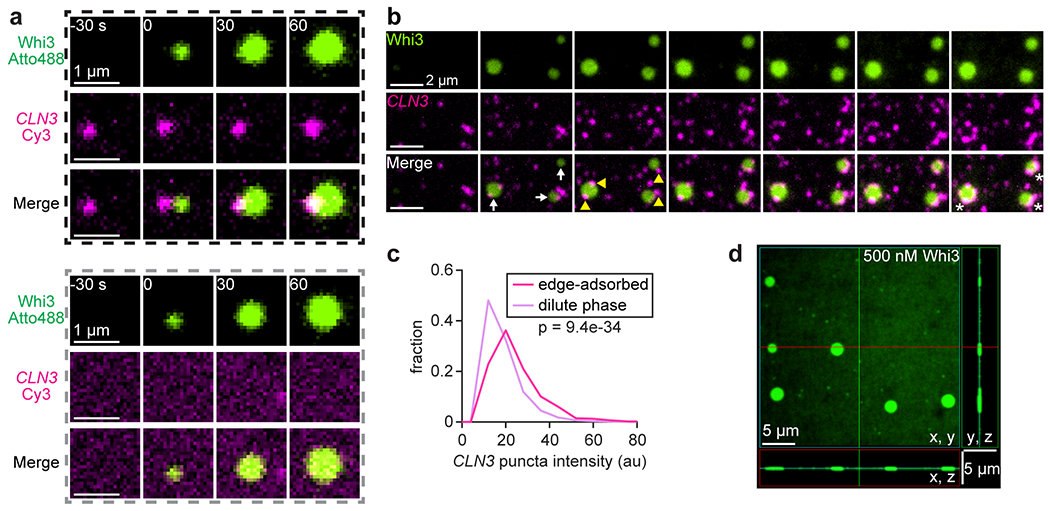
(a) Time series of two example condensates formed in the presence of 50 nM Whi3 and 100 pM CLN3. Images show condensates formed in proximity to an RNA puncta (black dashed box) and with no associated RNA (gray dashed box). (b) Time-lapse of condensate assembly on SLB with 50 nM Whi3 and 100 pM CLN3. Frames span 2.5-8.5 min after addition of Whi3, 1 min between frames. White arrows indicate Whi3 condensates visible after 3.5 min, and yellow arrowheads indicate condensate edge-associated CLN3 puncta 1 min later. White asterisks in final frames indicate bright CLN3 clusters that continued to assemble at condensate edges. (c) Intensity histograms of CLN3 puncta adsorbed to condensate edges or in the dilute phase on the surrounding membrane, 20-30 min after addition of 50 nM Whi3. n = 467 and 24,954 edge-adsorbed and dilute phase puncta, respectively, from 4 biologically independent samples. p-value from two-sided Kolmogorov-Smirnov test. (d) Membrane-associated condensates do not attain measurable height. Maximum intensity projections from a spinning disc confocal z-stack of condensates formed in the presence of 500 nM Whi3, with z-spacing of 0.2 μm. SLB membrane composition: 96 mol% DOPC, 4 mol% DGS NTA-Ni.
Extended Data Fig. 6. Membrane-tethered RNA recruits Whi3 and forms condensates.
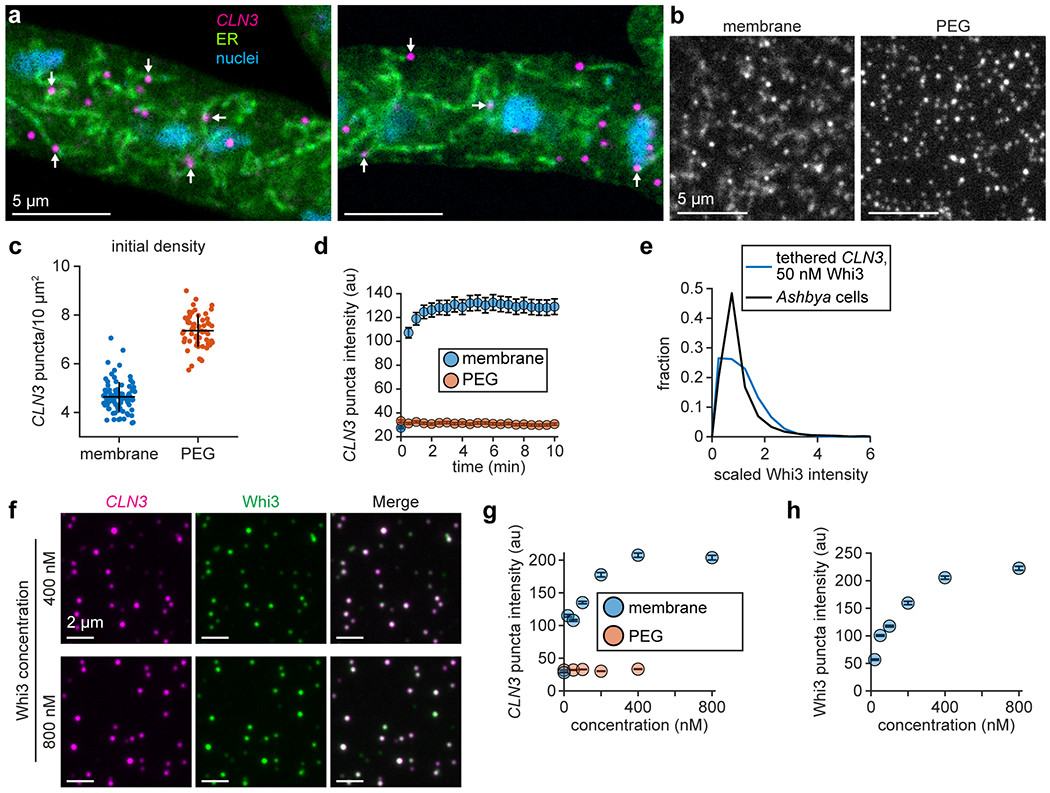
(a) Confocal slices of ER and CLN3 smFISH in Ashbya cells. Arrows indicate example CLN3 puncta showing ER co-localization. (b) Images of CLN3 puncta tethered to membrane (left) or PEG surface (right) prior to addition of Whi3. Images contrasted equally. (c) Initial densities of CLN3 puncta on membranes or PEG surfaces prior to addition of Whi3. Black bars show mean ± first s.d., n = 90 and 60 images from 18 and 12 independent membrane and PEG experiments, respectively. (d) Average CLN3 puncta intensity on membrane or PEG surfaces as a function of time after addition of 50 nM Whi3. PEG-tethered CLN3 did not recruit Whi3 or cluster to the same extent as membrane-tethered CLN3, despite the higher initial CLN3 density on PEG surfaces. Data are mean ± 95% c.i. n = 1,059 - 1,335 and 1,804 - 1,987 puncta per data point in membrane and PEG experiments, respectively, from 3 biologically independent samples in each experiment. Exact n per data point provided in Source Data Extended Data Fig. 6d. (e) Histograms of scaled Whi3 puncta intensity from Ashbya cells and membrane-tethered CLN3 experiments after clustering by 50 nM Whi3. Scaled distributions obtained by dividing by the distribution means. n = 13,198 and 867 Whi3 puncta in membrane-tethered CLN3 experiment and in live cells, respectively. (f) Membrane-tethered RNA condensates 15 min after exposure to Whi3 at the indicated concentrations. CLN3 and Whi3 channels contrasted equally in all images. (g-h) Intensity of CLN3 (g) and Whi3 (h) within membrane-tethered RNA condensates as a function of bulk Whi3 concentration. Data are mean ± 95% c.i. in (g-h). Each data point in (g-h) contains n = 7,484 - 35,945 and 9,238 - 37,992 puncta in membrane and PEG experiments, respectively, from 3 biologically independent samples in each experiment. Exact n per data point provided in Source Data Extended Data Fig. 6g,h. SLB membrane composition: 99 mol% DOPC, 1 mol% DOPE cap-biotin.
Extended Data Fig. 7. Average FCS traces of solution and membrane-bound GFP.
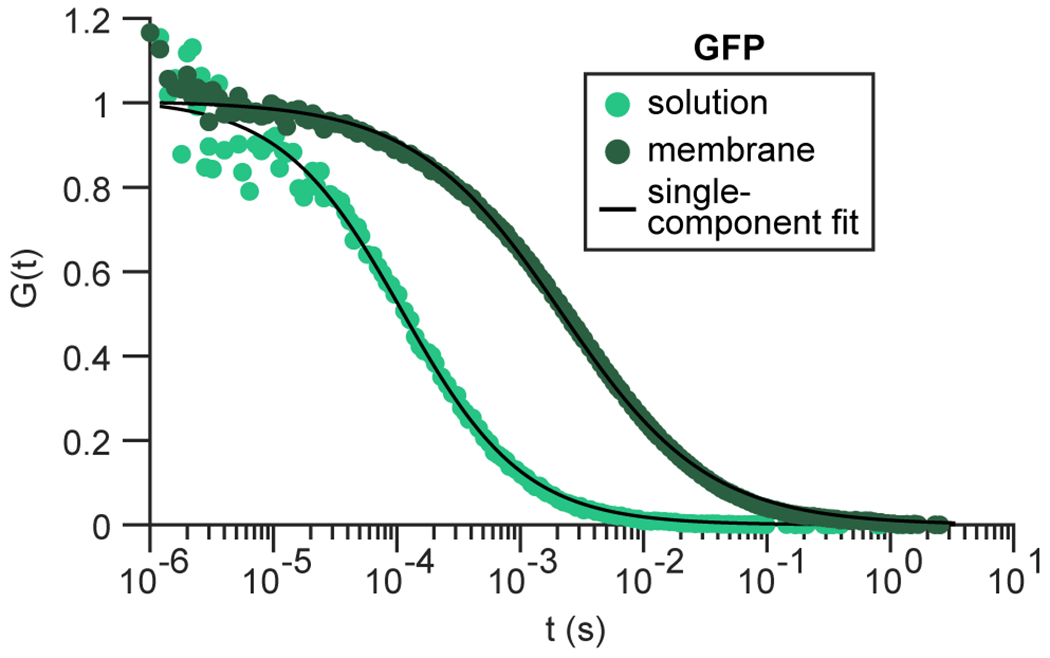
Black curves indicate fits to single-component diffusion model. n = 10 and 27 FCS traces in solution and membrane experiments, respectively. SLB membrane composition: 96 mol% DOPC, 4 mol% DGS NTA-Ni.
Supplementary Material
Supplementary Video 1
Whi3 assemblies are tethered to the ER in live Ashbya cells. Movie shows spinning disc confocal time-lapse of Ashbya hypha expressing Whi3-tdTomato (magenta) and ER marker Sec63-GFP (green). ER channel on the left, Whi3 channel in the center, and merged channels on the right, 30 s/frame.
Supplementary Video 2
Recruitment of Whi3 directly to a membrane surface drives rapid assembly of protein-only condensates. Movie shows TIRF microscopy time-lapse of planar Whi3 condensates forming on SLB following addition of 50 nM Whi3, no RNA, 30 s/frame. SLB membrane composition: 4% DGS NTA-Ni, 96% DOPC.
Supplementary Video 3
RNA is recruited from solution by membrane-bound Whi3 and forms bright clusters on the surrounding membrane outside of condensates. 100 pM of Cy3-labeled CLN3 RNA (magenta) was first added to the well, followed by 50 nM of Whi3-Atto488 (green). Movie shows TIRF microscopy time-lapse of planar Whi3 condensates forming on SLB. Whi3 channel on the left, CLN3 channel in the center, and merged channels on the right, 30 s/frame. SLB membrane composition: 4% DGS NTA-Ni, 96% DOPC.
Supplementary Video 4
RNA recruited from solution by membrane-bound Whi3 is clustered at condensate edges. 100 pM of Cy3-labeled CLN3 RNA (magenta) was first added to the experiment well, followed by 50 nM of Whi3-Atto488 (green). Movie shows TIRF microscopy time-lapse of planar Whi3 condensates forming on SLB. Whi3 channel on the left, CLN3 channel in the center, and merged channels on the right, 30 s/frame. SLB membrane composition: 4% DGS NTA-Ni, 96% DOPC.
Supplementary Video 5
Membrane-tethered CLN3 RNA recruits Whi3 from solution and rapidly clusters into punctate condensates. CLN3 RNA (magenta) was first tethered to the membrane at a density of approximately 4.6 puncta/10 μm2, and 50 nM Whi3 protein (green) was added in solution. Movie shows TIRF microscopy time-lapse of punctate Whi3/CLN3 condensates forming on SLB after addition of Whi3. CLN3 channel on the left, Whi3 channel in the center, and merged channels on the right, 30 s/frame. SLB membrane composition: 1% DOPE cap-biotin, 99% DOPC.
Supplementary Video 6
Immobile, PEG surface-tethered CLN3 RNA does not recruit Whi3 to the same extent as membrane-tethered CLN3 and does not cluster. CLN3 RNA (magenta) was first tethered to the PEG surface at a density of approximately 7.4 puncta/10 μm2, and 50 nM Whi3 protein (green) was added in solution. Movie shows TIRF microscopy time-lapse of CLN3 puncta on PEG surface after addition of Whi3. CLN3 channel on the left, Whi3 channel in the center, and merged channels on the right, 30 s/frame.
Acknowledgements
A.S.G. acknowledges funding from the National Institutes of Health (R01-GM081506), the Howard Hughes Medical Institute (HHMI) Faculty Scholars program, and the Air Force Office of Scientific Research (FA9550-20-1-0241). W.T.S. acknowledges the support of a Ruth L. Kirschstein NRSA Postdoctoral Fellowship from the National Institutes of Health (F32-GM136055). We thank Dr. Christine Roden of the Gladfelter Lab for cloning the CLN3 plasmid and performing in vitro RNA transcription; Dr. Carl Hayden (UT Austin, Austin, TX) for discussions on image analysis; Dr. Stefano Di Talia (Duke University, Durham, NC) for critical reading of the manuscript; Tony Perdue and the UNC Biology Department Imaging Core for assistance with FCS and use of the Zeiss LSM 880 microscope; Dr. Gaudenz Danuser and Dr. Sandra Schmid (UT Southwestern, Dallas, TX) for freely providing cmeAnalysis particle detection software.
Footnotes
Competing interests
A.S.G. is a scientific advisor for Dewpoint Therapeutics. All other authors declare no competing non-financial interests. All authors declare no competing financial interests.
References
- 1.Banani S, Lee H, Hyman A & Rosen M Biomolecular condensates: organizers of cellular biochemistry. Nature Reviews Molecular Cell Biology 18, 285–298 (2017). [DOI] [PMC free article] [PubMed] [Google Scholar]
- 2.Berry J, Brangwynne CP & Haataja M Physical principles of intracellular organization via active and passive phase transitions. Reports on Progress in Physics 80 (2018). [DOI] [PubMed] [Google Scholar]
- 3.Brangwynne C, Tompa P & Pappu R Polymer physics of intracellular phase transitions. Nature Physics 11, 899–904 (2015). [Google Scholar]
- 4.Shin Y & Brangwynne CP Liquid phase condensation in cell physiology and disease. Science 357 (2017). [DOI] [PubMed] [Google Scholar]
- 5.Berry J, Weber SC, Vaidya N, Haataja M & Brangwynne CP RNA transcription modulates phase transition-driven nuclear body assembly. Proceedings of the National Academy of Sciences of the United States of America 112, E5237–E5245 (2015). [DOI] [PMC free article] [PubMed] [Google Scholar]
- 6.Stanich CA et al. Coarsening dynamics of domains in lipid membranes. Biophys J 105, 444–454 (2013). [DOI] [PMC free article] [PubMed] [Google Scholar]
- 7.Weber CA, Zwicker D, Julicher F & Lee CF Physics of active emulsions. Rep Prog Phys 82, 064601 (2019). [DOI] [PubMed] [Google Scholar]
- 8.Lee DSW, Wingreen NS & Brangwynne CP Chromatin mechanics dictates subdiffusion and coarsening dynamics of embedded condensates. Nature Physics (2021). [Google Scholar]
- 9.Li P et al. Phase transitions in the assembly of multivalent signalling proteins. Nature 483, 336–340 (2012). [DOI] [PMC free article] [PubMed] [Google Scholar]
- 10.Elbaum-Garfinkle S et al. The disordered P granule protein LAF-1 drives phase separation into droplets with tunable viscosity and dynamics. Proc Natl Acad Sci U S A 112, 7189–7194 (2015). [DOI] [PMC free article] [PubMed] [Google Scholar]
- 11.Lin Y, Protter DS, Rosen MK & Parker R Formation and Maturation of Phase-Separated Liquid Droplets by RNA-Binding Proteins. Mol Cell 60, 208–219 (2015). [DOI] [PMC free article] [PubMed] [Google Scholar]
- 12.Zhang H et al. RNA Controls PolyQ Protein Phase Transitions. Mol Cell 60, 220–230 (2015). [DOI] [PMC free article] [PubMed] [Google Scholar]
- 13.Brangwynne CP et al. Germline P granules are liquid droplets that localize by controlled dissolution/condensation. Science 324, 1729–1732 (2009). [DOI] [PubMed] [Google Scholar]
- 14.Banani SF et al. Compositional Control of Phase-Separated Cellular Bodies. Cell 166, 651–663 (2016). [DOI] [PMC free article] [PubMed] [Google Scholar]
- 15.Yamazaki T et al. Functional Domains of NEAT1 Architectural lncRNA Induce Paraspeckle Assembly through Phase Separation. Mol Cell 70, 1038–1053 e1037 (2018). [DOI] [PubMed] [Google Scholar]
- 16.Lee JE, Cathey PI, Wu H, Parker R & Voeltz GK Endoplasmic reticulum contact sites regulate the dynamics of membraneless organelles. Science 367 (2020). [DOI] [PMC free article] [PubMed] [Google Scholar]
- 17.Case LB, Ditlev JA & Rosen MK Regulation of Transmembrane Signaling by Phase Separation. Annu Rev Biophys (2019). [DOI] [PMC free article] [PubMed] [Google Scholar]
- 18.Zhao YG & Zhang H Phase Separation in Membrane Biology: The Interplay between Membrane-Bound Organelles and Membraneless Condensates. Dev Cell (2020). [DOI] [PubMed] [Google Scholar]
- 19.Ditlev JA Membrane-associated phase separation: organization and function emerge from a two-dimensional milieu. J Mol Cell Biol (2021). [DOI] [PMC free article] [PubMed] [Google Scholar]
- 20.Su X et al. Phase separation of signaling molecules promotes T cell receptor signal transduction. Science 352, 595–599 (2016). [DOI] [PMC free article] [PubMed] [Google Scholar]
- 21.Huang WY et al. Phosphotyrosine-mediated LAT assembly on membranes drives kinetic bifurcation in recruitment dynamics of the Ras activator SOS. Proc Natl Acad Sci U S A 113, 8218–8223 (2016). [DOI] [PMC free article] [PubMed] [Google Scholar]
- 22.Huang WYC et al. A molecular assembly phase transition and kinetic proofreading modulate Ras activation by SOS. Science 363, 1098–1103 (2019). [DOI] [PMC free article] [PubMed] [Google Scholar]
- 23.Ditlev JA et al. A composition-dependent molecular clutch between T cell signaling condensates and actin. Elife 8 (2019). [DOI] [PMC free article] [PubMed] [Google Scholar]
- 24.Chung JK et al. Coupled membrane lipid miscibility and phosphotyrosine-driven protein condensation phase transitions. Biophys J 120, 1257–1265 (2021). [DOI] [PMC free article] [PubMed] [Google Scholar]
- 25.Banjade S & Rosen M Phase Transitions of Multivalent Proteins Can Promote Clustering of Membrane Receptors. Elife 3 (2014). [DOI] [PMC free article] [PubMed] [Google Scholar]
- 26.Case LB, Zhang X, Ditlev JA & Rosen MK Stoichiometry controls activity of phase-separated clusters of actin signaling proteins. Science 363, 1093–1097 (2019). [DOI] [PMC free article] [PubMed] [Google Scholar]
- 27.Milovanovic D, Wu YM, Bian X & De Camilli P A liquid phase of synapsin and lipid vesicles. Science 361, 604-+ (2018). [DOI] [PMC free article] [PubMed] [Google Scholar]
- 28.Wu X et al. RIM and RIM-BP Form Presynaptic Active-Zone-like Condensates via Phase Separation. Mol Cell 73, 971–984.e975 (2019). [DOI] [PubMed] [Google Scholar]
- 29.Day KJ et al. Liquid-like protein interactions catalyse assembly of endocytic vesicles. Nat Cell Biol 23, 366–376 (2021). [DOI] [PMC free article] [PubMed] [Google Scholar]
- 30.Baumann S, Pohlmann T, Jungbluth M, Brachmann A & Feldbrugge M Kinesin-3 and dynein mediate microtubule-dependent co-transport of mRNPs and endosomes. Journal of Cell Science 125, 2740–2752 (2012). [DOI] [PubMed] [Google Scholar]
- 31.Gopal PP, Nirschl JJ, Klinman E & Holzbaur ELF Amyotrophic lateral sclerosis-linked mutations increase the viscosity of liquid-like TDP-43 RNP granules in neurons. Proceedings of the National Academy of Sciences of the United States of America 114, E2466–E2475 (2017). [DOI] [PMC free article] [PubMed] [Google Scholar]
- 32.Liao YC et al. RNA Granules Hitchhike on Lysosomes for Long-Distance Transport, Using Annexin A11 as a Molecular Tether. Cell 179, 147–164 e120 (2019). [DOI] [PMC free article] [PubMed] [Google Scholar]
- 33.Fujioka Y et al. Phase separation organizes the site of autophagosome formation. Nature 578, 301–305 (2020). [DOI] [PubMed] [Google Scholar]
- 34.Agudo-Canalejo J et al. Wetting regulates autophagy of phase-separated compartments and the cytosol. Nature 591, 142–146 (2021). [DOI] [PubMed] [Google Scholar]
- 35.Ma WR & Mayr C A Membraneless Organelle Associated with the Endoplasmic Reticulum Enables 3 ‘ UTR-Mediated Protein-Protein Interactions. Cell 175, 1492-+ (2018). [DOI] [PMC free article] [PubMed] [Google Scholar]
- 36.Alenquer M et al. Influenza A virus ribonucleoproteins form liquid organelles at endoplasmic reticulum exit sites. Nature Communications 10, 19 (2019). [DOI] [PMC free article] [PubMed] [Google Scholar]
- 37.Snead WT & Gladfelter AS The Control Centers of Biomolecular Phase Separation: How Membrane Surfaces, PTMs, and Active Processes Regulate Condensation. Molecular Cell 76, 295–305 (2019). [DOI] [PMC free article] [PubMed] [Google Scholar]
- 38.Lee C et al. Protein aggregation behavior regulates cyclin transcript localization and cell-cycle control. Dev Cell 25, 572–584 (2013). [DOI] [PMC free article] [PubMed] [Google Scholar]
- 39.Lee C, Occhipinti P & Gladfelter AS PolyQ-dependent RNA-protein assemblies control symmetry breaking. J Cell Biol 208, 533–544 (2015). [DOI] [PMC free article] [PubMed] [Google Scholar]
- 40.Langdon EM et al. mRNA structure determines specificity of a polyQ-driven phase separation. Science 360, 922–927 (2018). [DOI] [PMC free article] [PubMed] [Google Scholar]
- 41.Gerbich TM et al. Phosphoregulation provides specificity to biomolecular condensates in the cell cycle and cell polarity. J Cell Biol 219 (2020). [DOI] [PMC free article] [PubMed] [Google Scholar]
- 42.Aguet F, Antonescu C, Mettlen M, Schmid S & Danuser G Advances in Analysis of Low Signal-to-Noise Images Link Dynamin and AP2 to the Functions of an Endocytic Checkpoint. Developmental Cell 26, 279–291 (2013). [DOI] [PMC free article] [PubMed] [Google Scholar]
- 43.Przybylo M et al. Lipid diffusion in giant unilamellar vesicles is more than 2 times faster than in supported phospholipid bilayers under identical conditions. Langmuir 22, 9096–9099 (2006). [DOI] [PubMed] [Google Scholar]
- 44.Beckers D, Urbancic D & Sezgin E Impact of Nanoscale Hindrances on the Relationship between Lipid Packing and Diffusion in Model Membranes. J Phys Chem B 124, 1487–1494 (2020). [DOI] [PMC free article] [PubMed] [Google Scholar]
- 45.Tanaka H Viscoelastic phase separation. J. Phys.-Condes. Matter 12, R207–R264 (2000). [Google Scholar]
- 46.Mitchison TJ Beyond Langmuir: surface-bound macromolecule condensates. Mol Biol Cell 31, 2502–2508 (2020). [DOI] [PMC free article] [PubMed] [Google Scholar]
- 47.Alshareedah I, Thurston GM & Banerjee PR Quantifying viscosity and surface tension of multicomponent protein-nucleic acid condensates. Biophys J 120, 1161–1169 (2021). [DOI] [PMC free article] [PubMed] [Google Scholar]
- 48.Reid DW & Nicchitta CV Diversity and selectivity in mRNA translation on the endoplasmic reticulum. Nat Rev Mol Cell Biol 16, 221–231 (2015). [DOI] [PMC free article] [PubMed] [Google Scholar]
- 49.Houser J et al. The impact of physiological crowding on the diffusivity of membrane bound proteins. Soft Matter 12, 2127–2134 (2016). [DOI] [PMC free article] [PubMed] [Google Scholar]
- 50.Zwicker D, Hyman AA & Julicher F Suppression of Ostwald ripening in active emulsions. Phys Rev E Stat Nonlin Soft Matter Phys 92, 012317 (2015). [DOI] [PubMed] [Google Scholar]
- 51.Wurtz JD & Lee CF Chemical-Reaction-Controlled Phase Separated Drops: Formation, Size Selection, and Coarsening. Phys Rev Lett 120, 078102 (2018). [DOI] [PubMed] [Google Scholar]
- 52.Bressloff PC Active suppression of Ostwald ripening: Beyond mean-field theory. Phys Rev E 101, 042804 (2020). [DOI] [PubMed] [Google Scholar]
- 53.Ranganathan S & Shakhnovich EI Dynamic metastable long-living droplets formed by sticker-spacer proteins. Elife 9 (2020). [DOI] [PMC free article] [PubMed] [Google Scholar]
- 54.Seim IP, A. E, Snead WT, Stormo BM, Klotsa D, Pappu RV, and Gladfelter AS Negative regulation of a ribonucleoprotein condensate driven by dilute phase oligomerization. bioRxiv (2021). [DOI] [PMC free article] [PubMed] [Google Scholar]
- 55.Ruff KM, Dar F & Pappu RV Ligand effects on phase separation of multivalent macromolecules. Proc Natl Acad Sci U S A 118 (2021). [DOI] [PMC free article] [PubMed] [Google Scholar]
- 56.Zeng M et al. Reconstituted Postsynaptic Density as a Molecular Platform for Understanding Synapse Formation and Plasticity. Cell 174, 1172–1187 e1116 (2018). [DOI] [PubMed] [Google Scholar]
- 57.Siahaan V et al. Kinetically distinct phases of tau on microtubules regulate kinesin motors and severing enzymes. Nat Cell Biol 21, 1086–1092 (2019). [DOI] [PubMed] [Google Scholar]
- 58.Tan R et al. Microtubules gate tau condensation to spatially regulate microtubule functions. Nat Cell Biol 21, 1078–1085 (2019). [DOI] [PMC free article] [PubMed] [Google Scholar]
- 59.Larson AG et al. Liquid droplet formation by HP1alpha suggests a role for phase separation in heterochromatin. Nature 547, 236–240 (2017). [DOI] [PMC free article] [PubMed] [Google Scholar]
- 60.Strom AR et al. Phase separation drives heterochromatin domain formation. Nature 547, 241–245 (2017). [DOI] [PMC free article] [PubMed] [Google Scholar]
- 61.Gibson BA et al. Organization of Chromatin by Intrinsic and Regulated Phase Separation. Cell 179, 470–484 e421 (2019). [DOI] [PMC free article] [PubMed] [Google Scholar]
- 62.Keenen MM et al. HP1 proteins compact DNA into mechanically and positionally stable phase separated domains. Elife 10 (2021). [DOI] [PMC free article] [PubMed] [Google Scholar]
- 63.Ruiz-Taylor L et al. Monolayers of derivatized poly(L-lysine)-grafted poly(ethylene glycol) on metal oxides as a class of biomolecular interfaces. Proceedings of the National Academy of Sciences of the United States of America 98, 852–857 (2001). [DOI] [PMC free article] [PubMed] [Google Scholar]
- 64.Snead WT et al. BAR scaffolds drive membrane fission by crowding disordered domains. Journal of Cell Biology 218, 664–682 (2019). [DOI] [PMC free article] [PubMed] [Google Scholar]
- 65.Tarantino N et al. TNF and IL-1 exhibit distinct ubiquitin requirements for inducing NEMO-IKK supramolecular structures. J Cell Biol 204, 231–245 (2014). [DOI] [PMC free article] [PubMed] [Google Scholar]
- 66.Lee HB et al. Rotational and translational diffusion of size-dependent fluorescent probes in homogeneous and heterogeneous environments. Phys Chem Chem Phys 20, 24045–24057 (2018). [DOI] [PubMed] [Google Scholar]
Associated Data
This section collects any data citations, data availability statements, or supplementary materials included in this article.
Supplementary Materials
Supplementary Video 1
Whi3 assemblies are tethered to the ER in live Ashbya cells. Movie shows spinning disc confocal time-lapse of Ashbya hypha expressing Whi3-tdTomato (magenta) and ER marker Sec63-GFP (green). ER channel on the left, Whi3 channel in the center, and merged channels on the right, 30 s/frame.
Supplementary Video 2
Recruitment of Whi3 directly to a membrane surface drives rapid assembly of protein-only condensates. Movie shows TIRF microscopy time-lapse of planar Whi3 condensates forming on SLB following addition of 50 nM Whi3, no RNA, 30 s/frame. SLB membrane composition: 4% DGS NTA-Ni, 96% DOPC.
Supplementary Video 3
RNA is recruited from solution by membrane-bound Whi3 and forms bright clusters on the surrounding membrane outside of condensates. 100 pM of Cy3-labeled CLN3 RNA (magenta) was first added to the well, followed by 50 nM of Whi3-Atto488 (green). Movie shows TIRF microscopy time-lapse of planar Whi3 condensates forming on SLB. Whi3 channel on the left, CLN3 channel in the center, and merged channels on the right, 30 s/frame. SLB membrane composition: 4% DGS NTA-Ni, 96% DOPC.
Supplementary Video 4
RNA recruited from solution by membrane-bound Whi3 is clustered at condensate edges. 100 pM of Cy3-labeled CLN3 RNA (magenta) was first added to the experiment well, followed by 50 nM of Whi3-Atto488 (green). Movie shows TIRF microscopy time-lapse of planar Whi3 condensates forming on SLB. Whi3 channel on the left, CLN3 channel in the center, and merged channels on the right, 30 s/frame. SLB membrane composition: 4% DGS NTA-Ni, 96% DOPC.
Supplementary Video 5
Membrane-tethered CLN3 RNA recruits Whi3 from solution and rapidly clusters into punctate condensates. CLN3 RNA (magenta) was first tethered to the membrane at a density of approximately 4.6 puncta/10 μm2, and 50 nM Whi3 protein (green) was added in solution. Movie shows TIRF microscopy time-lapse of punctate Whi3/CLN3 condensates forming on SLB after addition of Whi3. CLN3 channel on the left, Whi3 channel in the center, and merged channels on the right, 30 s/frame. SLB membrane composition: 1% DOPE cap-biotin, 99% DOPC.
Supplementary Video 6
Immobile, PEG surface-tethered CLN3 RNA does not recruit Whi3 to the same extent as membrane-tethered CLN3 and does not cluster. CLN3 RNA (magenta) was first tethered to the PEG surface at a density of approximately 7.4 puncta/10 μm2, and 50 nM Whi3 protein (green) was added in solution. Movie shows TIRF microscopy time-lapse of CLN3 puncta on PEG surface after addition of Whi3. CLN3 channel on the left, Whi3 channel in the center, and merged channels on the right, 30 s/frame.
Data Availability Statement
All data supporting the findings of this study are available from the corresponding author on reasonable request. Source data are provided with this paper.