

Abstract
Objectives
Allogeneic haematopoietic stem cell transplantation (allo‐HSCT) is the only currently available curative treatment for sickle cell disease (SCD). Here, we comprehensively evaluated the reconstitution of T‐ and B‐cell compartments in 29 SCD patients treated with allo‐HSCT and how it correlated with the development of acute graft‐versus‐host disease (aGvHD).
Methods
T‐cell neogenesis was assessed by quantification of signal‐joint and β‐chain TCR excision circles. B‐cell neogenesis was evaluated by quantification of signal‐joint and coding‐joint K‐chain recombination excision circles. T‐ and B‐cell peripheral subset numbers were assessed by flow cytometry.
Results
Before allo‐HSCT (baseline), T‐cell neogenesis was normal in SCD patients compared with age‐, gender‐ and ethnicity‐matched healthy controls. Following allo‐HSCT, T‐cell neogenesis declined but was fully restored to healthy control levels at one year post‐transplantation. Peripheral T‐cell subset counts were fully restored only at 24 months post‐transplantation. Occurrence of acute graft‐versus‐host disease (aGvHD) transiently affected T‐ and B‐cell neogenesis and overall reconstitution of T‐ and B‐cell peripheral subsets. B‐cell neogenesis was significantly higher in SCD patients at baseline than in healthy controls, remaining high throughout the follow‐up after allo‐HSCT. Notably, after transplantation SCD patients showed increased frequencies of IL‐10‐producing B‐regulatory cells and IgM+ memory B‐cell subsets compared with baseline levels and with healthy controls.
Conclusion
Our findings revealed that the T‐ and B‐cell compartments were normally reconstituted in SCD patients after allo‐HSCT. In addition, the increase of IL‐10‐producing B‐regulatory cells may contribute to improve immune regulation and homeostasis after transplantation.
Keywords: allogeneic haematopoietic stem cell transplantation, B‐cell neogenesis, peripheral homeostasis, sickle cell disease, T‐cell neogenesis
In this study, we found that allogeneic hematopoietic stem cell transplantation resets the T‐ and B‐cell compartments in sickle cell disease patients. In addition, the increase of IL‐10‐producing B‐regulatory cells after transplantation may contribute to improve immune regulation and homeostasis.

Introduction
Sickle cell disease (SCD) pathophysiology is marked by complex cellular and molecular interactions involving blood cells, the vascular endothelium and plasma factors, which contribute to vaso‐occlusion and consequent tissue injury. 1 , 2 Although the innate immune system has been extensively evaluated in this disease, 3 , 4 , 5 , 6 the role of the adaptive immune system is still poorly understood. 7 , 8 , 9 The available studies report decreased percentages of CD4+ and CD8+ T cells, increased counts of B cell subsets, especially naïve B cells, and impaired B‐cell function, including deficient antibody production. 10 , 11 , 12 , 13 , 14 , 15 , 16 , 17
The spleen is the primary organ affected in SCD patients. Multiple infarctions lead to fibrosis and organ atrophy; therefore, virtually all SCD patients present functional asplenia. 18 , 19 In general, asplenic patients have immunological impairment and lifelong risk of infections. 20 Splenectomised patients have reduced the numbers of total IgM+ memory B cells and switched B cells, 21 compromising their immunological response against encapsulated pathogens, especially pneumococci. 18 , 22 Studies already demonstrate that IgM+IgD‐CD27+ memory B cells (IgM‐only B cells) correspond to < 5% of peripheral blood B cells, while IgM+IgD+CD27+ memory B cells carry mutated immunoglobulin variable genes, 23 , 24 , 25 and these two IgM+ subsets are described as post‐germinal centre memory B‐cell subsets. 26 However, few studies have addressed these IgM+ memory B cells in SCD patients. 21 , 27 , 28
Allogeneic stem cell transplantation (allo‐HSCT) is an important curative therapy, currently available for SCD patients. Since the first allo‐HSCT in a patient with sickle cell anaemia in 1984, 29 more than 1000 SCD patients have been transplanted worldwide, with favorable outcomes. 30 The success of allo‐HSCT is closely related to the quality of the immune reconstitution after transplantation. Thymus and bone marrow functions are noteworthy important in the immune reconstitution and determine clinical outcomes after allo‐HSCT. 31 The reinstatement of a diverse peripheral T‐cell repertoire after allo‐HSCT is a continuous and long process, guaranteed by a functional thymus capable of re‐establishing the complete T‐cell ontogenesis. 32
Additionally, the B‐cell output from the bone marrow plays an important role in the rejuvenation of the adaptive immune system after allo‐HSCT in different clinical settings. 33 , 34 Particularly, regulatory B cells (Bregs) contribute to maintain the immune tolerance, limit inflammation and re‐establish immune homeostasis. 35 Bregs have also been implicated in modulation of immune reactions in transplantation settings mainly by IL‐10 secretion. 36
Little is described about T‐ and B‐cell reconstitution in SCD patients treated after allo‐HSCT. 29 , 30 , 31 , 32 We believe that a detailed assessment of the T‐ and B‐cell compartments (neogenesis and peripheral cell subsets) before and after transplantation is essential to understand the quality of the immune reconstitution in chronically inflamed SCD patients, and how it correlates with the clinical outcomes following allo‐HSCT. Therefore, here we analysed the T‐ and B‐cell compartments in 29 SCD treated with allo‐HSCT. We also evaluated the impact of the acute GvHD (aGvHD) on the T‐ and B‐cell neogenesis and on the peripheral T‐ and B‐cell subsets. Additionally, since B‐cell neogenesis was altered in SCD patients at baseline, we further investigated the phenotype and function of Bregs before and after allo‐HSCT.
Results
Clinical assessment of SCD patients after allo‐HSCT
Clinical characteristics and outcomes of the 29 SCD patients who underwent allo‐HSCT are described in Table 1. All patients had a non‐detectable spleen on ultrasonography before transplantation.
Table 1.
Clinical characteristics of SCD patients treated with allo‐HSCT
| Clinical characteristics | Number of patients | % | |
|---|---|---|---|
| Cohort | Total number of transplanted patients | 29 | – |
| Age | Age at transplantation median (range) | 19 (7–35) | – |
| Gender ratio | Male/Female |
29 16/13 |
55.2/44.8 |
| Phenotypes | HbSS | 19 | 65.5 |
| HbS/β‐thalassaemia | 8 | 27.5 | |
| HbS/C | 2 | 6.90 | |
| Indications a | VOC repeated + ACS | 10 | 34.4 |
| VOC repeated | 7 | 24.1 | |
| Stroke | 7 | 24.1 | |
| Cerebral vascular disease | 5 | 17.2 | |
| Alloimmunisation | 5 | 17.2 | |
| Priapism | 3 | 10.3 | |
| Ulcers | 3 | 10.3 | |
| Previous treatment | Chronic transfusions (CT) | 9 | 31.0 |
| Hydroxycarbamide (HU) | 7 | 24.1 | |
| CT and HU | 10 | 34.4 | |
| HLA allele | Identical siblings | 29 | 100 |
| Stem cell source | Bone marrow | 28 | 96.5 |
| Peripheral blood | 1 | ||
| Follow‐up (time points) | Pre‐transplantation | 19 | ‐ |
| 1 month | 20 | ||
| 3 months | 20 | ||
| 6 months | 18 | ||
| 1 year | 16 | ||
| 2 years | 12 | ||
| ≥ 2 years | 14 | ||
| GvHD | Acute | 11 | 37.9 |
| Chronic | 4 | 13.8 | |
| GvHD prophylaxis | CsA + MTX | 29 | 100 |
| GvHD treatment | Systemic corticosteroids | 15 | 51.7 |
| CMV reactivation b | Pre‐emptive intravenous ganciclovir | 19 | 65.5 |
| Conditioning (MAC) | FluBu | 28 | 96.5 |
| BuCy | 1 | 3.44 | |
| ABO mismatch | Major | 4 | 13.8 |
| Minor | 7 | 24.1 | |
| Bidirectional | 3 | 10.3 | |
| Graft failure c (secondary) | – | 4 | 13.8 |
| Death d | – | 1 | 3.44 |
ACS, acute chest syndrome; Bu, busulfan; CMV, cytomegalovirus; CsA, cyclosporine A; Cy, cyclophosphamide; Flu, fludarabine; GvHD, graft‐versus‐host disease; MAC, myeloablative conditioning; MTX, methotrexate; VOC, vaso‐occlusive crises.
Patients had more than one/two indications for the HSCT.
Quantification of cytomegalovirus CMV) viral loads was performed by in‐house quantitative real‐time PCR, as previously published. 65
Patients had graft failure (1 year after allo‐HSCT).
One patient died because of bone marrow aplasia.
Although all patients presented fever while in the neutropenic phase of allo‐HSCT, only three developed clinically overt infections: two bacterial pneumonias and one catheter‐related bacterial infection. Four (13.8%) of the SCD patients had secondary graft failure, 11 (37.9%) developed aGvHD, and 4 (13.8%) developed chronic GvHD (cGvHD) (Table 1). All patients who developed GvHD (acute or chronic) were successfully treated. One patient is deceased. None of the patients presented primary with graft failure.
Thymic function is normalised in SCD patients after allo‐HSCT
sjTRECs and β‐TREC levels reflect newly egressed T cells from the thymus. 37 , 38 During the first six months after transplantation, sjTREC and β‐TREC levels significantly decreased when compared to baseline and to healthy individual levels. T‐cell neogenesis started to rise between three and six months, reaching complete recovery at 12 months after allo‐HSCT (Figure 1a and b; Supplementary tables 1 and 2). The intrathymic thymocyte proliferation rate, estimated by sjTRECs/β‐TREC ratio, remained unaltered throughout follow‐up (Figure 1c; Supplementary tables 1 and 2).
Figure 1.

T‐cell neogenesis is transiently decreased following transplantation and then normalised after allo‐HSCT. Mean (± SD) total number of (a) sjTREC and (b) β‐TREC values measured by RT‐PCR before (pre‐transplantation, n = 19) and at 1 (n = 20), 3 (n = 20), 6 (n = 18), 12 (n = 16), 24 (n = 12) and > 24 (n = 14) months after allogeneic transplantation (allo‐HSCT). (c) Intrathymic T‐cell division (n) was calculated using the following formula: n = log2(sjTREC/ β‐TREC). Shaded areas indicate mean (dotted lines) and ± SD values for the group of healthy controls (n = 16). *Statistical difference between pre‐ and post‐transplantation time points (P < 0.05). ɸ Statistical difference comparing all time points (post‐transplantation) with those of the healthy control group (P < 0.05).
Reconstitution of the peripheral T‐cell compartment after allo‐HSCT
SCD patients undergoing allogeneic HSCT experience a lymphopenia phase demonstrated by reduction number of total lymphocytes in the first 3 months compared with pre‐transplant (P < 0.05) (Figure 2a and b). CD4+ T‐cell counts decreased until 6 months (P < 0.001), while CD8+ T‐cell counts were restored and increased at 6 months post‐transplantation compared with baseline (Figure 2c). Naïve CD4+ T‐cell counts were decreased in the first year after transplantation compared with baseline and healthy individual levels, and were restored only at 24 months post‐HSCT (P < 0.05) (Figure 2d). Central memory CD4+ T‐cell numbers were diminished in the first 3 months after transplantation and increased at 6 months, reaching baseline and healthy controls levels (Figure 2e). No significant differences were found for central memory CD8+ T‐cell counts, except for a decrease at 3 months post‐HSCT compared with baseline and healthy controls (P < 0.05) (Figure 2e). The numbers of effector memory and effector CD8+ T cells started to increase after 3 months post‐transplantation reaching normal levels at 24 months compared with baseline (Figure 2f and g).
Figure 2.

Reconstitution of peripheral T‐cell subsets in SCD patients following allo‐HSCT. Mean (± SD) frequency of (a) absolute number of lymphocytes and (b) CD3+ lymphocytes, (c) CD3+CD4+ and CD3+CD8+ lymphocytes, (d) naïve CD4+ T cells [(CD4+)CD27+CD45RO‐] and naïve CD8+ T cells [(CD8+)CD27+CD45RO‐], (e) central memory, (f) effector memory, (g) effector’s cells, and (h) CD4+ and recent thymic emigrant (RTE) cells. The subsets were quantified by flow cytometry before the transplant (pre‐transplant, n = 15) and following time points after allogeneic transplantation (allo‐HSCT) at 1 month, 3 and 6 months (n = 16), 12 and 24 months (n = 11) and > 24 months (n = 10). Shaded areas indicate mean (dotted lines) and ± SD values for the group of healthy controls (n = 5). *Statistical difference between pre‐ and post‐transplantation time points (P < 0.05). ɸ Statistical difference comparing all time points (post‐transplantation) with those of the healthy control group (P < 0.05). (i) Spearman’s correlation between CD4+CD35RA+CD31+ cells and sjTREC values. Different time points can be identified by different colours.
Thymic output of CD4+CD45RA+CD31+ T cells (recent thymic emigrants, RTEs) was decreased during the first 6 months post‐HSCT compared with baseline and healthy control individuals (P < 0.05). The numbers of recent thymic emigrants increased from 12 months until 24 months (Figure 2h) and correlated with sjTREC values (r s = 0.58, P < 0.0001) (Figure 2i).
Acute GvHD compromises early recovery of the T‐cell compartment after transplantation
SCD patients with aGvHD presented lower levels (P < 0.01) of sjTREC and β‐TREC at 6 months after transplantation, compared to those without GvHD (Figure 3a and b). At 12 months post‐transplantation, thymic function normalised to healthy control levels in both aGvHD and non‐GvHD patient groups (Figure 3a and b).
Figure 3.

Acute GvHD leads to a delayed T‐cell neogenesis in the first months after transplantation. Mean (± SD) of total number of (a) sjTREC and (b) b‐TREC values measured by RT‐PCR before the transplant (pre‐transplant) and following time points after allogeneic transplantation (allo‐ HSCT) at 1, 3, 6, 12, 24 and > 24 months in SCD patients who developed aGvHD and in SCD patients who did not develop GvHD. Black lines represent non‐GvHD group, and red lines represent the aGvHD group. Statistical analysis was performed using the linear regression mixed model composed of random and fixed effects. *Statistical difference between pre‐ and post‐transplantation time points in the non‐GvHD and aGvHD group (P < 0.05). For the sjTREC comparison: * aGvHD: pre‐ vs. 1m and 3 m and non‐GvHD: pre‐ vs. 1m and 3m. For the β‐TREC comparison: * aGvHD: pre‐ vs. 6m and non‐GvHD: pre‐ vs. 1m. For the CS comparison: * aGvHD: pre‐ vs. 24m and non‐GvHD: pre‐ vs. 3m; ** statistical difference between non‐GvHD and aGvHD (P < 0.05); § statistical difference between aGvHD and the healthy control group (P < 0.05); §§ statistical difference between non‐GvHD and the healthy control group (P < 0.05); other combinations were NS.
Analysis of the peripheral T‐cell compartment showed decreased naïve and central memory CD4+ T‐cell counts in SCD patients with aGvHD compared to healthy controls and SCD patients without GvHD at 1‐month post‐transplantation (Supplementary figure 1c–e). The numbers of RTEs were lower in SCD patients with or without aGvHD than in healthy controls throughout follow‐up. However, there were no differences between patients with or without aGvHD, regarding the thymic output of RTEs (Supplementary figure 1h).
B‐cell neogenesis is increased in SCD patients
B‐cell neogenesis was evaluated by quantification of sjKREC levels, which reflect the newly generated B cells, and of Cj levels that represent total B cells. The Cj/sjKREC ratio indicates the homeostatic proliferation of B cells after migration from the bone marrow, that is division rate in the periphery. 38 , 39
Before transplantation, the bone marrow exportation of newly generated B cells was significantly higher (P < 0.01) in the SCD patients than in healthy subjects (Figure 4a; Supplementary table 3). B‐cell neogenesis was drastically reduced in the first month (P < 0.01) after allo‐HSCT, but at 6 months, the amount of sjKREC recovered to baseline levels and was sustained throughout follow‐up (Figure 4a; Supplementary table 3).
Figure 4.

B‐cell neogenesis is increased in SCD patients before and after treatment with allo‐HSCT. Mean (± SD) of total number of (a) sjKREC and (b) Cj values measured by RT‐PCR before the transplant (pre‐transplant, n = 19) and following time points after allogeneic transplantation (allo‐ HSCT) at 1 month and 3 months (n = 20), 6 months (n = 18), 12 months (n = 16), 24 months (n = 12) and > 24 months (n = 14). (c) B‐cell division (n) was calculated using the following formula: n = log2(Cj/ sjKREC). Shaded areas indicate mean (dotted lines) and ± SD values for the group of healthy controls (n = 16). *P < 0.05 and ɸ P < 0.05 comparing all time point values with those of the healthy control group.
Cj and sjKREC kinetics were very similar (Figure 4b). The mean value of Cj molecules at pre‐transplant was not different from healthy controls (Figure 4b, Supplementary table 3). C j levels were significantly reduced at 1 month after allo‐HSCT compared with controls (P < 0.01) and with pre‐transplant levels (P < 0.05), but recovered to baseline levels 6 months (P > 0.05) after transplantation.
The B‐cell division rate in the periphery was significantly lower at all time periods, when compared to healthy controls (P < 0.01) (Figure 4c; Supplementary table 3). These results were confirmed by negative correlation between sjKREC levels and rate of B‐cell division (r s = −0.87, P < 0.0001) at 12 months after transplantation.
Reconstitution of the peripheral B‐cell compartment after allo‐HSCT
Since SCD patients presented high output of naïve B cells, which did not normalise after allo‐HSCT, we sought to evaluate the reconstitution of B‐cell subsets and quantify unspecific IgM and IgG levels. Absolute counts of total CD19+ and naïve B cells (CD19+CD27‐IgD+) reached baseline levels after 6 and 3 months post‐transplantation, respectively (Figure 5a and b). Moreover, the numbers of these B‐cell subsets were increased at 24 months post‐allo‐HSCT compared with baseline. These data corroborate the sjKREC and Cj results, evidencing increased generation of naïve B cells in SCD patients at baseline and after transplantation.
Figure 5.
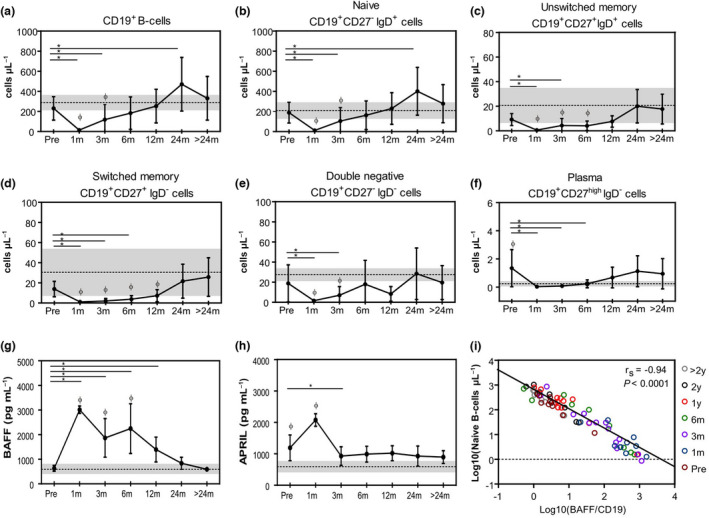
Reconstitution of peripheral B‐cell subsets in SCD patients and early increase of BAFF and APRIL serum levels following allo‐HSCT. Mean (± SD) frequency of (a) CD19+ B cells, (b) CD19+CD27‐IgD+ naïve, (c) CD19+CD27+IgD+ unswitched memory, (d) CD19+CD27+IgD‐ switched memory, (e) CD19+IgD‐CD27‐ double negative and (f) CD19+CD27highIgD‐ plasma cells immunophenotyped by flow cytometry before the transplant (pre‐transplant, n = 15) and following time points after allogeneic transplantation (allo‐HSCT) at 1 month, 3 and 6 months (n = 16), 12 and 24 months (n = 11) and > 24 months (n = 10). Shaded areas indicate mean (dotted lines) and ± SD values for the group of healthy controls (n = 5). (g) Mean (± SD) serum levels of BAFF and APRIL (h) determined before the transplant (pre‐transplant, n = 17) and following time points after allogeneic transplantation (allo‐HSCT) at 1 month and 3 months (n = 15), 6 and 12 months (n = 13), 24 months (n = 9) and > 24 months (n = 6). Shaded areas indicate mean (dotted lines) and ± SD values for the group of healthy controls (n = 4). *Statistical difference between pre‐ and post‐transplantation time points (P < 0.05). ɸ Statistical difference comparing all time points (post‐transplantation) with those of the healthy control group (P < 0.05). (i) Spearman’s correlation between CD19+ naïve B‐cell counts and BAFF concentration by CD19+ cells before the transplant and following time points after allo‐HSCT. Different time points can be identified by different colours.
In contrast, the decreased numbers of classical memory B‐cell subsets (CD19+CD27+ IgD+ unswitched memory and CD19+CD27+IgD‐ switched memory) were found at 1, 3 and 6 months after allo‐HSCT (Figure 5c and d), which recovered to healthy control levels at 12 months post‐transplantation. Moreover, IgD‐CD27high plasma cell counts were increased at baseline compared with healthy controls, normalising at 1 month but again increasing to baseline levels from 12 months after allo‐HSCT onwards (Figure 5f).
Since IgM+ memory B‐cell subsets are decreased in patients with functional asplenia, 21 we decided to quantify them in our SCD patients before and after allo‐HSCT. Frequencies of CD19+CD27+IgM+IgD+ and CD19+CD27+IgM+IgD‐ memory B‐cell subsets were retrospectively analysed in cryopreserved PBMC from the same SCD patients and were available from two different time points: baseline and 12 months after allo‐HSCT (Figure 7). Frequencies of CD19+CD27+IgM+IgD+ and CD19+CD27+IgM+IgD‐ memory B‐cell subsets were higher in SCD patients at 12 months after HSCT than in healthy individuals (Figure 7b).
Figure 7.

Increased IL‐10 production by regulatory B‐cell subsets after allo‐HSCT. (a) Gating strategy of one representative patient demonstrating the frequency of CD19+CD24hiCD38hi transitional and CD19+CD24hiCD27+ memory regulatory B cells (Bregs) immunophenotyped by flow cytometry. (b) Frequency of CD19+CD24hiCD38+ and CD19+CD24hiCD27+ regulatory B cells from a group of healthy control individuals (n = 6), before the transplant (pre‐transplant, n = 6) and at 12 months (n = 6) after transplantation. (c) Total PBMCs from allo‐HSCT SCD patients before the transplant (pre‐transplant, n = 6) and at 12 months (n = 6) after transplantation and from a group of healthy control individuals (n = 6) were cultured for 18 hours with CpG or CpG and rhCD40L followed by restimulation with phorbol myristate acetate + ionomycin + BFA (PIB) in the last 6 hours of culture, fixed and permeabilised. Intracellular IL‐10 was assessed in CD19+ B cells by flow cytometry. The position of all gates was determined using isotype‐matched control mAb staining. Negative controls consisted of PBMCs cultured in the presence of CpG control and BFA. These data are representative of those obtained in six independent experiments. Numbers in the boxes represent the frequency of IL‐10‐producing CD19+ cells. (d) Quantification (%) of IL‐10‐producing CD19+ cells from a group of healthy control individuals (n = 6), before the transplant (pre‐transplant, n = 6) and at 12 months (n = 6) after transplantation and Spearman’s correlation with log10(sjKREC/150.000 PBMC) one year after allo‐HSCT. (e) IL‐10 expression by CD19+CD24hiCD38hi and CD19+CD24hiCD27+ Bregs from a group of healthy control individuals (n = 6), before the transplant (pre‐transplant, n = 6) and at 12 months (n = 6) after transplantation. *Statistical difference (P < 0.05).
Additionally, we evaluated serum levels of BAFF and APRIL, which are growth factors essential for B‐cell homeostasis (Figure 5g and h). Serum BAFF levels were markedly increased during 24 months after allo‐HSCT compared with baseline and with control levels (Figure 5g). We found a negative correlation between BAFF/CD19+ B‐cell ratio and naïve B‐cell generation (Figure 5i). Throughout follow‐up, sjKRECs and Cj correlated with naïve and total B cells, respectively (Figure 6a and b). Additionally, BAFF/CD19+ B‐cell ratio correlated negatively with sjKREC levels (Figure 6c). APRIL concentrations were increased in SCD patients compared with healthy controls. APRIL serum levels were highly increased early after transplantation and then returned to baseline levels (Figure 5h).
Figure 6.

F Correlations of parameters related to B‐cell neogenesis and proliferative state. Spearman’s correlation between frequency of (a) naïve B cells and sjKREC/150 000 PBMC counts, (b) CD19+ B cells and Cj/150 000 PBMC counts and (c) BAFF concentration by CD19+ cells and sjKREC/150 000 PBMC counts before the transplant and following time points after allo‐HSCT. Different time points can be identified by different colours. y, years; m, months; pre, pre‐transplantation period.
Acute GvHD did not affect the recovery of the peripheral B‐cell compartment after HSCT
Additionally, we evaluated whether the development of aGvHD affected the recovery of the B‐cell neogenesis and peripheral subsets. Neither sjKREC/Cj levels nor B‐cell divisions were different in SCD patients with aGvHD and without GvHD following allo‐HSCT (Supplementary figure 3). Therefore, we suggest that B‐cell neogenesis is not impaired by the occurrence of aGvHD. Peripheral B‐cell subsets presented similar reconstitution dynamics in patients with aGvHD and without GvHD (Supplementary figure 4). Levels of BAFF and APRIL were found to be elevated in patients with aGvHD at 6 months and 1 month, respectively, compared to patients without aGvHD (Supplementary figure 4g and h).
Modulation of inflammatory cytokine levels after allo‐HSCT
We also evaluated serum levels of TNF‐α, IL‐8 and IL‐18 to understand the inflammatory status after transplantation and its influence on B‐ and T‐cell neogenesis. Serum levels of TNF‐α were increased at one and 24 months after allo‐HSCT when compared to baseline, and at all time points when compared to the group of healthy individuals (P < 0.05) (Supplementary figure 5a). Concentrations of IL‐18 were increased at baseline and at one month after transplantation when compared to healthy individuals (P < 0.05) and decreased at 3 months. When compared to baseline, IL‐18 levels were increased at 24 months after allo‐HSCT (Supplementary figure 5b). Serum levels of IL‐8 were increased only at one month after allo‐HSCT compared with baseline (Supplementary figure 5c).
Increased frequencies of regulatory and IL‐10‐producing B cells after allo‐HSCT
Bregs are very important components of the B‐cell compartment and modulate immune responses mainly by the production of IL‐10. 40 , 41 , 42 , 43 Frequencies of CD19+CD24hiCD38hi transitional Bregs and CD19+CD24hiCD27+ B10 Bregs 44 were higher at 12 months post‐transplantation than at baseline (11% vs. 8.1% and 14% vs. 9%, respectively) albeit not statistically significant (Figure 7b). Figure 7a and c illustrates the gating strategies to analyse regulatory B‐cell subsets.
Percentages of total CD19+IL‐10+ were increased at one year after allo‐HSCT compared with baseline (P = 0.03) (Figure 7d) and positively correlated with sjKREC counts (r s = 0.88, P = 0.01).
We further evaluated IL‐10 expression by CD19+CD24hiCD38hi and CD19+CD24hiCD27+ Bregs (Figure 7e). At 12 months post‐transplantation, expression of IL‐10 by CD19+CD24hiCD38hi Bregs in SCD patients was higher than in healthy controls (P = 0.02), and expression of IL‐10 by CD19+CD24hiCD27+ Bregs was higher than at baseline (P = 0.04) (Figure 7e).
Discussion
Allo‐HSCT is an established treatment for SCD patients, which mitigates disease manifestations, and is associated with the possibility of cure or long‐term improvement of quality of life. 30 , 45 Herein, we evaluated the impact of allo‐HSCT on T‐ and B‐cell compartments of SCD patients, since the immunological status has a key role in the success of transplantation. 46 We show that SCD patients have increased B‐cell neogenesis at baseline compared with healthy controls and that allo‐HSCT partially restores these abnormalities.
sjTRECs are surrogate markers of thymic function, useful for monitoring of the immune reconstitution after allo‐HSCT. Low sjTREC counts are associated with poor clinical outcomes and vulnerability to infections. 32 Before transplantation, the SCD patients included in this study presented normal sjTREC levels and intrathymic division rates, reflecting normal T‐cell neogenesis. Decreased thymic exportation of naïve T cells is expected in the early periods after allo‐HSCT, because of the intense myeloablative conditioning regimen and of the delay in thymic recovery. 31 , 46 Indeed, in our patients, sjTREC levels decreased in the first 6 months after allo‐HSCT, but normalised within the next 6 months, indicating adequate immune reconstitution.
Young age may have contributed to a favorable recovery of thymic function in our cohort of SCD patients. Patients younger than 25 years usually restore thymic function within the first year after allo‐HSCT. 47 Conversely, advanced age may negatively affect T‐cell neogenesis and intrathymic proliferation. 48 Our patients had a median age of 19 years at time of transplantation and received haematopoietic stem cells from younger siblings, which may explain their effective and early thymic rebound following transplantation. The transient impact of aGvHD on thymic function in those young patients is also consistent with previous data in other allo‐HSCT settings. 47
One year and 2 years after allo‐HSCT, SCD patients still presented systemic inflammation, evidenced by high serum levels of TNF‐α and IL‐18. In addition, one third of our patients developed aGvHD after transplantation, which has a deleterious impact on T‐cell repertoire diversity, 47 as well as on the clonal expansion of alloreactive T cells. 49 Patients with aGvHD presented a transiently abnormal T‐cell neogenesis in the first months after transplantation, in accordance with previous studies. 47 , 50 This suggests a minimal impact of SCD on the thymic microenvironment with no impairment of the thymic regenerative properties in such patients.
In our SCD patients, we found increased B‐cell neogenesis that was not reverted after allo‐HSCT. B‐cell hyperfunction, persisting after surgical splenectomy, has been reported in children with immune thrombocytopenic purpura. 51 In this setting, we conjecture that the high output of naïve B cells from the bone marrow is a compensatory mechanism to the decreased numbers of peripheral memory B‐cell subsets, especially the IgM+ memory B cells, which have been related to impaired splenic function in SCD patients. 21 , 22 , 52 The long time after allo‐HSCT re‐occurrence of some pre‐transplant characteristics of the B‐cell compartment suggests a persistent impact of the abnormal bone marrow and/or spleen SCD environment on B‐cell development and homeostasis in those patients, conversely to our observations in thymic function.
We also speculate that persisting inflammation may affect the haematopoietic progenitor cells, 53 as demonstrated in Sβ thalassaemia patients, and consequently overstimulate B‐cell neogenesis in SCD. In fact, bone marrow aspirates from SCD patients showed increased inflammation and aggregation, contributing to significant differences in the quality of haematopoietic stem cell progenitors. 54 Accordingly, we found persistent inflammation, marked by high plasma levels of pro‐inflammatory cytokines after transplantation compared with baseline and with healthy individuals. Furthermore, high levels of BAFF and APRIL were found in SCD patients early after transplantation compared with those at baseline. BAFF has a crucial role in the reconstitution of B cells, is a key regulator of B‐cell homeostasis 55 , 56 and thus might affect B‐cell neogenesis in SCD patients. APRIL promotes IL‐10 production and regulatory functions of human B cells 57 and can trigger different responses in vitro, including survival and proliferation of human B cells. 58 APRIL also correlates with IL‐10 levels in inflamed tissue of arthritis patients, indicating its relevance in immune homeostasis and immunopathology. 59
In the past few years, regulatory functions of B cells have been described, in addition to their essential roles in antigen presentation, cytokine secretion and antibody production. 40 , 41 Regulatory B cells (Bregs) can modulate immune responses mainly by the production of IL‐10. 40 , 41 The absence of Bregs and/or dysfunctional Bregs can exacerbate inflammatory responses in autoimmune diseases. 42 , 43 Here, we demonstrated increased frequencies of IL‐10‐producing CD19+ cells at 12 months after allo‐HSCT, compared with baseline levels. Moreover, we showed higher IL‐10 expression by CD19+CD24hiCD38hi and CD19+CD24hiCD27+ regulatory B cells in SCD one year after transplantation compared with baseline and with healthy controls, respectively. Transitional B cells (CD19+CD24hiCD38hi) are the first B‐cell population to be detected in the peripheral blood after allo‐HSCT. 60 They are necessary developmental intermediates for the generation of human mature B cells. 60 In the months that follow allo‐HSCT, the percentage of transitional B cells progressively decreases, while the frequency of mature naïve B‐cell increases. 60
Altogether, our findings indicate that allo‐HSCT improves, but not fully restores the B‐cell compartment in SCD patients. Regardless of the persistent increase in sjKREC levels after transplantation, the newly produced Bregs are more functional, the absolute numbers of memory B cells increase, and the percentages of IgM+ memory B‐cell subsets also rise. The increased IL‐10‐producing B‐regulatory cells after transplantation may be additionally beneficial to SCD patients, possibly modulating the chronic inflammatory state.
We acknowledge here some limitations of this work. First, this study lacked a treatment control and a non‐SCD transplanted control group of patients for comparisons. The use of healthy controls did not allow us to assess the relative impact of splenectomy in the T‐ and B‐cell compartments. In fact, to determine whether SCD pathogenesis affects the reconstitution of T‐ and B‐cell compartments after allo‐HSCT, we would need an age‐matched group of patients with other haematological conditions (with an intact spleen, such as aplastic anaemia) also treated with allo‐HSCT. Second, eight of the initial 20 enrolled patients were followed only up to 1 year post‐HSCT because of the study inclusion period. Except for one patient who died because of secondary graft failure, we were not able to detect differences in age, sex and immunological status between these patients and those who completed follow‐up. Nevertheless, there is a potential risk of bias, concerning the T‐cell reconstitution results, which should be acknowledged. In this context, interpretation of early post‐transplant T‐cell reconstitution is challenging because of the presence of donor T cells infused with the graft and/or residual recipient T cells, before stable mixed chimerism is achieved in the patients. Third, the mechanism of increased B‐cell neogenesis in SCD patients at baseline, which persists after allo‐HSCT, remains to be explored for the same reason. These issues are of interest for further evaluations on a new controlled study. Finally, most patients with aGvHD were under immunosuppressive treatment with either steroids or other immunosuppressants, which may also have affected the immune reconstitution evaluation.
In conclusion, we demonstrate that the T‐ and B‐cell compartments are normally reconstituted in SCD patients treated with allo‐HSCT. The occurrence of aGvHD only transiently affected reconstitution of the adaptive immune system. We also found favourable immunological outcomes of allo‐HSCT in SCD that may benefit patients beyond the original purpose of the procedure, such as the increased frequency of IL‐10‐producing regulatory B cells. This knowledge may be used in future to improve allo‐HSCT protocols for SCD patients.
Methods
Study design
Twenty‐nine SCD patients who underwent HLA‐identical sibling allo‐HSCT at the Ribeirão Preto Medical School, University of São Paulo, Brazil, were prospectively evaluated for immune reconstitution. The median (range) age was 19 (7–35) years, and 16 (55%) were men. Table 1 describes patient baseline characteristics, clinical outcomes and details about the procedure. A control group consisted of 16 healthy individuals, matched by age/gender/ethnicity with the patients (median age 22.5, range 11–33 years; eight men). This study followed the Good Practice Guidelines and was approved by the local institutional review board (N. 1.011.064/2015 and 1.095.730355/2015). Written consent was obtained from each participant or his/her legal representative at study enrolment. Supplementary figure 6 illustrates the study design.
Graft failure was classified as primary, when patients never achieved absolute neutrophil count > 0.5 × 10⁹ L‐1, or as secondary, when patients lost donor chimerism, identified through a qualitative variable number of tandem repeat (VNTR) analysis. 61 Intravenous methotrexate and cyclosporine A were used as GvHD prophylaxis, according to institutional protocol. The presence of GvHD and classification of acute (aGvHD) and chronic GvHD were defined according to the Glucksberg modified score and the National Institutes of Health 2014 criteria, respectively. 62 , 63 First‐line treatment consisted of corticosteroids (1 mg kg−1 day−1 in moderate/severe chronic GvHD, and 2 mg kg−1 day−1 in aGvHD grades II‐IV) started immediately upon diagnosis of GvHD. Patients were retrospectively clustered into aGvHD patients who developed acute GvHD, and non‐GvHD patients who did not develop acute or chronic GvHD after allo‐HSCT. The immunological analyses did not include patients who developed only chronic GvHD because of limited number (N = 4).
Peripheral blood samples were collected from SCD patients prior to (Pre, pre‐transplantation, or baseline) and at 1, 3, 6, 12, 24 and > 24 months after transplantation. Patients were evaluated for previous surgical extraction and for size of the spleen, by analysis of medical records and abdominal ultrasound reports, respectively.
Evaluation of T‐ and B‐cell neogenesis
Peripheral blood mononuclear cells (PBMCs) were isolated using the Ficoll–Hypaque density gradient centrifugation (GE Healthcare, Chicago, IL, USA). Genomic DNA was purified from PBMCs using the DNeasy Blood and Tissue Kit (Qiagen, Valencia, CA, USA) according to the manufacturer’s recommendations. T‐cell neogenesis was assessed by the quantification of signal‐joint and β‐chain TCR excision circles (sjTREC and β‐TREC). B‐cell neogenesis was determined by quantification of signal‐joint and coding‐joint K‐chain recombination excision circles (sjKREC and Cj) through real‐time quantitative PCR (RTqPCR) (ViiA7 Real‐Time PCR System; Applied Biosystems, CA, USA) as previously described. 47 , 55 Multiplex amplification and final quantification of sjTREC, β‐TREC, sjKREC and Cj have been previously published. 38 Data were validated if at least 50.000 genome equivalents were detected by albumin qPCR, and results were expressed as log10(value/150.000 PBMC).
Quantification of T‐ and B‐cell peripheral subsets
Fresh peripheral whole blood samples were immunophenotyped with predetermined optimal antibody concentrations to quantify T‐ and B‐cell peripheral subsets. The following anti‐human monoclonal antibodies (mAbs) were used to quantify B‐cell subsets: CD19 (HIB19), CD27 (L128) and immunoglobulin D (IgD) (IA6‐2) from BD Pharmingen (San Diego, CA, USA). For quantification of T‐cell subsets, we used the following mABs: CD3 (UCHT1), CD4 (RPA‐T4), CD8 (RPA‐T8), CD45RA (HI100), CD45RO (UCHL1), CD27 (L128) and CD31 (WM59), from BD Pharmingen. Cells were acquired in a FACSCalibur flow cytometer (Becton‐ Dickinson, San Jose, CA, USA), and data were analysed by the Flow Jo (TreeStar, USA) software. Gating strategies are shown (Supplementary figures 6–8), and results are expressed as absolute cell numbers.
Quantification of serum BAFF and APRIL levels
Soluble BAFF and APRIL concentrations were determined by multiplex bead array technology (Magnetic Luminex Assay; R&D System Inc., MN, USA). Plates were read on the Bio‐Plex® 200 platform (Bio‐Plex; Bio‐Rad Laboratories Inc., CA, USA).
Frequency analyses of IL‐10‐producing total B cells or B‐cell subsets
PBMCs were cryopreserved in 10% dimethyl sulphoxide and stored at −80°C in liquid nitrogen. For the experiments, PBMCs were thawed directly in 37°C heated RPMI 1640 complete medium (Sigma‐Aldrich, St. Louis, MO, USA) supplemented with 10% inactivated human AB serum and 1% penicillin/streptomycin. Then, the cells were washed in 10X PBS supplemented with 5% citrate‐dextrose solution (Sigma‐Aldrich), resuspended in fresh complete RPMI medium and plated in a 96‐well U‐bottom plate at a concentration of 1 × 10⁶ cells mL‐1. Analysis of IL‐10 production from B cells was evaluated by two in vitro methods upon stimulation with CpG (cytosine guanine dinucleotide [CpG] ± CD40L), as previously described. 38 After 24 h of incubation, cells were stained for CD19 surface marker and permeabilised IL‐10 was detected by anti‐IL‐10 isotype‐matched control. In the same assay, one well with no activated cells was separated for evaluation of the frequency of B‐cell subsets using the following anti‐human monoclonal antibodies (mAbs): CD19 (HIB19), CD27 (L128), CD38 (HIT2), immunoglobulin M (IgM) (G20‐127) and immunoglobulin D (IgD) (IA6‐2) from BD Pharmingen (San Diego). Cells were acquired in a FACSAria II flow cytometer (Becton‐Dickinson), and data were analysed by the Flow Jo (TreeStar) software.
Statistical analysis
Data were analysed by the SAS software (SAS Institute Inc. 2008. SAS/STAT® 9.2 User’s Guide. SAS Institute Inc., Cary, NC, USA) assuming a significance level of 5% (P < 0.05). Statistical significance was evaluated longitudinally using the linear regression mixed model composed of random and fixed effects. This model allows multiple longitudinal observations per individual across a baseline period and subsequent time points after transplantation, and applies to the analysis of data on which responses are grouped (more than one measure to the same individual) and the assumption of independence among observations in the same group is not adequate. 64 Fixed effects are groups and periods. Random effects are associated with patients since it is necessary to control correlations among repeated measures. For variable frequency, we used a logarithmic transformation to fit data to the proposed model.
Conflict of interests
The authors declare no conflict of interest.
Author contribution
Luciana Ribeiro Jarduli Maciel: Conceptualization; Data curation; Formal analysis; Investigation; Methodology; Validation; Visualization; Writing – original draft; Writing – review & editing. Julia Teixeira Cottas Azevedo: Data curation; Formal analysis; Investigation; Methodology. Emmanuel Clave: Data curation; Formal analysis; Investigation; Methodology; Writing – review & editing. Thalita Cristina de Melo Costa: Investigation; Writing – review & editing. Lucas Coelho Marlière Arruda: Data curation; Formal analysis; Investigation; Methodology. Isabelle Fournier: Formal analysis; Investigation; Methodology. Patrícia V. B. Palma: Formal analysis; Methodology. Keli Lima: Formal analysis; Methodology. Juliana Bernardes Elias: Investigation. Ana Beatriz Pereira Lima Stracieri: Investigation. Fabio Pieroni: Investigation. Renato Cunha: Investigation. Luiz Guilherme Darrigo Júnior: Investigation. Carlos Eduardo Settani Grecco: Investigation. Dimas Tadeu Covas: Funding acquisition; Resources. Ana Cristina Silva Pinto: Investigation; Methodology; Writing – review & editing. Gil Cunha De Santis: Investigation; Writing – review & editing. Belinda Pinto Simões: Conceptualization; Investigation; Writing – review & editing. Maria Carolina Oliveira: Conceptualization; Investigation; Writing – original draft; Writing – review & editing. Antoine Toubert: Funding acquisition; Investigation; Methodology; Resources; Writing – original draft; Writing – review & editing. Kelen Cristina Ribeiro Malmegrim: Conceptualization; Data curation; Funding acquisition; Investigation; Project administration; Resources; Supervision; Validation; Visualization; Writing – original draft; Writing – review & editing.
Supporting information
Supplementary figures 1–9
Supplementary tables 1‐4
Acknowledgments
The authors thank the Regional Blood Center of Ribeirão Preto, the Transplantation Unit of the University Hospital, Ribeirão Preto Medical School. Antoine Toubert and Emmanuel Clave are funded by the French Government’s Investissement d’Avenir Program, Laboratoire d’Excellence ‘Milieu Intérieur’ Grant ANR‐10‐LABX‐69‐01 and by the Agence Nationale de la Recherche (Projects RANKLthym ANR‐19‐ CE18‐0021‐02 and Hu‐Thy‐L ANR‐21‐CE15‐0008‐01). INSERM UMR 1160 is a member of OPALE Carnot Institute, the Organization for Partnerships in Leukemia, Institut de Recherche Saint‐Louis, Hôpital Saint‐Louis, Paris, France (www.opale.org). We thank Sandra Navarro Besciane for the graphic design. The study was supported by the São Paulo Research Foundation (FAPESP, grants #2014/03668‐1 [LRJ] and #2016/11544‐0 [LRJ]), by the Center for Cell‐Based Therapy (FAPESP, grant #2013/08135‐2 [DTC]) and INSERM.
References
- 1. Ware RE, de Montalembert M, Tshilolo L, Abboud MR. Sickle cell disease. Lancet 2017; 390: 311–323. [DOI] [PubMed] [Google Scholar]
- 2. Odièvre M‐H, Verger E, Silva‐Pinto AC, Elion J. Pathophysiological insights in sickle cell disease. Indian J Med Res 2011; 134: 532–537. [PMC free article] [PubMed] [Google Scholar]
- 3. Hounkpe BW, Fiusa MML, Colella MP et al. Role of innate immunity‐triggered pathways in the pathogenesis of Sickle Cell Disease: a meta‐analysis of gene expression studies. Sci Rep 2015; 5: 17822. [DOI] [PMC free article] [PubMed] [Google Scholar]
- 4. Zhang D, Xu C, Manwani D, Frenette PS. Neutrophils, platelets, and inflammatory pathways at the nexus of sickle cell disease pathophysiology. Blood 2016; 127: 801–809. [DOI] [PMC free article] [PubMed] [Google Scholar]
- 5. Kato GJ, Piel FB, Reid CD, Gaston MH et al. Sickle cell disease. Nat Rev Dis Prim 2018; 4: 18010. [DOI] [PubMed] [Google Scholar]
- 6. Allali S, Maciel TT, Hermine O, de Montalembert M. Innate immune cells, major protagonists of sickle cell disease pathophysiology. Haematologica 2020; 105: 273–283. [DOI] [PMC free article] [PubMed] [Google Scholar]
- 7. de Azevedo JTC, Malmegrim KCR. Immune mechanisms involved in sickle cell disease pathogenesis: current knowledge and perspectives. Immunol Lett 2020; 224: 1–11. [DOI] [PubMed] [Google Scholar]
- 8. Balandya E, Reynolds T, Obaro S, Makani J. Alteration of lymphocyte phenotype and function in sickle cell anemia: implications for vaccine responses. Am J Hematol 2016; 91: 938–946. [DOI] [PMC free article] [PubMed] [Google Scholar]
- 9. Garcia NP, Júnior ALS, Soares GAS, et al. Sickle cell anemia patients display an intricate cellular and serum biomarker network highlighted by TCD4+CD69+ lymphocytes, IL‐17/MIP‐1β, IL‐12/VEGF, and IL‐10/IP‐10 Axis. J Immunol Res 2020; 2020: 4585704. [DOI] [PMC free article] [PubMed] [Google Scholar]
- 10. Koffi KG, Sawadogo D, Meite M et al. Reduced levels of T‐cell subsets CD4+ and CD8+ in homozygous sickle cell anaemia patients with splenic defects. Hematol J 2003; 4: 363–365. [DOI] [PubMed] [Google Scholar]
- 11. Kaaba SA, Al‐Harbi SA. Reduced levels of CD2+ cells and T‐cell subsets in patients with sickle cell anaemia. Immunol Lett 1993; 37: 77–81. [DOI] [PubMed] [Google Scholar]
- 12. Bao W, Zhong H, Li X et al. Immune regulation in chronically transfused allo‐antibody responder and nonresponder patients with sickle cell disease and β‐thalassemia major. Am J Hematol 2011; 86: 1001–1006. [DOI] [PMC free article] [PubMed] [Google Scholar]
- 13. Ballester OF, Abdallah JM, Prasad AS. Impaired IgM antibody responses to an influenza virus vaccine in adults with sickle cell anemia. Am J Hematol 1985; 20: 409–412. [DOI] [PubMed] [Google Scholar]
- 14. Bjornson AB, Lobel JS. Direct evidence that decreased serum opsonization of Streptococcus pneumoniae via the alternative complement pathway in sickle cell disease is related to antibody deficiency. J Clin Invest 1987; 79: 388–398. [DOI] [PMC free article] [PubMed] [Google Scholar]
- 15. Rautonen N, Martin NL, Rautonen J, Rooks Y, Mentzer WC, Wara DW. Low number of antibody producing cells in patients with sickle cell anemia. Immunol Lett 1992; 34: 207–211. [DOI] [PubMed] [Google Scholar]
- 16. Vingert B, Tamagne M, Habibi A et al. Phenotypic differences of CD4+ T cells in response to red blood cell immunization in transfused sickle cell disease patients. Eur J Immunol 2015; 45: 1868–1879. [DOI] [PubMed] [Google Scholar]
- 17. Nickel RS, Osunkwo I, Garrett A et al. Immune parameter analysis of children with sickle cell disease on hydroxycarbamide or chronic transfusion therapy. Br J Haematol 2015; 169: 574–583. [DOI] [PMC free article] [PubMed] [Google Scholar]
- 18. William BM, Corazza GR. a comprehensive review. Part I: basic concepts and causes. Hematology 2007; 12: 1–13. [DOI] [PubMed] [Google Scholar]
- 19. Nottage KA, Ware RE, Winter B et al. Predictors of splenic function preservation in children with sickle cell anemia treated with hydroxyurea. Eur J Haematol 2014; 93: 377–383. [DOI] [PubMed] [Google Scholar]
- 20. Likhite VV. Immunological impairment and susceptibility to infection after splenectomy. JAMA 1976; 236: 1376–1377. [PubMed] [Google Scholar]
- 21. Cameron PU, Jones P, Gorniak M et al. Splenectomy associated changes in IgM memory B cells in an adult spleen registry cohort. PLoS One 2011; 6: e23164. [DOI] [PMC free article] [PubMed] [Google Scholar]
- 22. Carsetti R, Pantosti A, Quinti I. Impairment of the antipolysaccharide response in splenectomized patients is due to the lack of immunoglobulin M memory B cells. J Infect Dis 2006; 193: 1189–1190. [DOI] [PubMed] [Google Scholar]
- 23. Klein U, Küppers R, Rajewsky K. Evidence for a large compartment of IgM‐expressing memory B cells in humans. Blood 1997; 89: 1288–1298. [PubMed] [Google Scholar]
- 24. Klein U, Rajewsky K, Küppers R. Human immunoglobulin (Ig)M+IgD+ peripheral blood B cells expressing the CD27 cell surface antigen carry somatically mutated variable region genes: CD27 as a general marker for somatically mutated (memory) B cells. J Exp Med 1998; 188: 1679–1689. [DOI] [PMC free article] [PubMed] [Google Scholar]
- 25. Weller S, Braun MC, Tan BK et al. Human blood IgM ‘memory’ B cells are circulating splenic marginal zone B cells harboring a prediversified immunoglobulin repertoire. Blood 2004; 104: 3647–3654. [DOI] [PMC free article] [PubMed] [Google Scholar]
- 26. Budeus B, Schweigle de Reynoso S, Przekopowitz M, Hoffmann D, Seifert M, Küppers R. Complexity of the human memory B‐cell compartment is determined by the versatility of clonal diversification in germinal centers. Proc Natl Acad Sci USA 2015; 112: E5281–E528. [DOI] [PMC free article] [PubMed] [Google Scholar]
- 27. Di Sabatino A, Carsetti R, Corazza GR. Review post‐splenectomy and hyposplenic states. Lancet 2011; 378: 86–97. [DOI] [PubMed] [Google Scholar]
- 28. Wasserstrom H, Bussel J, Lim LC et al. Memory B cells and pneumococcal antibody after splenectomy. J Immunol 2008; 181: 3684–3689. [DOI] [PMC free article] [PubMed] [Google Scholar]
- 29. Johnson FL, Look AT, Gockerman J, Ruggiero MR, Dalla‐Pozza L, Billings FT. Bone‐marrow transplantation in a patient with sickle‐cell anemia. N Engl J Med 1984; 311: 780–783. [DOI] [PubMed] [Google Scholar]
- 30. Gluckman E, Cappelli B, Bernaudin F et al. Sickle cell disease: an international survey of results of HLA‐identical sibling hematopoietic stem cell transplantation. Blood 2017; 129: 1548–1556. [DOI] [PMC free article] [PubMed] [Google Scholar]
- 31. Toubert A, Glauzy S, Douay C, Clave E. Thymus and immune reconstitution after allogeneic hematopoietic stem cell transplantation in humans: Never say never again. Tissue Antigens 2012; 79: 83–89. [DOI] [PubMed] [Google Scholar]
- 32. Gaballa A, Clave E, Uhlin M, Toubert A, Arruda LCM. Evaluating thymic function after human hematopoietic stem cell transplantation in the personalized medicine era. Front Immunol 2020; 11: 1341. [DOI] [PMC free article] [PubMed] [Google Scholar]
- 33. van Zelm MC, van der Burg M, van Dongen JJM. Homeostatic and maturation‐associated proliferation in the peripheral B‐cell compartment. Cell Cycle 2007; 6: 2890–2895. [DOI] [PubMed] [Google Scholar]
- 34. Glauzy S, Soret J, Fournier I, Douay C et al. Impact of acute and chronic graft‐versus‐host disease on human B‐cell generation and replication. Blood 2014; 124: 2459–2462. [DOI] [PubMed] [Google Scholar]
- 35. Catalán D, Mansilla MA, Ferrier A et al. Immunosuppressive mechanisms of regulatory B cells. Front Immunol 2021; 12: 611795. [DOI] [PMC free article] [PubMed] [Google Scholar]
- 36. Alhabbab RY, Nova‐Lamperti E, Aravena O et al. Regulatory B cells: Development, phenotypes, functions, and role in transplantation. Immunol Rev 2019; 292: 164–179. [DOI] [PubMed] [Google Scholar]
- 37. Dion ML, Poulin JF, Bordi R et al. HIV infection rapidly induces and maintains a substantial suppression of thymocyte proliferation. Immunity 2004; 21: 757–768. [DOI] [PubMed] [Google Scholar]
- 38. Arruda LCM, Malmegrim KCR, Lima‐Júnior JR et al. Immune rebound associates with a favorable clinical response to autologous HSCT in systemic sclerosis patients. Blood Adv 2018; 2: 126–141. [DOI] [PMC free article] [PubMed] [Google Scholar]
- 39. van Zelm MC, Szczepanski T, van der Burg M, van Dongen JJM. Replication history of B lymphocytes reveals homeostatic proliferation and extensive antigen‐induced B cell expansion. J Exp Med 2007; 204: 645–655. [DOI] [PMC free article] [PubMed] [Google Scholar]
- 40. Mauri C, Bosma A. Immune regulatory function of B cells. Annu Rev Immunol 2012; 30: 221–241. [DOI] [PubMed] [Google Scholar]
- 41. Lebien TW, Tedder TF. B lymphocytes: how they develop and function. Blood 2008; 112: 1570–1580. [DOI] [PMC free article] [PubMed] [Google Scholar]
- 42. Yanaba K, Bouaziz J‐D, Matsushita T, Tsubata T, Tedder TF. The development and function of regulatory B cells expressing IL‐10 (B10 Cells) requires antigen receptor diversity and TLR signals. J Immunol 2009; 182: 7459–7472. [DOI] [PMC free article] [PubMed] [Google Scholar]
- 43. Yoshizaki A, Miyagaki T, DiLillo DJ et al. Regulatory B cells control T‐cell autoimmunity through IL‐21‐dependent cognate interactions. Nature 2012; 491: 264–268. [DOI] [PMC free article] [PubMed] [Google Scholar]
- 44. Hasan MM, Thompson‐Snipes L, Klintmalm G et al. CD24hi CD38hi and CD24hi CD27+ human regulatory B cells display common and distinct functional characteristics. J Immunol 2019; 203: 2110–2120. [DOI] [PubMed] [Google Scholar]
- 45. Krishnamurti L. Hematopoietic cell transplantation for sickle cell disease. Front Pediatr 2021; 8: 551170. [DOI] [PMC free article] [PubMed] [Google Scholar]
- 46. Chaudhry MS, Velardi E, Malard F, van den Brink MRM. Immune reconstitution after allogeneic hematopoietic stem cell transplantation: time to T up the thymus. J Immunol 2017; 198: 40–46. [DOI] [PubMed] [Google Scholar]
- 47. Clave E, Busson M, Douay C et al. Acute graft‐versus‐host disease transiently impairs thymic output in young patients after allogeneic hematopoietic stem cell transplantation. Blood 2009; 113: 6477–6484. [DOI] [PubMed] [Google Scholar]
- 48. Ringhoffer S, Rojewski M, Döhner H, Bunjes D, Ringhoffer M. T‐cell reconstitution after allogeneic stem cell transplantation: assessment by measurement of the sjTREC/βTREC ratio and thymic naive T cells. Haematologica 2013; 98: 1600–1608. [DOI] [PMC free article] [PubMed] [Google Scholar]
- 49. Meyer EH, Hsu AR, Liliental J et al. A distinct evolution of the T‐cell repertoire categorizes treatment refractory gastrointestinal acute graft‐versus‐host disease. Blood 2013; 121: 4955–62. [DOI] [PMC free article] [PubMed] [Google Scholar]
- 50. Weinberg K, Blazar BR, Wagner JE et al. Factors affecting thymic function after allogeneic hematopoietic stem cell transplantation. Blood 2001; 97: 1458–1466. [DOI] [PubMed] [Google Scholar]
- 51. Giordano P, Cascioli S, Lassandro G et al. B‐cell hyperfunction in children with immune thrombocytopenic purpura persists after splenectomy. Pediatr Res 2016; 79: 262–270. [DOI] [PubMed] [Google Scholar]
- 52. Di Sabatino A, Rosado MM, Ciccocioppo R et al. Depletion of immunoglobulin M memory B cells is associated with splenic hypofunction in inflammatory bowel disease. Am Jour Gastroenterol 2005; 8: 1788–1795. [DOI] [PubMed] [Google Scholar]
- 53. Isgrò A, Marziali M, Sodani P et al. Immunohematologic reconstitution in pediatric patients after T cell‐depleted HLA‐haploidentical stem cell transplantation for thalassemia. Biol Blood Marrow Transplant 2010; 16: 1557–1566. [DOI] [PubMed] [Google Scholar]
- 54. Leonard A, Bonifacino A, Dominical VM et al. Bone marrow characterization in sickle cell disease: inflammation and stress erythropoiesis lead to suboptimal CD34 recovery. Br J Haematol 2019; 2: 286–299. [DOI] [PMC free article] [PubMed] [Google Scholar]
- 55. Glauzy S, Soret J, Fournier I et al. Impact of acute and chronic graft‐versus‐host disease on human B‐cell generation and replication. Blood 2014; 124: 2459–2462. [DOI] [PubMed] [Google Scholar]
- 56. Jacobson CA, Sun L, Kim HT et al. Post‐transplantation B cell activating factor and B cell recovery before onset of chronic graft‐versus‐host disease. Biol Blood Marrow Transplant 2014; 20: 668–675. [DOI] [PMC free article] [PubMed] [Google Scholar]
- 57. Hua C, Audo R, Yeremenko N et al. A proliferation inducing ligand (APRIL) promotes IL‐10 production and regulatory functions of human B cells. J Autoimmun 2016; 73: 64–72. [DOI] [PubMed] [Google Scholar]
- 58. Stein JV, López‐Fraga M, Elustondo FA et al. APRIL modulates B and T cell immunity. J Clin Invest 2002; 109: 1587–1598. [DOI] [PMC free article] [PubMed] [Google Scholar]
- 59. Fehres CM, van Uden NO, Yeremenko NG et al. April induces a novel subset of IgA+ regulatory B cells that suppress inflammation via expression of IL‐10 and PD‐L1. Front Immunol 2019; 10: 1368. [DOI] [PMC free article] [PubMed] [Google Scholar]
- 60. Marie‐Cardine A, Divay F, Dutot I, et al. Transitional B cells in humans: characterization and insight from B lymphocyte reconstitution after hematopoietic stem cell transplantation. Clin Immunol 2008; 127: 14–25. [DOI] [PubMed] [Google Scholar]
- 61. Ugozzoli L, Yam P, Petz L et al. Amplification by the polymerase chain reaction of hypervariable regions of the human genome for evaluation of chimerism after bone marrow transplantation. Blood 1991; 77: 1607–1615. [PubMed] [Google Scholar]
- 62. Glucksberg H, Storb R, Fefer A et al. Clinical manifestations of graft‐versus‐host disease in human recipients of marrow from HL‐A‐matched sibling donors. Transplantation 1974; 18: 295–304. [DOI] [PubMed] [Google Scholar]
- 63. Jagasia MH, Greinix HT, Arora M et al. National institutes of health consensus development project on criteria for clinical trials in chronic graft‐versus‐host disease: I. The 2014 diagnosis and staging working group report. Biol Blood Marrow Transplant 2015; 21: 389–401. [DOI] [PMC free article] [PubMed] [Google Scholar]
- 64. Schall R. Estimation in generalized linear models with random effects. Biometrika 1991; 78: 719. [Google Scholar]
- 65. Barbosa NG, Yamamoto AY, Duarte G et al. Cytomegalovirus shedding in seropositive pregnant women from a high‐seroprevalence population: the Brazilian cytomegalovirus hearing and maternal secondary infection study. Clin Infect Dis 2018; 67: 743–750. [DOI] [PMC free article] [PubMed] [Google Scholar]
Associated Data
This section collects any data citations, data availability statements, or supplementary materials included in this article.
Supplementary Materials
Supplementary figures 1–9
Supplementary tables 1‐4