

Abstract
Disruptions in frontoparietal networks supporting emotion regulation have been long implicated in maladaptive childhood aggression. However, the association of connectivity between large-scale functional networks with aggressive behavior has not been tested. The present study examined whether the functional organization of the connectome predicts severity of aggression in children. This cross-sectional study included a transdiagnostic sample of 100 children with aggressive behavior (27 females) and 29 healthy controls without aggression or psychiatric disorders (13 females). Severity of aggression was indexed by the total score on the parent-rated Reactive-Proactive Aggression Questionnaire. During fMRI, participants completed a face emotion perception task of fearful and calm faces. Connectome-based predictive modeling with internal cross-validation was conducted to identify brain networks that predicted aggression severity. The replication and generalizability of the aggression predictive model was then tested in an independent sample of children from the Adolescent Brain Cognitive Development (ABCD) study. Connectivity predictive of aggression was identified within and between networks implicated in cognitive control (medial frontal, frontoparietal), social functioning (default mode, salience), and emotion processing (subcortical, sensorimotor) (r=0.31, RMSE = 9.05, p=0.005). Out-of-sample replication (p<0.002) and generalization (p=0.007) of findings predicting aggression from the functional connectome was demonstrated in an independent sample of children from the ABCD study (n=1,791; n=1,701). Individual differences in large-scale functional networks contribute to variability in maladaptive aggression in children with psychiatric disorders. Linking these individual differences in the connectome to variation in behavioral phenotypes will advance identification of neural biomarkers of maladaptive childhood aggression to inform targeted treatments.
Keywords: Aggression, Brain networks, Connectome, Dorsolateral prefrontal cortex, Disruptive behavior disorders, Predictive modeling
Introduction
Maladaptive aggression is among the most common reasons for referral to mental health services and spans across childhood psychiatric disorders, most notably disruptive behavior disorders, mood disorders, and autism spectrum disorder1. The term “aggression” refers to a broad category of behaviors that can result in harm to self or others2, and in children with psychiatric disorders these behaviors have also been referred to as affective, reactive, or impulsive aggression3. Maladaptive aggression can also be viewed as the behavioral component of anger outbursts4, which includes developmentally and socially inappropriate verbal behaviors, such as yelling and verbal threats, and physical behaviors, such as pushing, hitting or kicking. Aggressive behavior is most commonly associated with diagnoses of oppositional defiant disorder (as a behavioral manifestation of losing one’s temper) and conduct disorder in which aggression constitutes one of the main categories of symptoms5, 6. However, aggressive behavior has long been recognized as a transdiagnostic dimension that can be present in children with different psychiatric disorders7, 8 and dissociated from other forms of externalizing behaviors9, 10. In this study, we consider maladaptive aggression as a transdiagnostic phenomenon that can be indexed both categorically as absent or present and dimensionally as a degree of severity of aggressive behaviors.
Neuroimaging studies have identified neural dysfunction in ventral and lateral prefrontal regulatory regions in children with aggressive behavior11, 12. However, the search for brain-based predictors has not yielded reliable neural biomarkers of childhood aggression that could inform treatment, such as by refining existing interventions, providing neural targets for treatments, and/or guiding assignment to interventions based on patterns of neural function13. Here, we use predictive modeling (machine learning) to examine patterns of brain-wide connectivity for predicting aggression in a transdiagnostic sample of children.
The emotion dysregulation model of aggression implicates disruptions in frontoparietal circuitry involved in the cognitive control of emotion14. Consistent with this view, meta-analytic studies12, 15 identified under-activity in the ventromedial and ventrolateral prefrontal cortices (vmPFC and vlPFC, respectively), dorsolateral prefrontal cortex (dlPFC), and temporal-parietal regions during implicit emotion processing16–19. Neuroimaging studies of emotional processing also link childhood aggression with disruptions in functional connectivity between the amygdala and ventral prefrontal regions16, 19–21. For instance, altered connectivity between the amygdala and ventral prefrontal cortex was reported during emotion perception tasks in children with aggressive behavior16, 19, 20. Recent functional MRI (fMRI) studies using emotional face perception tasks have also reported associations of irritability, an elevated propensity for anger and aggression, with reduced amygdala-vmPFC connectivity22 and reduced amygdala-dlPFC connectivity23 in children with aggressive behavior. In addition, we note that fMRI studies have consistently identified aberrant neural functioning within cognitive control circuitry implicated in emotion regulation and response inhibition12, 24–26, which can lead to aggressive behavior27, 28.
While a large body of neuroimaging work has elucidated key elements of the neural circuitry involved in aggression16, 19, 22, 23, it is poorly understood how functional interactions spanning multiple large-scale networks in the connectome (i.e., functional connectivity across the entire brain) are associated with aggressive behavior in children. Connectome modeling approaches, which leverage machine learning algorithms and include a cross-validation step29, 30, have been increasingly used to predict behavioral phenotypes from large-scale functional networks30–33. Thus, these data-driven approaches may hold promise in identifying disruptions in the functional interactions among specific networks in the human connectome that are associated with aggressive behavior, potentially facilitating the discovery of brain-behavior associations and biomarkers. However, no study has examined whether the functional organization of the brain is predictive of aggression in children. The current study is the first to use a connectome predictive modeling approach to identify neural markers of childhood aggression.
To examine the association between the functional connectome and aggression severity, we used task-based connectivity and a previously-validated implicit emotion processing task for the following reasons. First, functional connectivity derived from task-based data may be well suited for investigating transdiagnostic properties of aggression. For instance, relative to resting-state fMRI data, there is recent evidence to suggest that using task-based fMRI data may improve the prediction of individual cognitive traits and enhance the delineation of brain–behavior associations34–36. Second, given that our a priori hypotheses focused on disruptions in frontoparietal networks implicated in childhood aggression during emotion processing12, we used a similar face emotion task to engage brain states relevant to emotion generation and regulation because these cognitive processes have been implicated in aggressive behavior12, 14, 15.
Here, we employed a machine learning connectivity approach (also known as connectome-based predictive modeling, CPM)37, to identify brain networks predictive of aggression. CPM leverages whole-brain functional connectivity data (“connectomes”)32, 33 and enables cross-validation, which protects against overfitting13, 38. First, we applied CPM to fMRI data from an emotion processing task that was acquired in a well-characterized, transdiagnostic sample of 129 children with aggressive behavior and healthy control children without aggression. Connectome modeling29, 30 was used to identify brain-behavior associations between a continuous measure of aggression and functional connectivity between and within large-scale networks in a transdiagnostic sample of children. Based on previous work implicating abnormal prefrontal connectivity in aggression12, 15, 16, 20, we hypothesized that altered connectivity within and between ventral and lateral prefrontal networks would be most predictive of individual differences in the severity of aggressive behavior. Then, we tested the replication and generalizability of the identified large-scale functional networks of aggression in an independent sample of children from the Adolescent Brain Cognitive Development (ABCD) study. The smaller, transdiagnostic sample (N = 129) served as the discovery dataset because it is enriched for the variable of interest (i.e., aggressive behavior). The larger ABCD cohort served as a replication dataset because it includes a heterogeneous sample of youths that is ideal for testing the replication and generalizability of brain biomarkers. To test the replication and generalization of the connectome predictive model to an external or novel dataset, we selected the stop signal task (SST) and emotional n-back task (EN-back) from the ABCD study for the following reasons. Both SST and EN-back tasks are conceptually similar to the implicit emotion processing task used in the discovery sample and engage frontoparietal and fronto-amygdala circuitry implicated in aggressive behavior39–41. The SST and EN-back tasks also involve executive functioning/response inhibition and emotion regulation processes, respectively, that represent subdomains of cognitive control that are consistently associated with deficits in the neural correlates of aggressive behavior12, 24, 26. Thus, we reasoned that both SST and EN-back tasks are relevant to our a priori hypotheses related to impairment in cognitive control networks in children with aggression.
Materials and Methods
Participants
This study included 100 children with aggressive behavior (27 females) and 29 typically developing healthy controls (HC group; 13 females). All participants were aged 8 to 16 years. Sample characteristics are shown in Table 1. Children with aggressive behavior were recruited for a treatment study of cognitive-behavioral therapy for irritability/anger and aggression42. Cross-sectional, fMRI data was collected at baseline, prior to initiating the treatment. One of the inclusion criteria for the treatment study was a T-score of 65 or greater on the Aggressive Behavior Scale of the Child Behavior Checklist (CBCL)43, which is 1.5 standard deviations above the mean in the standardization sample and represents a cut-off for a clinically significant level of aggression. The Aggressive Behavior scale includes 16 items reflecting anger outbursts, verbal and physical aggression. HC participants were required to have no current or past history of psychiatric or neurological disorders and a CBCL Aggressive Behavior T-score below 55. Additional details regarding inclusion and exclusion criteria are provided in the Supplement. Consistent with an RDoC approach to investigating dimensions of psychopathology transdiagnostically, the sample included children with a range of psychiatric diagnoses (see Table 1). However, untreated PTSD and severe depression were exclusionary criteria because these disorders may present with pressing treatment needs, not targeted in the treatment study. Primary diagnosis reflected the chief symptoms for which youths sought treatment. All children also met criteria for Oppositional Defiant Disorder (ODD), Conduct Disorder, or Disruptive Mood Dysregulation Disorder (DMDD) based on a semi-structured diagnostic interview44. The sample included 18 subjects with ASD and high levels of aggression; ASD diagnosis was confirmed by the Autism Diagnostic Interview-Revised45 and Autism Diagnostic Observation Schedule-2nd edition46. Children were recruited from the outpatient child psychiatry clinic at the Yale University Child Study Center and from outreach to the local schools, pediatricians and mental health providers. Healthy control children were recruited from the community via advertisements. Each participant’s parent provided informed consent according to specifications by the institutional review board at the Yale University School of Medicine. Each child provided verbal and written assent. This study was reviewed and approved by the local ethical committee (institutional review board at the Yale University School of Medicine), and it was conducted in accordance with the declaration of Helsinki.
Table 1.
Participant Demographics and Clinical Characteristics
| Variable | Total Sample N=129 | Aggressive Behavior n = 100 | Healthy Controls n=29 | p valueb |
|---|---|---|---|---|
| Age, years (SD) | 11.9 (2.2) | 11.7 (2.3) | 12.8 (1.8) | 0.02c |
| Male, % | 69 | 73 | 55.2 | 0.07 |
| Mean IQa (SD) | 107.8 (13.8) | 106.4 (14.1) | 112.5 (12.3) | 0.04c |
| Race, % | 0.45 | |||
| White | 76 | 78 | 69 | |
| Black | 13.2 | 12 | 17.2 | |
| American Indian/Alaska native | 1.6 | 2 | 0 | |
| Asian/Pacific Islander | 1.6 | 2 | 0 | |
| Other/More than one race | 7.8 | 6 | 13.8 | |
| Ethnicity | 1 | |||
| Hispanic | 15.5 | 16 | 13.8 | |
| Non-Hispanic | 84.5 | 84 | 86.2 | |
| Mean CBCL aggressive behavior T score (SD) | 69.8 (12.2) | 75.3 (7.6) | 51 (2.7) | <0.001d |
| Mean CBCL internalizing behavior T score (SD) | 58.6 (13.1) | 63.3 (10.3) | 42.4 (7.3) | <0.001d |
| Mean SRS-2 SCI total T score (SD) | 60.7 (13.8) | 65.5 (11.3) | 44.1 (7.8) | <0.001d |
| RPQ Aggression Total (SD) | 15.7 (9.3) | 19.4 (6.9) | 2.8 (3.1) | |
| DSM-5 diagnosese, % | ||||
| Oppositional defiant disorder | 76 | |||
| Conduct disorder | 4 | |||
| DBD-NOS | 3 | |||
| DMDD | 18 | |||
| ASD | 18 | |||
| ADHD | 78 | |||
| Anxiety disorder | 26 | |||
| Depression disorder | 4 | |||
| Type of medication, % | ||||
| Stimulants | 31 | |||
| Antidepressant | 13 | |||
| Neuroleptics | 13 | |||
| Non-stimulants | 20 | |||
| Mood stabilizers | 4 | |||
| Benzodiazepines | 2 |
Note: Diagnoses of disruptive behavior disorders and comorbid disorders were made using the Schedule for Affective Disorders and Schizophrenia for School-Age Children-Present and Lifetime Version (K-SADS-PL). Following DSM-5, oppositional defiant disorder diagnosis was not assigned to children who met criteria for DMDD.
Abbreviations: ASD, autism spectrum disorder; ADHD, Attention-deficit/hyperactivity disorder; CBCL, Child Behavior Checklist; DMDD, Disruptive mood dysregulation disorder; HC, healthy controls; RPQ, Reactive-Proactive Anger Questionnaire; SRS-2 SCI, Social Responsiveness Scale-Second Edition Social Communication and Interaction.
Full-scale IQ measured by the Wechsler Abbreviated Scale of Intelligence51.
Significant group differences at p<0.05 using Chi-square test for categorical variables or independent samples T-test.
HC > Aggressive Behavior group
Aggressive Behavior group > HC
Following DSM-5, oppositional defiant disorder diagnosis was not assigned to children who met criteria for DMDD.
Measures
The Reactive-Proactive Aggression Questionnaire (RPQ) total score47 was used as the primary continuous measure of severity of aggressive behavior in CPM analyses. The RPQ is a 23-item parent-report scale that measures proactive and reactive aggression on a 3-point Likert scale. The RPQ Aggression Total score was used because it reflects the overall severity of maladaptive aggressive behavior in pediatric populations1, 48–50.
Children received a comprehensive diagnostic evaluation that included the Schedule for Affective Disorders and Schizophrenia for School-Age Children-Present and Lifetime Version (K-SADS-PL)44 that was conducted with the parent and child by an expert clinician to establish DSM-5 diagnoses of Disruptive Behavior Disorders and co-occurring psychopathology. Full scale IQ was evaluated with the Wechsler Abbreviated Scale of Intelligence (WASI)51. The CBCL Internalizing Behavior Problem score was used as a continuous measure of internalizing symptoms. The parent-rated Social Responsiveness Scale-Second Edition (SRS-2) Social Communication and Interaction subscale score (SCI; 53 items)52 was used as a dimensional measure of severity of social impairments. The SRS-2 SCI subscale represents four dimensions of social behaviors including social awareness, motivation, communication, and cognition. The SRS was initially developed as a measure of social impairment in ASD, but was shown to capture social cognitive impairments in the general population as well as in children with aggressive behavior53. Thus, we reasoned that the SRS-2 SCI subscale would provide an approximation of impairments in social functioning related to maladaptive aggression in children54–56. Additional detail related to study measures is provided in the Supplement.
Task
Participants completed a previously-validated fMRI task of emotionally expressive faces from the NimStim Face Stimulus Set57. Task details are also reported elsewhere58. The task uses a pseudorandomized block design with 12 blocks that each contain two randomly selected faces exhibiting the same expression: 6 calm emotion and 6 fearful emotion blocks. The face-expression pair images are randomly selected throughout the blocks and no individual face-expression image is displayed more than once throughout the paradigm (Figure S1). Each block was 12 seconds in length and consisted of two faces displayed for 5.5 seconds each that were separated by a 1 second intertrial fixation cross. Blocks were separated by a jittered interblock interval between 8 and 12 seconds to optimize statistical efficiency. The interblock intervals were pseudorandomized such that the mean of all interblock intervals was 10 seconds. The first block was preceded by a 10 second initial fixation cross and the final block was succeeded by an identical 10 second fixation cross. The total duration of the paradigm was 4.7 minutes. Participants were instructed to perform a gender identification task using a button press in their left or right hand to indicate male or female, respectively. We examined connectivity across both emotions (fearful and calm) to understand broader deficits in implicit emotion face processing associated with aggressive behavior and to ensure sufficient continuous voxel timecourse for CPM analyses. Prior to the fMRI session, a mock scanner was used to acclimate participants to the scanning environment (see Supplement). See Table S1 for fMRI task behavioral performance. During the mock scanner, children were taught to minimize head motion using motion tracker software (Polhemus FASTRAK head motion sensor) that provided real-time movement feedback to participants.
Data Acquisition and Preprocessing
Functional MRI data was collected using a Siemens MAGNETOM Tim Trio 3 Tesla scanner. Standard preprocessing and functional imaging statistical analyses were conducted (FSL Version 4.1.6)59, 60. More detail regarding data acquisition and preprocessing is provided in the Supplement. Motion was corrected using FSL MCFLIRT linear realignment tool61. Of 106 potential scans in the aggressive behavior group and 30 in the healthy control group, 6 children with aggressive behavior and one healthy control child were excluded from the final analysis owing to excessive motion and computer error during the scan, respectively. Thus, 129 scans were included in the final analysis (100 in the aggressive behavior group and 29 in the healthy control group). Several covariates of no interest were also regressed out from the data including the 12 motion parameters (six rigid body motion parameters and six temporal derivatives), mean white matter signal, mean cerebrospinal fluid signal, mean global signal, and the linear, quadratic, and cubic drifts. Global signal regression was performed as it strengthens the association between functional connectivity and behavior, leading to better performing and generalizing predictive models. No between-group differences were observed in mean head motion detected during the functional scan (Table S2). There were also no significant correlations between RPQ aggression severity and motion (r=0.07, p=0.45) or CBCL aggression severity and motion (r=0.02, p=0.81).
Connectivity Matrices
Whole-brain functional connectivity analyses were conducted using BioImage Suite and previously described methods30, 35. Network nodes were defined using the Shen 268-node brain atlas, which includes the cortex, subcortex, and cerebellum as described in prior work37, 62. The atlas was warped from MNI space into single-subject space. Task connectivity was calculated on the basis of the “raw” task time courses, with no regression of task-evoked activity, which emphasizes individual differences in connectivity32, 33. This approach is consistent with that used in prior CPM work33, 63–65 and approximates a continuous performance task63. This involved computation of the mean time courses for each of the 268 nodes (i.e., averaging the time courses of all constituent voxels). Node-by-node pairwise correlations were computed, and Pearson correlation coefficients were Fisher z-transformed to yield symmetric 268×268 connectivity matrices, in which each element of the matrix represents the connectivity strength between two individual nodes (i.e., “edge”).
Connectome-Based Predictive Modeling (CPM)
CPM was conducted to predict RPQ scores using published MATLAB scripts37. A schematic diagram is shown in Figure S2. CPM uses connectivity matrices and behavioral data (here, aggressive behavior severity) from individuals as input to generate a predictive model of the behavioral data from connectivity matrices. Edges and behavioral data from the training data set are correlated using regression analyses (here, Pearson’s correlation or—when controlling for other behavioral variables or covariates—partial correlation) to identify positive and negative predictive networks. Positive networks are networks for which increased edge weights (increased connectivity) are associated with the variable of interest, and negative networks are those for which decreased edge weights (decreased connectivity) are associated with the variable of interest. Single-subject summary statistics are then created as the sum of the significant edge weights in each network, entered into predictive models assuming linear relationships with behavioral data. The identified predictive networks and summary score model from the training data are then applied to the test data set to predict behavior.
Leave-one-out cross-validation was then conducted to test if aggression severity can be predicted based on the connectivity profile of a previously unseen individual. In the case of leave-one-out cross-validation used here, a single subject’s predicted value (i.e., the “left-out” participant) is created by using the data from all other participants (i.e., N-1) as the training dataset. That is, data from one subject is set aside as the test set, and data from the remaining N−1 subjects is used as the training set in an iterative manner until all subjects have a predicted value. Each iteration consisted of the following: (i) feature selection, in which edges with a significant relationship to aggression severity are identified in the training set and separated into two tails based on sign (positive or negative); (ii) model building, in which training data are used to fit linear regressions between aggression and connectivity strength in the positive- and negative-feature networks, respectively; and (iii) prediction, in which data from the excluded subject are input into every model to generate a predicted aggression score. Following all iterations, CPM model performance was then evaluated by correlating predicted and observed aggression values as described in Significance of CPM Performance.
Localization of Predictive Networks
Predictive networks were summarized at multiple levels of data reduction including at the edge, node, network level30. Overlap of nodes with macroscale brain regions (e.g., prefrontal cortex, cerebellum) were based on anatomical labels presented in Finn et al.31. Overlap of nodes with canonical functional network localizations (e.g., frontoparietal, sensorimotor) were based on the functional networks presented in Nobel et al.66 Additionally, for each node, the network theory measure degree was calculated as the sum of the number of edges for each node that belonged to the predictive networks. Additional details are also provided in the Supplemental Methods. Visualizations of predictive edges were created using BioImage Suite Web (https://bioimagesuiteweb.github.io/alphaapp/index.html). High degree nodes were operationalized as the top x% (top n) of nodes based on the largest number of edges or connections in all of the iterations of the predictive model. Here, we used the top 10% (27 out of 268) of predictive nodes provided by the BioImage Suite Web software.
Significance of CPM Performance
For connectome analyses, the correspondence between predicted and actual values, or model performance, was assessed using Pearson’s correlation (r) and root mean square error defined as: . Negative correlations were set to zero. When using cross-validation, analyses in the left-out folds are not independent, and the number of degrees of freedom is thus overestimated for parametric p values. Therefore, permutation testing was performed. To generate null distributions for significance testing, we randomly shuffled the correspondence between behavioral variables and connectivity matrices by permuting subject assignments for behavioral variables 1,000 times and re-ran the CPM analysis with the shuffled data. Based on these null distributions, the p-values for predictions were calculated32. As we hypothesize a positive association between predicted and actual values, one-tailed p-values are reported.
Follow-up analyses
Additional analyses were conducted to test the robustness of highly predictive nodes to potential confounds (see Supplemental Methods). First, a virtual lesion analysis was used to test model performance after ‘lesioning’ or restricting CPM to high-degree nodes and their corresponding edges identified in the main model. Next, to test construct specificity of high-degree nodes in predicting aggression, we conducted post-hoc tests retaining the high-degree nodes and all edges connected to these nodes (i.e., removing all other edges), to evaluate the robustness of these networks in predicting aggression in subgroups with high severity of co-occurring behaviors (internalizing symptoms, ADHD symptoms, and social impairments). A cut-off T score of >65 was used on standardized continuous measures (CBCL Internalizing Behaviors and CBCL Attention Problems scores, SRS-2 SCI total) to form subgroups because this represents the cut-off for a clinically significant level of psychopathology.
External Replication and Validation
We tested the replication of findings and generalizability of the aggregate model from the transdiagnostic discovery dataset (i.e., edges present in >95% of cross-validation folds) in predicting aggressive behavior in an independent, open-access sample of youths from the Adolescent Brain Cognitive Development (ABCD) study39. We applied the CPM aggression network models to a sample from the ABCD study of task-based fMRI from 1,701 children (920 females) using the stop signal task (SST) and from 1,791 children (958 females) using the emotional n-back task (EN-back) (age range 9–10 years). Table S3 shows characterization data for ABCD participants included in the CPM analysis. We selected these tasks for replication and validation purposes for the following reasons. First, the SST and EN-back tasks tap frontoparietal and fronto-amygdala circuitry that are relevant to aggressive behavior39–41. Second, similar to our study, the EN-back task stimuli included a set of happy, fearful, and neutral expressions drawn in part from the NimStim Stimulus Set57. Additionally, the SST taps the construct of response inhibition40 that is also implicated in child aggressive behavior24. ABCD data was processed in a similar manner to the main dataset and is described in our previous work67. CPM was conducted as above with leave-one-out cross-validation. We computed Spearman’s correlations (rs) between predicted and observed CBCL aggressive behavior scores based on connectivity matrices. Spearman’s correlations were used for ABCD to address the comparability in connectome prediction using different but related aggression measures between the discovery and replication/external datasets. We first tested the replication of findings and whether the functional organization of the connectome predicts aggressive behavior in ABCD. We then tested the generalizability of predictive models from the transdiagnostic, discovery dataset (N=129) to ABCD and vice versa.
Data and Code Availability
To promote data transparency, anonymized data that support the findings of this study are available from the corresponding authors upon reasonable request. Data from the studies reported in this paper (transdiagnostic sample from Yale and ABCD) have also been shared on the National Institute of Mental Health Data Archive (NDA) https://nda.nih.gov/. CPM code is available at: https://github.com/YaleMRRC/CPM.
Results
Prediction of Aggression
The overall CPM model revealed that patterns of brain-wide connectivity predicted severity of aggressive behavior (combined positive and negative networks: r=0.31, RMSE = 9.05, p=0.005 via permutation testing) (Figure 1). We then conducted follow-up comparisons to evaluate the effect of potential covariates on the CPM model predicting aggression. The models controlling for potential covariates also predicted severity of aggressive behavior and demonstrated similar prediction performances when controlling for age (r=0.25, RMSE = 9.31, p=0.03), IQ (r=0.28, RMSE = 9.17, p=0.013), sex (r=0.27, RMSE = 9.19, p=0.016), motion (r=0.32, RMSE = 9.01, p=0.006), and psychiatric medication (r=0.31, RMSE = 9.03, p=0.005). The main CPM model predicting aggressive behavior remained significant with similar prediction results after accounting for the potential impact of co-occurring internalizing symptoms (r=0.27, RMSE = 9.13, p=0.01). Similar model performance was also observed after accounting for ADHD diagnosis (r=0.22, RMSE = 9.30, p=0.05). The CPM model also remained significant after accounting for core ASD symptoms based on diagnosis (ASD vs. non-ASD) (r=0.28, RMSE = 9.16, p=0.01) as well as severity of ASD social behavior impairments (SRS-2 SCI total score as a continuous measure) (r=0.25, RMSE = 9.14, p=0.02). Analyses were also repeated using 10-fold cross-validation and similar results were observed although, as expected with 10-fold versus leave-one-out cross-validation, the correlation coefficient was smaller (r=0.24, RMSE=9.30, p= 0.01).
Figure 1.
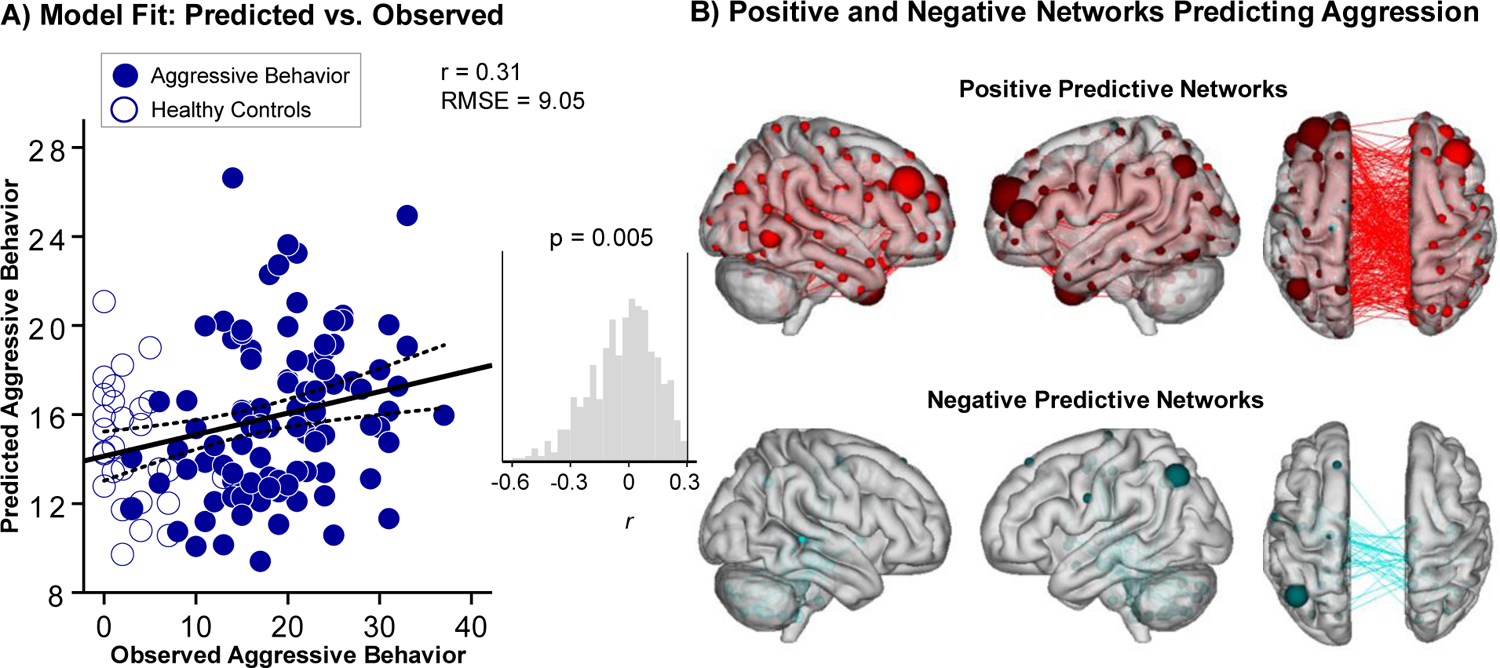
Brain-wide functional connectivity predicts severity of aggressive behavior. (A) Panel A illustrates the correspondence between observed (x-axis) and predicted (y-axis) severity of aggressive behavior generated using CPM. The Reactive-Proactive Aggression Questionnaire (RPQ) was used as a continuous measure of severity of aggressive behavior. Despite the clinical complexity of the population, CPM successfully predicted aggression (p=0.005, permutation testing). Predictions remained significant in follow-up analyses controlling for covariates including age, IQ, sex, medication use as well as co-occurring ADHD and internalizing symptoms. Histogram shows distribution of Pearson correlation (r) values from 1000 iterations of randomly-shuffled ratings of aggression severity used to nonparametrically determine P values. (B) Panel B shows positive (red) and negative (blue) networks predicting aggression. For positive networks, increased edge weights (i.e., increased functional connectivity) predict greater severity of aggression. For negative networks, decreased edge weights (i.e., decreased functional connectivity) predict greater severity of aggression. Larger spheres indicate nodes with more edges, and smaller spheres indicate fewer edges. Note: RMSE = Root Mean Square Error.
Network Anatomy and Localization of Circuits
Figure 2 summarizes aggression networks. Highest-degree nodes (i.e., nodes with the most connections) for the positive network included a bilateral dlPFC node with connections to limbic, temporal-parietal, sensorimotor, and other prefrontal nodes (Figure 2A–B). Additional prefrontal nodes for the positive network included the bilateral vmPFC, right vlPFC, and bilateral temporal poles. Highest-degree nodes for the negative network included a temporal-parietal node in the supramarginal gyrus. At the network level, Figure 2C summarizes connectivity within and between large-scale neural networks. Overall, between-network connectivity was characterized by connections between frontoparietal and salience networks, which contributed the majority of edges to the positive network, and between the medial frontal, default mode, sensorimotor, subcortical, and salience networks (additional details are provided in the Supplemental Results). We also conducted post hoc analyses splitting the RPQ into its two dimensions (see Supplemental Results and Figure S3) and observed a highly correlated pattern of network connectivity for reactive and proactive aggression (r=0.56, p=1.3E-23, 85 overlapping edges) with a very similar pattern of high degree nodes emerging in dlPFC for both dimensions.
Figure 2.

Networks predicting aggression summarized by connectivity between macroscale brain regions and networks. (A) From the top, brain regions are presented in approximate anatomical order whereby longer-range connections are represented by longer lines. To visualize these complex networks and clarify edges that contributed the most to the CPM model, edges belonging to nodes with five or more edges (degree ≥5; left), 20 or more edges (degree ≥20; middle), and 40 or more edges (degree ≥40; right) are shown. (B) Visualization of node degree (i.e., the sum of predictive edges for a node) for the positive (left), negative networks (middle), and all networks (right). Darker colors indicate higher degree nodes (i.e., with more edges) contributing to CPM model. Several lateral and ventral prefrontal nodes emerged as high degree positive predictive nodes including bilateral dorsolateral prefrontal cortex (dlPFC), ventrolateral and ventromedial PFC (vlPFC and vmPFC, respectively). A negative predictive node emerged in the supramarginal gyrus (SMG) as well as sensorimotor regions. (C) Within- and between-network connectivity for the positive network (left), negative network (middle), and combined networks (right) are summarized using canonical networks. Cells represent the total number of edges connecting nodes within and between each network, with darker colors indicating a greater number of edges. By definition, positive and negative networks do not contain overlapping edges.
Sensitivity Analyses
Virtual Lesioning Analysis.
First, we retained only high-degree nodes and all edges connected to these nodes, performing CPM using only these edges. The CPM predictive model remained significant even when restricted to each of the following high-degree nodes and related edges: bilateral dlPFC (r=0.27, RMSE=9.0 p=0.002), bilateral temporal pole (r=0.22, RMSE=9.18, p=0.01), right vlPFC (r=0.21, RMSE=9.20, p=0.02), bilateral parietal cortex (r=0.23, RMSE=9.12, p=0.009), bilateral occipital cortex (r=0.24, RMSE=9.08, p=0.006), and the right cerebellum (r=0.25, RMSE=9.03, p=0.004) (Figure 3). Next, to check model robustness, we systematically removed or ‘lesioned’ each of the high-degree nodes (i.e., retaining all other edges). We found that the model predicting aggression remained significant across each of the high-degree nodes for the bilateral dlPFC (r=0.21, RMSE=9.18, p=0.03), bilateral temporal pole (r=0.30, RMSE= 9.06, p=0.0005), right vlPFC (r=0.30, RMSE= 9.05, p=0.0004), bilateral parietal cortex (r=0.29, RMSE= 9.12, p=0.0009), bilateral occipital cortex (r=0.29, RMSE= 9.07, p=0.0006), and the right cerebellum (r=0.28, RMSE= 9.12, p=0.0009).
Figure 3.

Follow up analyses for high-degree nodes contributing to the connectome model in the discovery sample of 129 children. Follow up analyses tested the sensitivity of high-degree nodes (i.e., most predictive features) in predicting aggressive behavior. Regions emerging as highly predictive of aggression in the connectome model include the bilateral dorsolateral prefrontal cortex (dlPFC), right ventrolateral PFC (vlPFC), bilateral temporal pole, bilateral parietal cortex, bilateral occipital cortex, and right cerebellum. See Table S3 for MNI coordinates of high-degree nodes. Post-hoc tests retained the high-degree nodes and all edges connected to these nodes, while removing all other edges. For illustrative purposes, scatter plots depict the strength of node connectivity plotted on the y-axis and severity of aggressive behavior (Reactive-Proactive Aggression Questionnaire total) on the x-axis.
Construct Specificity.
We then evaluated the specificity and robustness of high degree nodes (i.e., removing all other edges) in predicting aggression in subgroups with high severity of co-occurring behaviors (internalizing symptoms, ADHD symptoms, and social impairments). The CPM model predicting aggression from dlPFC and its associated nodes remained significant despite co-occurring symptoms in subgroups with high severity of internalizing (r=0.38, RMSE = 6.46, p=0.005), ADHD (r=0.27, RMSE = 6.54, p=0.03), and social impairments (r=0.26, RMSE = 6.76, p=0.05) (Figure 4A–C). Other high-degree nodes did not demonstrate similar performance as the dlPFC across each of the subgroups (all other Ps > 0.06) and are therefore less robust and not further discussed. However, for the interested reader, we present these findings for other high-degree nodes in Table S4.
Figure 4.

Dorsolateral prefrontal cortex connectivity predicts aggressive behavior. Two nodes in the bilateral dorsolateral prefrontal cortex (dlPFC) emerged as the highest degree nodes (i.e., most predictive) in the CPM model predicting aggression (MNI coordinates: left dlPFC, x=−28, y=50, z=21; right dlPFC, x=37, y=35, z=31). Larger spheres indicate nodes with more edges, and smaller spheres indicate fewer edges. (A-C) Follow up analyses tested the sensitivity of these dlPFC networks in predicting aggressive behavior despite commonly co-occurring behaviors with aggression. From the total sample, subgroups were formed to test the robustness of the dlPFC networks in predicting aggression based on cutpoints using a T score >65, which represents a clinical threshold on standardized measures (CBCL, SRS-2 SCI): (A) high severity of internalizing symptoms (n=51); (B) high severity of ADHD symptoms (n=60); and (C) high severity of social behavior impairments (n=53). Post-hoc tests retained the bilateral dlPFC nodes and all edges connected to these nodes, while removing all other edges. For illustrative purposes, scatter plots depict the strength of dlPFC connectivity plotted on the y-axis and severity of aggressive behavior (Reactive-Proactive Aggression Questionnaire total) on the x-axis.
To further assess construct specificity of the dlPFC nodes, we then tested whether the CPM model predicted internalizing and ADHD in the total sample (N=129). Even when dlPFC network connectivity predicted aggression (Figure 4), it did not predict internalizing behaviors (r=−0.015, RMSE=9.94, p=0.86) or ADHD (r=−0.29, RMSE=5.42, p=1), or social behavior impairments (r=−0.48, RMSE=27.1, p=1)—note that because we hypothesize a positive association between predicted and actual aggression values (i.e., one tailed), negative correlations indicate CPM model failure. As a check on our main findings for model specificity to aggression, we also conducted a follow up post hoc analysis to test whether the CPM model predicts broader externalizing behaviors after accounting for the shared covariance with aggressive behavior. The CPM model did not predict externalizing behavior (indexed by the CBCL Externalizing Behavior scale) when restricted to the dlPFC nodes (r=−1, RMSE=12.23, p=1) or when tested across all 268 nodes (r=0.04, RMSE=12.78, p=0.5).
External Replication and Validation: Aggression Prediction
Out-of-Sample Replication.
We then tested the replication of findings from the transdiagnostic sample in an independent sample of children from the ABCD study39. For both ABCD tasks (EN-back, SST), the CPM model predicted aggressive behavior in the independent sample (EN-back: rs=0.10, RMSE=3.98, p<0.001; SST: rs=0.07, RMSE=4.01, p=0.002) (Figure 5A). Follow-up comparisons were also conducted that controlled for potential covariates including age, IQ, sex, ADHD and internalizing symptoms. For the SST task, the models controlling for potential covariates predicted severity of aggressive behavior and demonstrated similar prediction performances when controlling for age (rs=0.10, RMSE = 3.98, p=5.17E-5), IQ (rs=0.10, RMSE = 3.98, p=5.92E-6), and sex (rs=0.11, RMSE = 3.97, p=5.18E-6). The CPM model predicting aggressive behavior from the SST task remained significant with similar prediction results after accounting for the potential impact of co-occurring internalizing symptoms (rs=0.07, RMSE = 3.91, p=0.003) and ADHD diagnosis (rs=0.07, RMSE = 4.1, p=0.01). For the EN-back task, the models controlling for potential covariates also predicted severity of aggressive behavior with similar prediction performances when controlling for age (rs=0.10, RMSE = 3.98, p= 0.0004), IQ (rs=0.11, RMSE = 3.98, p=4.48E-5), and sex (rs=0.10, RMSE = 3.99, p=1.22E-5). The CPM model predicting aggressive behavior from the EN-back task also remained significant after accounting for the potential impact of co-occurring internalizing symptoms (rs=0.11, RMSE = 3.99, p=2.91E-6) and ADHD diagnosis (rs=0.09, RMSE = 3.99, p=5.23E-5).
Figure 5.

Replication of findings using CPM prediction of aggression in an out-of-sample dataset. (A-E) Using the Adolescent Brain Cognitive Development (ABCD) study dataset, we trained and tested a separate CPM model predicting aggressive behavior from 1701 children (920 females) using the stop signal task (SST) and from 1791 children (958 females) using the emotional n-back task (EN-back) (age range 9–10 years). We selected these tasks for replication and external validation because the SST and EN-back tasks tap frontoparietal and fronto-amygdala circuitry relevant to aggressive behavior39–41, 106 and related constructs of emotion processing and response inhibition that are implicated in disruptive behavior disorders in children. ABCD data was processed in a similar manner to the main dataset67. (A) Panel A illustrates the correspondence between observed (x-axis) and predicted (y-axis) severity of aggressive behavior generated using CPM for the SST and EN-back tasks. The CBCL aggressive behavior total score was used as a continuous measure of aggression. (B) Brain regions are presented in approximate anatomical order whereby longer-range connections are represented by longer lines. To visualize these complex networks and clarify edges that contributed the most to the CPM model, edges belonging to nodes with five or more edges (degree ≥5; left), 10 or more edges (degree ≥10; middle), and 20 or more edges (degree ≥20; right) are shown. Warmer colors indicate positive networks and cooler colors indicate negative networks. (C) Several prefrontal regions emerged as high degree predictive nodes, particularly in the lateral orbitofrontal PFC (OFC) (for the EN-back task: bilateral dlPFC, right temporal pole, right frontal eye fields, right vmPFC; for the SST task: bilateral dlPFC, left temporal pole, bilateral supramarginal gyrus, right vmPFC). Larger spheres indicate nodes with more edges, and smaller spheres indicate fewer edges. (D) Visualization of node degree (i.e., the sum of predictive edges for a node) for the positive versus negative networks. Darker colors indicate higher positive degree nodes (i.e., with more edges) contributing to CPM model. (E) Within- and between-network connectivity for the positive network (left), negative network (middle), and combined networks (right) are summarized using canonical networks for the SST and EN-back tasks. Cells represent the total number of edges connecting nodes within and between each network. Here, darker colors indicate a greater number of edges. Positive and negative networks do not contain overlapping edges. Note: RMSE = Root Mean Square Error.
Similar to the CPM model predicting aggression in the discovery sample (Figure 1), highly predictive features/nodes were observed in ventral and lateral prefrontal regions including the dlPFC as well as temporal-parietal regions (Figure 5B–D). At the network level, Figure 5E summarizes connectivity within and between large-scale neural networks for the SST and EN-back tasks, which demonstrated similar patterns as the discovery sample, including connections between medial frontal, frontoparietal, sensorimotor, default mode, and salience networks.
Out-of-Sample Validation.
We also assessed the generalizability of findings by testing the ability of the identified networks in the transdiagnostic, discovery sample (Figure 1) to predict aggressive behavior in the independent sample from the ABCD study and vice versa. First, we found that aggression network strength in the transdiagnostic sample predicted aggression severity in the independent sample (ABCD) for the EN-back (rs=0.06, p=0.007), but not the SST (rs=−0.002, p=0.9) (see Supplemental Results Table S5). Next, we tested the generalization of the aggression model developed in the independent dataset (ABCD study) to the discovery sample. We found that models developed using the EN-back and SST tasks both generalized to the discovery sample (EN-back: rs=0.18, p=0.03; SST: rs=0.24, p=0.005).
Discussion
This study is the first to apply a connectome-based predictive modeling approach to identify the functional connectomics underlying aggression in children. Two key findings from this study clarify associations between brain-wide functional connectivity and aggression in children. First, during implicit emotion processing of faces, brain-wide connectivity predicted severity of aggressive behavior. Specifically, dlPFC nodes emerged as highly predictive in the connectome models and were robust in sensitivity analyses. On a network level, connections within and between networks implicated in cognitive control (medial frontal, frontoparietal), social functioning (default mode, salience), and emotion generation/reactivity (subcortical, sensorimotor) emerged as significant predictors of aggression. Second, we further demonstrated that the same networks can be used to predict aggression in an independent, heterogeneous sample using similar tasks that tap into cognitive control processes of response inhibition and working memory, often impaired in children with aggressive behavior. These results are also aligned with prior CPM studies using task-based connectivity to predict behavior. For instance, task-based connectivity based on a frustration inducing cognitive flexibility task predicted irritability in youths68. Overall, our findings support the importance of examining the functional connectome during a phenotype-relevant brain state—in this case, emotion generation and regulation—to enhance individual differences to reveal patterns of brain activity predictive of aggression, which may facilitate the mapping from individual brains to behaviors and is a crucial step in developing brain-based biomarkers with real-world clinical utility69, 70.
The central role of the dlPFC in predicting aggression was consistent for models trained/tested in the discovery transdiagnostic sample of children and in the external validation dataset. These findings are consistent with prior work reporting disruptions in dlPFC connectivity in children with aggression and irritability during tasks of emotion regulation23, 71 and implicit emotion processing12, 16, 19, 20, spanning frontoparietal and fronto-amygdala circuitry. The dorsal and ventral prefrontal cortex connects to parietal and limbic regions, such as the amygdala, forming a frontoparietal and frontolimbic network tightly coupled with cognitive control systems involved in emotion regulation and executive functioning72. Therefore, projections between the dorsal and ventral prefrontal cortex and limbic regions are critical in dampening the acquisition and expression of negatively valenced emotions73, 74. Here, perturbed dlPFC connectivity during the processing of emotionally expressive faces could suggest disruptions in the modulation of emotion generation/reactivity systems in response to salient socioemotional stimuli associated with aggression in children.
It is important to note that the dlPFC nodes emerged as high-degree features—that is, the highest-ranking nodes that consistently contributed to models predicting aggression in all of the iterations—and remained robust predictors despite co-occurring symptoms of internalizing, ADHD and social impairments. While the dlPFC nodes alone predicted aggression severity in all of the follow up analyses, other nodes located in the salience, limbic, and sensorimotor networks are noteworthy and showed predictive ability when the dlPFC nodes were left out. Although some studies showed distinct behavioral1, 55 and neural75, 76 correlates of reactive and proactive forms of aggression, our results showed a similar pattern of network connectivity for reactive and proactive aggression (see Figure S3), suggesting that dlPFC connectivity is a neural feature of maladaptive aggression regardless of subtype. Given that the dlPFC was observed as the highest-ranking feature, it is possible that disruption to the dlPFC—a central hub of the emotion regulation circuitry with reciprocal connections to temporal-parietal and other cortical regions73, 74—may progress from local or modular disruptions before fanning out to other network hubs that are globally connected to frontoparietal networks involved in emotion regulation77. Thus, the involvement of other seemingly disparate networks in predicting aggression could indicate compensatory effects (e.g., over-connectivity) in which other functionally connected nodes take over the role of perturbed nodes (i.e., dlPFC) to maintain an optimal level of overall function. This interpretation aligns with the ‘cascading network failure’ theory, which states that initial, local changes to the connectome are cascaded across the networks78, 79. Therefore, the diverse interconnectedness of the dlPFC may make this highly connected region a potential ‘vulnerability hot spot’ for disruptions in the functional connectome associated with aggression.
Several large-scale networks emerged in the CPM models of aggression including the salience and default mode networks—two neural circuits associated with attentional and social cognitive processes80–83 that share reciprocal functional connections84. Our findings are consistent with prior work implicating associations between disruptive behavior and aberrant connectivity and activity in salience19, 75, 85 and default mode75, 86–88 networks in children. For instance, reduced activation in social brain circuitry is associated with conduct problems in youths relative to controls during social cognitive tasks12, 89, 90. Behavioral studies also show that impairments in social behavior, including emotion recognition and higher-order social cognitive processes, such as theory of mind and empathy, are associated with childhood aggressive behavior91, 92. Given the overlap of neural networks supporting social cognitive and emotion regulation processes93, disruptions in salience, default mode, and frontoparietal networks in children with aggression suggest impairment in the ability to detect salient social cues or inhibit inappropriate social responses, leading to aggressive responding. Thus, the salience and default mode networks and their component subsystems represent plausible substrates for deficits in emotion perception94, empathy95, and moral reasoning96 that have been observed in children with disruptive behavior disorders.
Multiple large-scale networks were involved in predicting aggression, emphasizing the complexity of the functional connectome in predicting behavioral phenotypes32, 33, 62. Figure 6 shows a theoretical network model of maladaptive aggression, integrating the network-level connections we observed. Based on these findings, we propose that aggression is predicted by: 1) disruptions in coordination between a cognitive control network system implicated in emotion regulation and executive functioning involving hyper-connectivity between frontoparietal and medial prefrontal networks; 2) disruptions in the integration of an emotion generation/reactivity network involving hyper-connectivity between subcortical and sensorimotor networks; and 3) disruptions in coordination between a social functioning system involving hyper-connectivity between the salience and default mode networks, and integration of a social functioning system with cognitive control and emotion generation networks. The current model builds on previous triadic model accounts of aggression by suggesting disruptions in limbic circuitry in response to emotional stimuli coupled with disruptions in prefrontal regulatory circuitry and dysconnectivity between these systems24. However, the current model also incorporates sensorimotor and salience networks to provide a theoretical framework for future research.
Figure 6.

Network model of aggression. Large-scale patterns of between-network connectivity in aggression networks identified using connectome-based predictive modeling are summarized based on relative number of connections within networks. Disrupted connectivity (i.e., network coordination) between frontoparietal and medial-frontal networks (top), between salience and default mode (DMN) networks (middle), and between sensorimotor and subcortical networks (bottom) positively predicted severity of aggressive behavior in children. Disrupted long-range connectivity (i.e., network integration) between networks are indicated in red. To facilitate interpretation, predictive networks are described according to domains of impairments implicated in aggression: cognitive control, social behavior, and emotion generation/reactivity. As the negative network did not contribute to prediction in the discovery sample (Figure 2), only the positive network is shown. To visualize comparisons among large-scale networks, edge weights are shown for each network pair that contributed to the model depicted in Figure 2 and are normalized by network pair size (i.e., number of edges in each network).
This connectome-based model of aggression was also replicable and generalizable to an out-of-sample dataset. First, replication of findings in ABCD indicated a similar pattern of functional organization across large-scale networks that predicted aggression severity (see Figure S4 for a visual depiction of the overlap of predictive edges and nodes between the discovery and external validation samples). Second, the model from the discovery dataset predicted aggression in the external ABCD dataset and vice versa. We also observed a similar pattern of results implicating frontal, temporal-parietal, and sensorimotor networks in aggression. In particular, dlPFC nodes were highly predictive for both EN-back and SST tasks. It is important to note that the connectome model was replicated and generalized to the independent ABCD sample, despite different measures of aggression. Here, the RPQ was used as the primary measure of maladaptive aggression because children were selected based on a criterion cut-off using the CBCL Aggressive Behavior scale as part of the RDoC framework to identify aggression transdiagnostically. In the ABCD sample, the CBCL was the most optimal measure of aggression and assessed a similar construct as the RPQ. Given that the connectome model demonstrated replication and generalization of findings to ABCD, this demonstrates potential robustness of brain-based models to predict aggression using different but related behavioral measures of aggression. This suggests that transdiagnostic, generalizable neural systems could be implicated in aggression.
The current study extends prior literature by investigating brain-wide connectivity of large-scale functional networks predictive of aggression in children. However, findings from the current study should also be interpreted in the context of other studies examining externalizing behaviors using machine learning and/or big data analytic approaches. For example, recent work has leveraged large datasets using related network neuroscience approaches to understand neuroetiologic pathways in children with disruptive behavior disorders97, 98 as well as broader externalizing behaviors99–101, which point to aberrant connectivity in frontoparietal regions and a potential broad network dysfunction similar to that observed in the current study. In addition, a recent study reported that sensorimotor network connectivity was associated with irritability in youths during a frustrating cognitive flexibility task68. Therefore, in conjunction with data-driven, predictive modeling approaches, the use of large-scale imaging data offers a unique opportunity to advance individual-level clinical predictions69, 70.
Study Limitations
First, the present study is cross-sectional and future research is needed to understand how these findings relate to longitudinal trajectories of connectivity impairment implicated in aggression. Second, while models were robust to common co-occurring internalizing, ADHD, and ASD symptoms, the functional significance of the identified networks in relation to other forms of developmental psychopathology associated with aggression remains to be tested in larger samples. Third, our models showed modest effect sizes, capturing approximately 10% of the variance, which was reduced to 1% to 5% in the replication analysis. The small effect sizes observed here for replication and external validation could in part be due to the use of data-driven, machine learning approaches, which are expected to have small effect size estimates when applied to large datasets102. Additionally, the effect sizes observed here are consistent with recent work examining brain-wide associations with phenotypic data in the ABCD dataset103. It is possible that imaging-derived metrics predicting modest amounts of variance in a complex phenotype may become a common finding with machine learning approaches applied to connectomics in large-scale samples. This could be partly due to the heterogeneity of complex neurocognitive traits and psychiatric disorders associated with brain-wide associations. Alternatively, given that psychopathology is supported by widely distributed circuitry104, machine learning approaches applied to brain-wide associations may pick up on generalizable features inherent in the connectome that can predict a complex phenotype, potentially reflecting more conservative effect size estimates102, 105. Future studies examining connectome predictive modeling approaches in large-scale samples will be important to assess the clinical utility of this method. Lastly, the task acquisition length was relatively short. Nonetheless, despite the shorter acquisition length, the generalization of large-scale networks—including the frontoparietal and medial frontal networks—emerged as predictive of aggression in the ABCD external validation sample. This may suggest greater reliability of network level prediction relative to node and/or edge level prediction66, which can have clinical implications for developing robust and reliable brain-based biomarkers with generalization to heterogeneous samples.
Conclusion
This study demonstrates that patterns of brain-wide connectivity predict severity of aggressive behavior in children, even when controlling for co-occurring psychiatric symptoms of ADHD, internalizing and social behavior deficits. Networks predictive of aggression included medial frontal, default mode, frontoparietal, salience, sensorimotor, and subcortical networks as well as complex patterns of integration among these networks. The predictive ability of these networks also generalized to an independent sample of children. These data demonstrate that individual differences in the functional connectome across large-scale networks implicated in cognitive control, social processing, and emotion generation/reactivity processes contribute to variability in aggression. These networks or “neural fingerprints” may be an appropriate target for development of biomarkers to inform targeted interventions for children with aggressive behavior.
Supplementary Material
Acknowledgments
This work was supported by NIMH grant R01MH101514 (D.G.S.). K.I. is a fellow on NCATS grant KL2 TR001862, TL1 TR001864, and the Translational Developmental Neuroscience Training Program (T32 MH18268) directed by Dr. Michael Crowley. We thank Ms. Sonia Rowley and Ms. Julia Zhong for their assistance with reviewing the final version of the manuscript, Ms. Iciar Iturmendi for her assistance with formatting figures 3 and 6, Dr. Megan Tudor for subject characterization assessments, and Ms. Emilie Bertschinger, Ms. Tess Gladstone and Ms. Carolyn Marsh for study coordination.
ABCD acknowledgement
A portion of the data used in the preparation of this article were obtained from the Adolescent Brain Cognitive Development (ABCD) Study (https://abcdstudy.org), held in the NIMH Data Archive (NDA). This is a multisite, longitudinal study designed to recruit more than 10,000 children age 9–10 and follow them over 10 years into early adulthood. The ABCD Study is supported by the National Institutes of Health and additional federal partners under award numbers U01DA041022, U01DA041028, U01DA041048, U01DA041089, U01DA041106, U01DA041117, U01DA041120, U01DA041134, U01DA041148, U01DA041156, U01DA041174, U24DA041123, U24DA041147, U01DA041093, and U01DA041025. A full list of supporters is available at https://abcdstudy.org/federal-partners.html. A listing of participating sites and a complete listing of the study investigators can be found at https://abcdstudy.org/scientists/workgroups/. ABCD consortium investigators designed and implemented the study and/or provided data but did not necessarily participate in analysis or writing of this report. This manuscript reflects the views of the authors and may not reflect the opinions or views of the NIH or ABCD consortium investigators.
Footnotes
Conflict of Interest: Dr. Sukhodolsky receives royalties from Guilford Press for a treatment manual on CBT for anger and aggression in children. Drs. Ibrahim, Noble, He, Lacadie, Crowley, McCarthy, and Scheinost have no competing interests or potential conflicts of interest to declare related to this study.
Preprint Servers
A version of this manuscript was posted as a preprint on Research Square. The authors retain full copyright. DOI: 10.21203/rs.3.rs-356217/v1
References
- 1.Connor DF, Newcorn JH, Saylor KE, Amann BH, Scahill L, Robb AS et al. Maladaptive aggression: with a focus on impulsive aggression in children and adolescents. J Child Adolesc Psychopharmacol 2019; 29(8): 576–591. [DOI] [PMC free article] [PubMed] [Google Scholar]
- 2.Tremblay RE, Vitaro F, Côté SM. Developmental origins of chronic physical aggression: a bio-psycho-social model for the next generation of preventive interventions. Annu Rev Psychol 2018; 69: 383–407. [DOI] [PubMed] [Google Scholar]
- 3.Vitiello B, Stoff DM. Subtypes of aggression and their relevance to child psychiatry. J Am Acad Child Adolesc Psychiatry 1997; 36(3): 307–315. [DOI] [PubMed] [Google Scholar]
- 4.Spring L, Carlson GA. The phenomenology of outbursts. Child and Adolescent Psychiatric Clinics 2021. [DOI] [PubMed] [Google Scholar]
- 5.American Psychiatric Association. Diagnostic and statistical manual of mental disorders. 5th edn. Author: Washington, DC, 2013. [Google Scholar]
- 6.Blair RJR, Leibenluft E, Pine DS. Conduct disorder and callous–unemotional traits in youth. N Engl J Med 2014; 371(23): 2207–2216. [DOI] [PMC free article] [PubMed] [Google Scholar]
- 7.Jensen PS, Youngstrom EA, Steiner H, Findling RL, Meyer RE, Malone RP et al. Consensus report on impulsive aggression as a symptom across diagnostic categories in child psychiatry: implications for medication studies. J Am Acad Child Adolesc Psychiatry 2007; 46(3): 309–322. [DOI] [PubMed] [Google Scholar]
- 8.Robb AS, Connor DF, Amann BH, Vitiello B, Nasser A, O’Neal W et al. Closing the gap: unmet needs of individuals with impulsive aggressive behavior observed in children and adolescents. CNS spectrums 2020: 1–9. [DOI] [PubMed] [Google Scholar]
- 9.Bolhuis K, Lubke GH, van der Ende J, Bartels M, van Beijsterveldt CE, Lichtenstein P et al. Disentangling heterogeneity of childhood disruptive behavior problems into dimensions and subgroups. J Am Acad Child Adolesc Psychiatry 2017; 56(8): 678–686. [DOI] [PubMed] [Google Scholar]
- 10.Olson SL, Sameroff AJ, Lansford JE, Sexton H, Davis-Kean P, Bates JE et al. Deconstructing the externalizing spectrum: Growth patterns of overt aggression, covert aggression, oppositional behavior, impulsivity/inattention, and emotion dysregulation between school entry and early adolescence. Dev Psychopathol 2013; 25(3): 817–842. [DOI] [PMC free article] [PubMed] [Google Scholar]
- 11.Rogers JC, De Brito SA. Cortical and subcortical gray matter volume in youths with conduct problems: a meta-analysis. JAMA psychiatry 2016; 73(1): 64–72. [DOI] [PubMed] [Google Scholar]
- 12.Alegria AA, Radua J, Rubia K. Meta-analysis of fMRI studies of disruptive behavior disorders. Am J Psychiatry 2016; 173(11): 1119–1130. [DOI] [PubMed] [Google Scholar]
- 13.Gabrieli JD, Ghosh SS, Whitfield-Gabrieli S. Prediction as a humanitarian and pragmatic contribution from human cognitive neuroscience. Neuron 2015; 85(1): 11–26. [DOI] [PMC free article] [PubMed] [Google Scholar]
- 14.Davidson RJ, Putnam KM, Larson CL. Dysfunction in the neural circuitry of emotion regulation--a possible prelude to violence. Science 2000; 289(5479): 591–594. [DOI] [PubMed] [Google Scholar]
- 15.Noordermeer SD, Luman M, Oosterlaan J. A systematic review and meta-analysis of neuroimaging in Oppositional Defiant Disorder (ODD) and Conduct Disorder (CD) taking Attention-Deficit Hyperactivity Disorder (ADHD) into account. Neuropsychol Rev 2016; 26(1): 44–72. [DOI] [PMC free article] [PubMed] [Google Scholar]
- 16.Marsh AA, Finger EC, Mitchell DG, Reid ME, Sims C, Kosson DS et al. Reduced amygdala response to fearful expressions in children and adolescents with callous-unemotional traits and disruptive behavior disorders. Am J Psychiatry 2008; 165(6): 712–720. [DOI] [PubMed] [Google Scholar]
- 17.Decety J, Michalska KJ, Akitsuki Y, Lahey BB. Atypical empathic responses in adolescents with aggressive conduct disorder: a functional MRI investigation. Biol Psychol 2009; 80(2): 203–211. [DOI] [PMC free article] [PubMed] [Google Scholar]
- 18.Coccaro EF, McCloskey MS, Fitzgerald DA, Phan KL. Amygdala and orbitofrontal reactivity to social threat in individuals with impulsive aggression. Biol Psychiatry 2007; 62(2): 168–178. [DOI] [PubMed] [Google Scholar]
- 19.Aghajani M, Klapwijk ET, van der Wee NJ, Veer IM, Rombouts SA, Boon AE et al. Disorganized amygdala networks in conduct-disordered juvenile offenders with callous-unemotional traits. Biol Psychiatry 2017; 82(4): 283–293. [DOI] [PubMed] [Google Scholar]
- 20.Ibrahim K, Eilbott J, Ventola P, He G, Pelphrey KA, McCarthy G et al. Reduced amygdala-prefrontal functional connectivity in children with autism spectrum disorder and co-occurring disruptive behavior. Biological Psychiatry: Cognitive Neurosience and Neuroimaging 2019; 4: 1031–1041. [DOI] [PMC free article] [PubMed] [Google Scholar]
- 21.Ewbank MP, Passamonti L, Hagan CC, Goodyer IM, Calder AJ, Fairchild G. Psychopathic traits influence amygdala–anterior cingulate cortex connectivity during facial emotion processing. Soc Cogn Affect Neurosci 2018; 13(5): 525–534. [DOI] [PMC free article] [PubMed] [Google Scholar]
- 22.Stoddard J, Tseng W-L, Kim P, Chen G, Yi J, Donahue L et al. Association of irritability and anxiety with the neural mechanisms of implicit face emotion processing in youths with psychopathology. JAMA psychiatry 2017; 74(1): 95–103. [DOI] [PMC free article] [PubMed] [Google Scholar]
- 23.Kryza-Lacombe M, Iturri N, Monk CS, Wiggins JL. Face emotion processing in pediatric irritability: neural mechanisms in a sample enriched for irritability with autism spectrum disorder. J Am Acad Child Adolesc Psychiatry 2019. [DOI] [PMC free article] [PubMed] [Google Scholar]
- 24.Blair R, Veroude K, Buitelaar J. Neuro-cognitive system dysfunction and symptom sets: a review of fMRI studies in youth with conduct problems. Neurosci Biobehav Rev 2016. [DOI] [PubMed] [Google Scholar]
- 25.Pawliczek CM, Derntl B, Kellermann T, Kohn N, Gur RC, Habel U. Inhibitory control and trait aggression: neural and behavioral insights using the emotional stop signal task. Neuroimage 2013; 79: 264–274. [DOI] [PubMed] [Google Scholar]
- 26.Puiu AA, Wudarczyk O, Goerlich KS, Votinov M, Herpertz-Dahlmann B, Turetsky B et al. Impulsive aggression and response inhibition in attention-deficit/hyperactivity disorder and disruptive behavioral disorders: Findings from a systematic review. Neurosci Biobehav Rev 2018; 90: 231–246. [DOI] [PubMed] [Google Scholar]
- 27.Hsieh I-J, Chen YY. Determinants of aggressive behavior: Interactive effects of emotional regulation and inhibitory control. PLoS One 2017; 12(4): e0175651. [DOI] [PMC free article] [PubMed] [Google Scholar]
- 28.Raaijmakers MA, Smidts DP, Sergeant JA, Maassen GH, Posthumus JA, Van Engeland H et al. Executive functions in preschool children with aggressive behavior: Impairments in inhibitory control. J Abnorm Child Psychol 2008; 36(7): 1097–1107. [DOI] [PubMed] [Google Scholar]
- 29.Scheinost D, Noble S, Horien C, Greene AS, Lake EM, Salehi M et al. Ten simple rules for predictive modeling of individual differences in neuroimaging. Neuroimage 2019; 193: 35–45. [DOI] [PMC free article] [PubMed] [Google Scholar]
- 30.Yip SW, Kiluk B, Scheinost D. Toward addiction prediction: An overview of cross-validated predictive modeling findings and considerations for future neuroimaging research. BP:CNNI 2019. [DOI] [PMC free article] [PubMed] [Google Scholar]
- 31.Finn E, Shen X, Scheinost D. Functional connectome fingerprinting: identifying individuals using patterns of brain connectivity. Nat Neurosci 2015; 18: 1664–1671. [DOI] [PMC free article] [PubMed] [Google Scholar]
- 32.Lake EM, Finn ES, Noble SM, Vanderwal T, Shen X, Rosenberg MD et al. The functional brain organization of an individual allows prediction of measures of social abilities transdiagnostically in autism and attention-deficit/hyperactivity disorder. Biol Psychiatry 2019; 86(4): 315–326. [DOI] [PMC free article] [PubMed] [Google Scholar]
- 33.Yip SW, Scheinost D, Potenza MN, Carroll KM. Connectome-based prediction of cocaine abstinence. Am J Psychiatry 2019; 176(2): 156–164. [DOI] [PMC free article] [PubMed] [Google Scholar]
- 34.Greene AS, Gao S, Noble S, Scheinost D, Constable RT. How tasks change whole-brain functional organization to reveal brain-phenotype relationships. Cell reports 2020; 32(8): 108066. [DOI] [PMC free article] [PubMed] [Google Scholar]
- 35.Greene AS, Gao S, Scheinost D, Constable RT. Task-induced brain state manipulation improves prediction of individual traits. Nature Commun 2018; 9(1): 1–13. [DOI] [PMC free article] [PubMed] [Google Scholar]
- 36.Jiang R, Zuo N, Ford JM, Qi S, Zhi D, Zhuo C et al. Task-induced brain connectivity promotes the detection of individual differences in brain-behavior relationships. Neuroimage 2020; 207: 116370. [DOI] [PMC free article] [PubMed] [Google Scholar]
- 37.Shen X, Finn E, Scheinost D, Rosenberg M, Chun M, Papademetris X et al. Using connectomebased predictive modeling to predict individual behavior from brain connectivity. nature protocols. Nat Protoc 2017; 12: 506–518. [DOI] [PMC free article] [PubMed] [Google Scholar]
- 38.Shmueli G To Explain or to Predict? Statistical Science 2010; 25(3): 289–310. [Google Scholar]
- 39.Casey B, Cannonier T, Conley MI, Cohen AO, Barch DM, Heitzeg MM et al. The adolescent brain cognitive development (ABCD) study: imaging acquisition across 21 sites. Dev Cogn Neurosci 2018; 32: 43–54. [DOI] [PMC free article] [PubMed] [Google Scholar]
- 40.Hart H, Radua J, Nakao T, Mataix-Cols D, Rubia K. Meta-analysis of functional magnetic resonance imaging studies of inhibition and attention in attention-deficit/hyperactivity disorder: exploring task-specific, stimulant medication, and age effects. JAMA psychiatry 2013; 70(2): 185–198. [DOI] [PubMed] [Google Scholar]
- 41.Cohen AO, Breiner K, Steinberg L, Bonnie RJ, Scott ES, Taylor-Thompson K et al. When is an adolescent an adult? Assessing cognitive control in emotional and nonemotional contexts. Psychol Sci 2016; 27(4): 549–562. [DOI] [PubMed] [Google Scholar]
- 42.Sukhodolsky DG, Wyk BCV, Eilbott JA, McCauley SA, Ibrahim K, Crowley MJ et al. Neural mechanisms of cognitive-behavioral therapy for aggression in children and adolescents: design of a randomized controlled trial within the National Institute for Mental Health Research Domain Criteria construct of frustrative non-reward. J Child Adolesc Psychopharmacol 2016; 26(1): 38–48. [DOI] [PMC free article] [PubMed] [Google Scholar]
- 43.Achenbach TM, Rescorla LA. Manual for the ASEBA School-Age Forms & Profiles. University of Vermont, Research Center for Children, Youth, and Families: Burlington, VT, 2001. [Google Scholar]
- 44.Kaufman J, Birmaher B, Axelson D, Perepletchikova F, Brent D, & Ryan N Schedule for Affective Disorders and Schizophrenia for School Aged Children: Present and Lifetime Version for DSM-5 (K-SADS-PL). Retrieved from https://www.pediatricbipolar.pitt.edu/resources/instruments. 2016.
- 45.Le Couteur A, Lord C, Rutter M. The Autism Diagnostic Interview-Revised (ADI-R). Western Psychological Services: CA, Los Angeles, 2003. [Google Scholar]
- 46.Lord C, Rutter M, DiLavore PC, Risi S. Autism Diagnostic ObservationSchedule—Second Edition (ADOS-2). Western Psychological Services: Los Angeles, CA, 2012. [Google Scholar]
- 47.Raine A, Dodge K, Loeber R, Gatzke-Kopp L, Lynam D, Reynolds C et al. The reactive–proactive aggression questionnaire: differential correlates of reactive and proactive aggression in adolescent boys. Aggress Behav 2006; 32(2): 159–171. [DOI] [PMC free article] [PubMed] [Google Scholar]
- 48.Bushman BJ, Anderson CA. Is it time to pull the plug on hostile versus instrumental aggression dichotomy? Psychol Rev 2001; 108(1): 273. [DOI] [PubMed] [Google Scholar]
- 49.Smeets KC, Oostermeijer S, Lappenschaar M, Cohn M, Van der Meer J, Popma A et al. Are proactive and reactive aggression meaningful distinctions in adolescents? A variable-and person-based approach. J Abnorm Child Psychol 2017; 45(1): 1–14. [DOI] [PMC free article] [PubMed] [Google Scholar]
- 50.Ibrahim K, Kalvin C, Marsh CL, Anzano A, Gorynova L, Cimino K et al. Anger rumination is associated with restricted and repetitive behaviors in children with autism spectrum disorder. J Autism Dev Disord 2019; 49(9): 3656–3668. [DOI] [PMC free article] [PubMed] [Google Scholar]
- 51.Wechsler D WAIS-III Administration and Scoring Manual. The Psychological Corporation: San Antonio, TX, 1997. [Google Scholar]
- 52.Constantino JN. Social Responsiveness Scale (SRS). Western Psychological Services: Los Angeles, 2005. [Google Scholar]
- 53.Cholemkery H, Kitzerow J, Rohrmann S, Freitag CM. Validity of the social responsiveness scale to differentiate between autism spectrum disorders and disruptive behaviour disorders. Eur Child Adolesc Psychiatry 2014; 23(2): 81–93. [DOI] [PubMed] [Google Scholar]
- 54.Crick NR, Dodge KA. A review and reformulation of social information-processing mechanisms in children’s social adjustment. Psychol Bull 1994; 115(1): 74. [Google Scholar]
- 55.Dodge KA, Coie JD. Social-information-processing factors in reactive and proactive aggression in children’s peer groups. J Pers Soc Psychol 1987; 53(6): 1146. [DOI] [PubMed] [Google Scholar]
- 56.Helseth SA, Waschbusch DA, King S, Willoughby MT. Aggression in children with conduct problems and callous-unemotional traits: Social information processing and response to peer provocation. J Abnorm Child Psychol 2015; 43(8): 1503–1514. [DOI] [PubMed] [Google Scholar]
- 57.Tottenham N, Tanaka JW, Leon AC, McCarry T, Nurse M, Hare TA et al. The NimStim set of facial expressions: judgments from untrained research participants. Psychiatry Res 2009; 168(3): 242–249. [DOI] [PMC free article] [PubMed] [Google Scholar]
- 58.Sukhodolsky DG, Vander Wyk BC, Eilbott JA, McCauley SA, Ibrahim K, Crowley MJ et al. Neural Mechanisms of Cognitive-Behavioral Therapy for Aggression in Children and Adolescents: Design of a Randomized Controlled Trial Within the National Institute for Mental Health Research Domain Criteria Construct of Frustrative Non-Reward. J Child Adolesc Psychopharmacol 2016; 26(1): 38–48. [DOI] [PMC free article] [PubMed] [Google Scholar]
- 59.Smith SM, Jenkinson M, Woolrich MW, Beckmann CF, Behrens TE, Johansen-Berg H et al. Advances in functional and structural MR image analysis and implementation as FSL. Neuroimage 2004; 23: S208–S219. [DOI] [PubMed] [Google Scholar]
- 60.Woolrich MW, Jbabdi S, Patenaude B, Chappell M, Makni S, Behrens T et al. Bayesian analysis of neuroimaging data in FSL. Neuroimage 2009; 45(1): S173–S186. [DOI] [PubMed] [Google Scholar]
- 61.Jenkinson M, Bannister P, Brady M, Smith S. Improved optimization for the robust and accurate linear registration and motion correction of brain images. Neuroimage 2002; 17(2): 825–841. [DOI] [PubMed] [Google Scholar]
- 62.Finn ES, Scheinost D, Finn DM, Shen X, Papademetris X, Constable RT. Can brain state be manipulated to emphasize individual differences in functional connectivity? Neuroimage 2017; 160: 140–151. [DOI] [PMC free article] [PubMed] [Google Scholar]
- 63.Rosenberg MD, Scheinost D, Greene AS, Avery EW, Kwon YH, Finn ES et al. Functional connectivity predicts changes in attention observed across minutes, days, and months. Proceedings of the National Academy of Sciences 2020; 117(7): 3797–3807. [DOI] [PMC free article] [PubMed] [Google Scholar]
- 64.Rutherford HJ, Potenza MN, Mayes LC, Scheinost D. The application of connectome-based predictive modeling to the maternal brain: implications for mother–infant bonding. Cereb Cortex 2020; 30(3): 1538–1547. [DOI] [PMC free article] [PubMed] [Google Scholar]
- 65.Barron DS, Gao S, Dadashkarimi J, Greene AS, Spann MN, Noble S et al. Transdiagnostic, Connectome-Based Prediction of Memory Constructs Across Psychiatric Disorders. Cereb Cortex 2021; 31(5): 2523–2533. [DOI] [PMC free article] [PubMed] [Google Scholar]
- 66.Noble S, Spann MN, Tokoglu F, Shen X, Constable RT, Scheinost D. Influences on the test–retest reliability of functional connectivity MRI and its relationship with behavioral utility. Cereb Cortex 2017; 27(11): 5415–5429. [DOI] [PMC free article] [PubMed] [Google Scholar]
- 67.Rapuano KM, Rosenberg MD, Maza MT, Dennis NJ, Dorji M, Greene AS et al. Behavioral and brain signatures of substance use vulnerability in childhood. Dev Cogn Neurosci 2020; 46: 100878. [DOI] [PMC free article] [PubMed] [Google Scholar]
- 68.Scheinost D, Dadashkarimi J, Finn ES, Wambach CG, MacGillivray C, Roule AL et al. Functional connectivity during frustration: a preliminary study of predictive modeling of irritability in youth. Neuropsychopharmacology 2021; 46(7): 1300–1306. [DOI] [PMC free article] [PubMed] [Google Scholar]
- 69.Bzdok D, Meyer-Lindenberg A. Machine learning for precision psychiatry: opportunities and challenges. BP:CNNI 2018; 3(3): 223–230. [DOI] [PubMed] [Google Scholar]
- 70.Zhang X, Braun U, Tost H, Bassett DS. Data-driven approaches to neuroimaging analysis to enhance psychiatric diagnosis and therapy. BP:CNNI 2020; 5(8): 780–790. [DOI] [PubMed] [Google Scholar]
- 71.Raschle NM, Fehlbaum LV, Menks WM, Martinelli A, Prätzlich M, Bernhard A et al. Atypical dorsolateral prefrontal activity in female adolescents with conduct disorder during effortful emotion regulation. BP:CNNI 2019; 4(11): 984–994. [DOI] [PMC free article] [PubMed] [Google Scholar]
- 72.Etkin A, Egner T, Kalisch R. Emotional processing in anterior cingulate and medial prefrontal cortex. Trends Cogn Sci 2011; 15(2): 85–93. [DOI] [PMC free article] [PubMed] [Google Scholar]
- 73.Milad MR, Quirk GJ. Neurons in medial prefrontal cortex signal memory for fear extinction. Nature 2002; 420(6911): 70–74. [DOI] [PubMed] [Google Scholar]
- 74.Silvers JA, Insel C, Powers A, Franz P, Helion C, Martin RE et al. vlPFC–vmPFC–amygdala interactions underlie age-related differences in cognitive regulation of emotion. Cereb Cortex 2016; 27(7): 3502–3514. [DOI] [PMC free article] [PubMed] [Google Scholar]
- 75.Werhahn JE, Mohl S, Willinger D, Smigielski L, Roth A, Hofstetter C et al. Aggression subtypes relate to distinct resting state functional connectivity in children and adolescents with disruptive behavior. Eur Child Adolesc Psychiatry 2020: 1–13. [DOI] [PMC free article] [PubMed] [Google Scholar]
- 76.Naaijen J, Mulder LM, Ilbegi S, de Bruijn S, Kleine-Deters R, Dietrich A et al. Specific cortical and subcortical alterations for reactive and proactive aggression in children and adolescents with disruptive behavior. Neuroimage: clinical 2020; 27: 102344. [DOI] [PMC free article] [PubMed] [Google Scholar]
- 77.van den Heuvel MP, Sporns O. A cross-disorder connectome landscape of brain dysconnectivity. Nature reviews neuroscience 2019; 20(7): 435–446. [DOI] [PMC free article] [PubMed] [Google Scholar]
- 78.Jones DT, Graff-Radford J, Lowe VJ, Wiste HJ, Gunter JL, Senjem ML et al. Tau, amyloid, and cascading network failure across the Alzheimer’s disease spectrum. Cortex 2017; 97: 143–159. [DOI] [PMC free article] [PubMed] [Google Scholar]
- 79.Jones DT, Knopman DS, Gunter JL, Graff-Radford J, Vemuri P, Boeve BF et al. Cascading network failure across the Alzheimer’s disease spectrum. Brain 2016; 139(2): 547–562. [DOI] [PMC free article] [PubMed] [Google Scholar]
- 80.Buckner RL, Andrews-Hanna JR, Schacter DL. The brain’s default network: anatomy, function, and relevance to disease. 2008. [DOI] [PubMed]
- 81.Mars RB, Neubert F-X, Noonan MP, Sallet J, Toni I, Rushworth MF. On the relationship between the “default mode network” and the “social brain”. Front Hum Neurosci 2012; 6: 189. [DOI] [PMC free article] [PubMed] [Google Scholar]
- 82.Rosen ML, Sheridan MA, Sambrook KA, Dennison MJ, Jenness JL, Askren MK et al. Salience network response to changes in emotional expressions of others is heightened during early adolescence: relevance for social functioning. Developmental Science 2018; 21(3): 12571. [DOI] [PMC free article] [PubMed] [Google Scholar]
- 83.Seeley WW, Menon V, Schatzberg AF, Keller J, Glover GH, Kenna H et al. Dissociable intrinsic connectivity networks for salience processing and executive control. J Neurosci 2007; 27(9): 2349–2356. [DOI] [PMC free article] [PubMed] [Google Scholar]
- 84.Chiong W, Wilson SM, D’Esposito M, Kayser AS, Grossman SN, Poorzand P et al. The salience network causally influences default mode network activity during moral reasoning. Brain 2013; 136(6): 1929–1941. [DOI] [PMC free article] [PubMed] [Google Scholar]
- 85.Aghajani M, Colins OF, Klapwijk ET, Veer IM, Andershed H, Popma A et al. Dissociable relations between amygdala subregional networks and psychopathy trait dimensions in conduct-disordered juvenile offenders. Hum Brain Mapp 2016; 37(11): 4017–4033. [DOI] [PMC free article] [PubMed] [Google Scholar]
- 86.Broulidakis MJ, Fairchild G, Sully K, Blumensath T, Darekar A, Sonuga-Barke EJ. Reduced default mode connectivity in adolescents with conduct disorder. J Am Acad Child Adolesc Psychiatry 2016; 55(9): 800–808. [DOI] [PubMed] [Google Scholar]
- 87.Cohn MD, Pape LE, Schmaal L, van den Brink W, van Wingen G, Vermeiren RR et al. Differential relations between juvenile psychopathic traits and resting state network connectivity. Hum Brain Mapp 2015; 36(6): 2396–2405. [DOI] [PMC free article] [PubMed] [Google Scholar]
- 88.Dalwani MS, Tregellas JR, Andrews-Hanna JR, Mikulich-Gilbertson SK, Raymond KM, Banich MT et al. Default mode network activity in male adolescents with conduct and substance use disorder. Drug Alcohol Depend 2014; 134: 242–250. [DOI] [PMC free article] [PubMed] [Google Scholar]
- 89.Sebastian CL, McCrory EJ, Cecil CA, Lockwood PL, De Brito SA, Fontaine NM et al. Neural responses to affective and cognitive theory of mind in children with conduct problems and varying levels of callous-unemotional traits. Arch Gen Psychiatry 2012; 69(8): 814–822. [DOI] [PubMed] [Google Scholar]
- 90.Choe DE, Shaw DS, Forbes EE. Maladaptive social information processing in childhood predicts young men’s atypical amygdala reactivity to threat. J Child Psychol Psychiatry 2015; 56(5): 549–557. [DOI] [PMC free article] [PubMed] [Google Scholar]
- 91.Capage L, Watson AC. Individual differences in theory of mind, aggressive behavior, and social skills in young children. Early Education and Development 2001; 12(4): 613–628. [Google Scholar]
- 92.Mandy W, Skuse D, Steer C, St Pourcain B, Oliver BR. Oppositionality and socioemotional competence: interacting risk factors in the development of childhood conduct disorder symptoms. J Am Acad Child Adolesc Psychiatry 2013; 52(7): 718–727. [DOI] [PubMed] [Google Scholar]
- 93.Reeck C, Ames DR, Ochsner KN. The social regulation of emotion: An integrative, cross-disciplinary model. Trends Cogn Sci 2016; 20(1): 47–63. [DOI] [PMC free article] [PubMed] [Google Scholar]
- 94.Fairchild G, Van Goozen SH, Calder AJ, Stollery SJ, Goodyer IM. Deficits in facial expression recognition in male adolescents with early-onset or adolescence-onset conduct disorder. J Child Psychol Psychiatry 2009; 50(5): 627–636. [DOI] [PMC free article] [PubMed] [Google Scholar]
- 95.Lovett BJ, Sheffield RA. Affective empathy deficits in aggressive children and adolescents: A critical review. Clin Psychol Rev 2007; 27(1): 1–13. [DOI] [PubMed] [Google Scholar]
- 96.Chudzik L Moral judgment and conduct disorder intensity in adolescents involved in delinquency: Matching controls by school grade. Psychol Rep 2007; 101(1): 221–236. [DOI] [PubMed] [Google Scholar]
- 97.Hawes SW, Waller R, Byrd AL, Bjork JM, Dick AS, Sutherland MT et al. Reward processing in children with disruptive behavior disorders and callous-unemotional traits in the ABCD study. Am J Psychiatry 2021; 178(4): 333–342. [DOI] [PMC free article] [PubMed] [Google Scholar]
- 98.Waller R, Hawes SW, Byrd AL, Dick AS, Sutherland MT, Riedel MC et al. Disruptive behavior problems, callous-unemotional traits, and regional gray matter volume in the Adolescent Brain and Cognitive Development Study. BP:CNNI 2020; 5(5): 481–489. [DOI] [PMC free article] [PubMed] [Google Scholar]
- 99.Castellanos-Ryan N, Struve M, Whelan R, Banaschewski T, Barker GJ, Bokde AL et al. Neural and cognitive correlates of the common and specific variance across externalizing problems in young adolescence. Am J Psychiatry 2014; 171(12): 1310–1319. [DOI] [PubMed] [Google Scholar]
- 100.Gong W, Rolls ET, Du J, Feng J, Cheng W. Brain structure is linked to the association between family environment and behavioral problems in children in the ABCD study. Nature Commun 2021; 12(1): 1–10. [DOI] [PMC free article] [PubMed] [Google Scholar]
- 101.Silveira S, Boney S, Tapert SF, Mishra J. Developing functional network connectivity of the dorsal anterior cingulate cortex mediates externalizing psychopathology in adolescents with child neglect. Dev Cogn Neurosci 2021; 49: 100962. [DOI] [PMC free article] [PubMed] [Google Scholar]
- 102.Yarkoni T, Westfall J. Choosing prediction over explanation in psychology: Lessons from machine learning. Perspect Psychol Sci 2017; 12(6): 1100–1122. [DOI] [PMC free article] [PubMed] [Google Scholar]
- 103.Marek S, Tervo-Clemmens B, Calabro FJ, Montez DF, Kay BP, Hatoum AS et al. Towards reproducible brain-wide association studies. bioRxiv 2020. [Google Scholar]
- 104.Sha Z, Wager TD, Mechelli A, He Y. Common dysfunction of large-scale neurocognitive networks across psychiatric disorders. Biol Psychiatry 2019; 85(5): 379–388. [DOI] [PubMed] [Google Scholar]
- 105.Cremers HR, Wager TD, Yarkoni T. The relation between statistical power and inference in fMRI. PLoS One 2017; 12(11): 0184923. [DOI] [PMC free article] [PubMed] [Google Scholar]
- 106.Whelan R, Conrod PJ, Poline J-B, Lourdusamy A, Banaschewski T, Barker GJ et al. Adolescent impulsivity phenotypes characterized by distinct brain networks. Nat Neurosci 2012; 15(6): 920. [DOI] [PubMed] [Google Scholar]
Associated Data
This section collects any data citations, data availability statements, or supplementary materials included in this article.
Supplementary Materials
Data Availability Statement
To promote data transparency, anonymized data that support the findings of this study are available from the corresponding authors upon reasonable request. Data from the studies reported in this paper (transdiagnostic sample from Yale and ABCD) have also been shared on the National Institute of Mental Health Data Archive (NDA) https://nda.nih.gov/. CPM code is available at: https://github.com/YaleMRRC/CPM.