

Summary
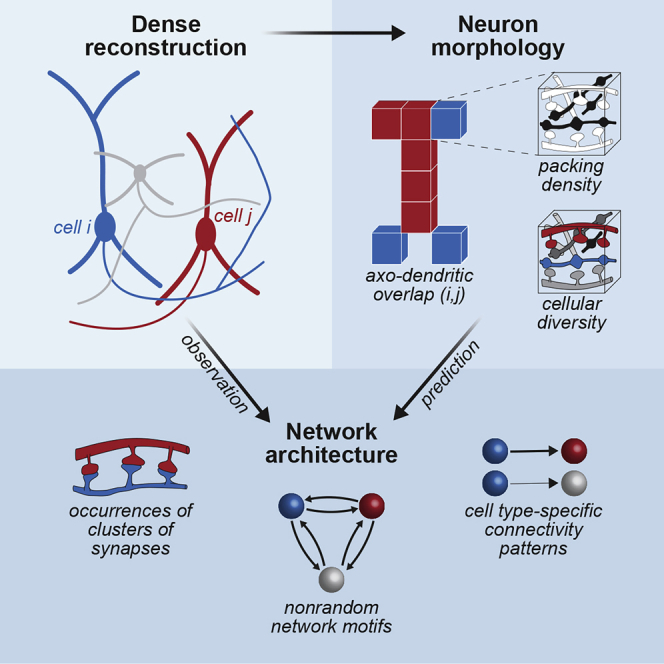
The neurons in the cerebral cortex are not randomly interconnected. This specificity in wiring can result from synapse formation mechanisms that connect neurons, depending on their electrical activity and genetically defined identity. Here, we report that the morphological properties of the neurons provide an additional prominent source by which wiring specificity emerges in cortical networks. This morphologically determined wiring specificity reflects similarities between the neurons’ axo-dendritic projections patterns, the packing density, and the cellular diversity of the neuropil. The higher these three factors are, the more recurrent is the topology of the network. Conversely, the lower these factors are, the more feedforward is the network’s topology. These principles predict the empirically observed occurrences of clusters of synapses, cell type-specific connectivity patterns, and nonrandom network motifs. Thus, we demonstrate that wiring specificity emerges in the cerebral cortex at subcellular, cellular, and network scales from the specific morphological properties of its neuronal constituents.
Keywords: connectome, network topology, neuron morphology, cluster of synapses, barrel cortex
Graphical abstract
Highlights
-
•
Neuronal network architectures reflect the morphologies of their constituents
-
•
Morphology predicts nonrandom connectivity from subcellular to network scales
-
•
Morphology predicts connectivity patterns consistent with those observed empirically
-
•
Neuron morphology is a major source for wiring specificity in the cerebral cortex
Udvary et al. reveal four basic principles by which the morphological properties of the neurons shape the specific architecture of the networks they form. These principles can account for nonrandom connectivity patterns that are observed empirically between the neurons in the cerebral cortex at subcellular, cellular, and network scales.
Introduction
Neuronal networks are implemented in the brain via a plethora of molecular mechanisms, which form synaptic connections between the neurons’ dendrites and axons (Bennett et al., 2018; Berry and Nedivi, 2017; Lefebvre et al., 2015; Sanes and Yamagata, 2009; Yogev and Shen, 2014). Axo-dendritic overlap is, thus, necessary for the formation of synapses, as it constrains which neurons could connect to one another and where along their axonal and dendritic morphologies these connections could occur. Yet, it is unclear to what degree the diverse morphological properties of the neurons impact the architecture of the networks they form (Rees et al., 2017).
One major challenge for answering this question is that axo-dendritic overlap is generally not a sufficient condition for synapse formation (Mishchenko et al., 2010; Briggman et al., 2011; Brown and Hestrin, 2009; Kasthuri et al., 2015; Motta et al., 2019). For example, the vast majority of axons in the cerebral cortex remain unconnected to close-by dendrites, while a subset of them forms clusters of synapses by connecting to multiple spines along the same dendritic branch (Kasthuri et al., 2015; Motta et al., 2019). Similarly, axo-dendritic overlap does not account for the patterns of synaptic connections between pairs of neurons (Holler et al., 2021) or for differences in connection probabilities that reflect the neurons’ cell types (Brown and Hestrin, 2009). Moreover, cortical neurons form network motifs—for example, feedforward loops—that generally occur more (or less) frequently than expected for randomly connected networks (Milo et al., 2002; Song et al., 2005). Such nonrandom topologies could arise from simple sets of wiring rules (Sanes and Yamagata, 2009; Yogev and Shen, 2014) or via learning (Miner and Triesch, 2016). The absence of synaptic connections despite axo-dendritic overlap, the occurrence of clusters of synapses, cell type-specific connectivity, and nonrandom topologies are interpreted as wiring specificity that emerges from specific synapse formation mechanisms that connect the neurons based on their genetically defined cellular identity and electrical activity (Kasthuri et al., 2015).
However, even when neurons are connected randomly by axo-dendritic overlap, the resulting network models display specific connectivity patterns at subcellular and cellular scales (Binzegger et al., 2004; Egger et al., 2014), as well as generally nonrandom topologies (Egger et al., 2014; Gal et al., 2017). Furthermore, morphological properties of the neurons—such as dendrite polarity—can constitute a defining source for nonrandom occurrences of network motifs (Gal et al., 2019). These studies indicate that the empirically observed wiring specificity might reflect morphological properties of the neurons, specific synapse formation mechanisms, or a combination thereof. However, conclusive answers to the questions—namely, how does neuron morphology impact connectivity, and how can these principles be disentangled despite wiring specificity that reflects the neurons’ identity and activity?—remain unknown.
Here, we quantitatively address these questions by using a statistical approach (Egger et al., 2014) that allows us to derive how networks would appear in the absence of synapse formation mechanisms that result in wiring specificity (e.g., molecular recognition of cell type and activity dependence). We apply this approach to a dense model of the vibrissa-related part of the rat primary somatosensory cortex—the barrel cortex (Narayanan et al., 2017)—and to a dense reconstruction of a petascale volume of human cortex (Shapson-Coe et al., 2021). We find three morphology-related factors that translate into specific pairwise and higher-order connectivity patterns. We show that, in agreement with empirical connectivity data, these factors predict the general absence of synapses despite axo-dendritic overlap, occurrences of clusters of synapses, cell type-specific connectivity, and nonrandom network topologies.
Results
We consider three factors by which neuron morphology constrains connectivity (Egger et al., 2014). For this purpose, we take the dendrites and axons of all neurons that project into a brain volume of interest into account (Figure 1A). First, we determine the respective subvolumes of the neuropil in which the dendritic and axonal projection patterns of any pair of neurons overlap (Figure 1B). Second, we determine the total numbers of axonal boutons (i.e., presynaptic sites), dendritic spines, and other postsynaptic sites along dendritic shafts and somata within each subvolume, subsequently referred to as packing density (Figure 1C). Third, we determine the numbers of neurons that the axonal and dendritic branches within each subvolume originate from, subsequently referred to as cellular diversity (Figure 1D). Based on the hence defined packing density and cellular diversity of the neuropil, we determine all combinations by which the neurons can connect with one another within each subvolume (Figure 1E). We neither consider the trajectories of axonal and dendritic branches within a subvolume, nor their respective distances (Markram et al., 2015). Thus, the sole criterion for connectivity is the presence of a pre- and postsynaptic site within the same subvolume. However, we take the different postsynaptic targets of excitatory (e.g., spines) and inhibitory boutons (e.g., shafts) into account (Figure 1E). Finally, we generate each of the combinations by which the neurons can be connected within and across subvolumes, and thereby derive the dense wiring diagram for each of the network configurations that could emerge in principle from axo-dendritic overlap (Figure 1F).
Figure 1.

Concept for testing the impact of neuron morphology on network architecture
(A) We consider all neurons whose morphologies project into a brain volume of interest (black box). We differentiate between excitatory (EXC) and inhibitory (INH) cells. For each neuron, we determine the boutons along its axon (presynaptic sites [PREs]), and the postsynaptic sites (POSTs) along its soma and dendrites.
(B) We divide the brain volume into small subvolumes, and determine the respective subvolumes in which the dendrite and axon projection patterns of any pair of neurons overlap.
(C) We consider the total number of PREs and POSTs within each subvolume (i.e., packing density).
(D) We consider the number of neurons from which the PREs and POSTs originate (i.e., cellular diversity).
(E) Packing density and cellular diversity of the neuropil define the possible combinations by which the neurons could connect to one another. We allow the boutons of EXC and INH neurons to target spines and somata/shafts, respectively.
(F) By determining all possible combinations across all subvolumes, we generate all networks that could emerge from the neurons’ axo-dendritic overlap.
(G) By assuming that all possible connections are equally likely, we calculate how likely each of the network configurations would appear in the absence of synapse formation mechanisms that result in wiring specificity. This statistical approach allows us to analyze connectivity patterns that emerge irrespective of which neurons whose axons and dendrites overlap are connected.
We calculate how likely each of the network configurations occurs if all pre- and postsynaptic sites within a subvolume are equally likely to connect to one another (Egger et al., 2014). For this purpose, we assume that specific properties of the neurons, such as cell type and activity, do not increase or decrease the probability of being connected. We formulate these assumptions mathematically ((Equation 1), (Equation 2), (Equation 3) in the STAR Methods), and thereby derive the likelihoods for how networks would appear if they were solely due to the morphological properties of the neurons (Figure 1F)—i.e., in the absence of synapse formation mechanisms that introduce wiring specificity. Rather than analyzing the connectivity patterns of particular network configurations, our statistical approach allows us to jointly analyze the entire ensemble of network configurations (Gibbs, 1902). Thereby, we can explore the impact of neuron morphology on network architecture by deriving connectivity statistics from subcellular to network scales that are shared between all network configurations (Egger et al., 2014), irrespective of which particular neurons whose pre- and postsynaptic sites overlap are connected (Figure 1G).
We apply our statistical approach first to the barrel cortex model. The computational framework that we developed to generate the model, including a comprehensive description of the underlying assumptions was reported previously (Egger et al., 2014), and is summarized in the STAR Methods. The model is based on dendrite and axon reconstructions that we obtained via in vivo labeling of individual neurons across all layers of the barrel cortex (Egger et al., 2015; Narayanan et al., 2015), and in the primary thalamus of the vibrissal system (Oberlaender et al., 2012a, 2012b)—the ventral posterior medial nucleus (VPM). Here, we show that the model provides realistic and robust estimates of the dendrite and axon projection patterns for the major cortical cell types (Figure S1), as well as for the packing density and cellular diversity in any subvolume of the barrel cortex (Figure S2).
Neuron morphology translates into sparse connectivity
First, we test the impact of neuron morphology on pairwise connectivity. For this purpose, we quantify the axo-dendritic overlap, packing density, and cellular diversity in the barrel cortex model at different spatial resolutions (here, cubic subvolumes with 1, 5, 10, 25, 50, or 100 μm edge lengths). We illustrate these quantifications at the resolution of 50 μm (Figure S3) and exemplify how morphology impacts connectivity for three neurons (Figure 2A)—a pyramidal neuron in layer 2 (L2PY), a pyramidal tract neuron in layer 5 (L5PT), and a corticocortical neuron in layer 6 (L6CC). At this resolution, each subvolume contains more than 100,000 pre- and postsynaptic sites, respectively (Figure 2B), which originate from more than 15,000 neurons. The combination of possible connections within each subvolume hence gives rise to an enormous number of network configurations by which the neurons across the barrel cortex model can connect to one another. In the vast majority of these configurations, any particular overlapping axon-dendrite pair remains unconnected, because their pre- and postsynaptic sites connect to those of other neurons that overlap in this subvolume (Figure 2C). An analysis of the ensemble reveals that in any network configuration, 99.6% ± 0.1% of the axon-dendrite pairs within any subvolume remain unconnected despite their overlap. The absence of connections between overlapping branch pairs emerges irrespective of the spatial resolution at which overlap is determined (Figure 2D). Because of the high packing density of the neuropil, the number of axon-dendrite pairs generally exceeds the number of synapses in a subvolume by one to two orders of magnitude. Thus, axo-dendritic overlap could predict connectivity, but in principle for only a small minority of the overlapping branch pairs (<1%).
Figure 2.

Neuron morphology translates into sparse connectivity
(A) Illustration of the anatomically detailed model of the rat barrel cortex. Here, we highlight the somata, dendrites and axons of three example neurons: a pyramidal neuron in layer 2 (L2PY; Cell i), a pyramidal tract neuron (L5PT; Cell j), and a corticocortical pyramidal neuron (L6CC; Cell k).
(B) Example subvolume in which the L2PY axon represents ten boutons (i.e., PREs). The L5PT dendrites represent 114 spines (i.e., POSTs). The number of 129,263 POSTs reflects all spines, and all postsynaptic sites on inhibitory somata and dendritic shafts in this subvolume.
(C) Probabilities that the L2PY axons forms none, one or more connections with the L5PT dendrites in this subvolume.
(D) Axon-dendrite pairs versus the number synapses that they represent for different spatial resolutions at which we determined axo-dendritic overlap. If axo-dendritic overlap predicts connectivity, the two lines would match.
(E) Axon-dendrite pairs whose overlap yields none, one or more connections across all network configurations.
(F) The L2PY axon overlaps with the L5PT dendrites in 13 subvolumes.
(G) Number of overlap volumes for all neuron pairs versus connections between them; 100% indicates that two neurons are connected by as many synapses as they have overlap volumes.
(H) Neuron pairs that overlap versus connected neurons for different spatial resolutions at which we determined axo-dendritic overlap.
Most neurons contribute more than one pre- and/or postsynaptic site to each subvolume (Figure 2B), which results in network configurations where several synapses connect an axon-dendrite pair (Figure 2C). An analysis of the ensemble reveals that in any network configuration, more than 1% of the connected axon-dendrite pairs in any subvolume form clusters of synapses with up to 5 connections—and with even more connections in some of the subvolumes (Figure 2E). Furthermore, the axons and dendrites of neuron pairs typically overlap in more than one subvolume (Figure 2F). The probability that overlap predicts connectivity is already low in each subvolume. The likelihood that network configurations occur in which neuron pairs are connected in all of their overlap volumes—and in particular that all of their overlapping pre- and postsynaptic sites are connected—is hence infinitesimally small (Figure 2G). Irrespective of the spatial resolution at which overlap is determined, neurons whose axons and dendrites overlap will generally remain unconnected in any network configuration that emerges from the barrel cortex model (Figure 2H). Thus, by shaping the packing density and cellular diversity of the neuropil, morphology impacts how sparsely neurons connect to one another, and how frequently clusters of synapses occur between them.
Neuron morphology translates into nonrandom network topology
Next, we test the impact of neuron morphology on higher-order connectivity. For this purpose, we calculate the likelihoods for the occurrences of all fifteen motifs by which three neurons in the barrel cortex model can connect to one another (Figure 3A). For example, the three neurons shown in Figure 2A will most likely form the motif with a single unidirectional connection (L2PY → L5PT), less likely motifs with one bidirectional connection (L5PT ←→ L6CC), and never motifs with more than one bidirectional connection (i.e., the L5PT and L6CC axons do not overlap with the L2PY dendrites). The motif that the three neurons form differs across networks configurations (Figure 3B), and the likelihood for the occurrence of each particular motif depends on the neurons’ pairwise connection probabilities within and across their respective overlap volumes (Figure S3). Here, we compare the occurrences of motifs between neurons in the barrel cortex model with those of randomly connected networks that have the same number of neurons and connections (Figure 3C). An analysis of the ensemble reveals that, in any network configuration, the occurrences of motifs deviate from those in the random networks, even though both the barrel cortex model and the random networks have the same pairwise connectivity statistics (Figure 3D).
Figure 3.

Neuron morphology translates into nonrandom network topology
(A) Somata of example neurons (gray) whose axons overlap with the dendrites of at least one of the neurons from Figure 2A.
(B) Two network configurations for 50 neurons from (A) that we predict to occur with different likelihoods.
(C) Random network example derived from the same pairwise connection probability distribution that we used to generate the networks in (B). The number of nodes and edges are identical to (B), but the occurrences (n) of motifs differ (e.g., motif 10 in [E]). One example for motif 10 is highlighted in black per network in (B) and (C).
(D) Connection probability distribution for all pairs of neurons from (A).
(E) Ratios between motif occurrences in networks from the barrel cortex model versus random networks (1, equally abundant; >1, over-represented compared with random networks; <1, under-represented).
(F) Deviations in the occurrences of motif 10 compared to random networks for different cell type-specific groupings (n = 220) versus the respective means and CVs of the underlying connection probability distributions.
(G) The likelihoods to observe recurrent loops and feedforward chains between up to ten neurons in networks from the barrel cortex model versus in random networks.
The degree to which motif occurrences differ from those in random networks depends on how we group the neurons in the barrel cortex model with respect to their soma location within a particular layer or barrel column, cell types, specific inter-somatic distances, or combinations thereof (Figure S4). For example, motif 7 (a feedforward loop) occurs more frequently in the network configurations that emerge from the barrel cortex model than in random networks—i.e., it is over-represented (Figure 3E). In contrast, this motif is under-represented when we consider only the subnetworks that the excitatory neurons form in layer 5 (Figure 3E). These grouping-dependent occurrences of motifs correlate with differences in the underlying pairwise statistics. For example, motif 10 transitions from over- to under-representation, depending on the mean connection probability within the group of neurons (Figure 3F). The respective magnitude of over- and under-representation reflects the coefficients of variation (CV) of connection probabilities (Figure 3F). These relationships indicate that the mean and CV (i.e., width) of connection probability distributions—subsequently referred to as a network’s sparsity and heterogeneity—quantitatively and qualitatively impact the nonrandom topology of neuronal networks. Beyond triplet motifs, recurrence characterizes the topology of the barrel cortex networks, as over-representation increases with the number of bidirectional connections and with the number of neurons per motif (Figure 3G). Conversely, the under-representation of feedforward motifs increases with the number of neurons per motif. Thus, the topology that emerges in networks from neuron morphology generally deviates from those of random networks.
Three morphology-related factors translate into network architecture
How is it possible that neuron morphology translates into nonrandom network architectures? How can the degrees of sparsity and heterogeneity in pairwise connectivity have such a defining impact on the networks’ specific nonrandom topological properties? To address these questions, we systematically explore the mathematical basis that underlies the occurrences of motifs. For this purpose, we consider the ensemble of configurations as a distribution of pairwise connection probabilities that generates networks. If each connection is drawn independently from any such generating distribution, motifs will occur as expected for randomly connected networks—i.e., occurrences are independent from the network’s heterogeneity and only reflect the mean of the underlying pairwise statistics (Figure S5A; Equation 4 in the STAR Methods). Thus, our observations of nonrandom occurrences of motifs, and their dependencies on network heterogeneity, cannot be consistent with the assumption that connection probabilities are independent of one another. Instead, only correlations in pairwise connectivity could explain our observations (Figure S5B).
How do the correlations affect the occurrences of motifs? To address this question, we use a mathematical model that assumes that correlations and heterogeneity in connectivity can be expressed by a single parameter, (Macke et al., 2011). We provide a comprehensive description of the mathematical model in the STAR Methods. The mathematical model yields motif occurrences that match those in random networks only when correlations are absent (i.e., ; Equations 5 and 6 in the STAR Methods). In turn, in the presence of correlations, the mathematical model allows us to explore how sparsity and heterogeneity in connectivity affect in principle motif occurrences. For example, in sparsely connected networks (e.g., mean connection probability of 10%) feedforward motifs become increasingly under-represented with increasing heterogeneity (Figure S5C). Conversely, in densely connected networks (e.g., a mean of 90%) such motifs become increasingly over-represented with increasing heterogeneity. Recurrent loops are always over-represented in the presence of correlations, and this over-representation increases the sparser and the more heterogeneous a network is connected (Figure S5C).
We test whether correlations, in conjunction with sparsity and heterogeneity, can explain the specific nonrandom network configurations that emerge from the barrel cortex model. We illustrate these quantifications for excitatory neurons in layer 5 (Figure 4A). Approximately 80% of these neurons represent intratelencephalic pyramidal neurons (L5ITs), L5PTs, or L6CCs (Figure 4B). We, therefore, analyze the pairwise and higher-order statistics with respect to these cell types (Figure 4C). Although neuron somata from all of these cell types intermingle, the shapes of the respective connection probability distributions differ substantially. For example, L5ITs connect more densely and less heterogeneously to L5PTs than L5PTs connect to one another (Figure 4D). Within the population of L5PTs, the shapes of connection probability distributions differ substantially, depending on how far apart their somata are (Figure 4D). Thus, in any network configuration, the degrees of sparsity and heterogeneity in connectivity will reflect the locations of the neurons’ somata and their respective cell types (Figure S6A).
Figure 4.

Three morphology-related factors translate into network architecture
(A) We illustrate the impact of neuron morphology on network architecture for EXC neurons in layer 5 of the C2 barrel column.
(B) Zoom-in shows somata colored by their respective cell type.
(C) Part of the matrix representation of the networks from Figure S3A that represents the neurons shown in (B).
(D) Distributions of connection probabilities from the matrix in (C) for different cell type combinations. (Bottom) Connection probability distributions between L5PTs for different inter-somatic distances.
(E) In-degree distributions derived from the matrix in (C). The numbers of incoming connections that L5PTs receive from one another correlates with those they receive from L6CCs.
(F) Motif occurrences in networks from the barrel cortex model versus those in random networks depend on the in-degree correlation coefficients, the means and CVs of the corresponding connection probability distributions. Circles represent more than 200 groupings of neurons with different cell type combinations (e.g., those in [D]).
(G) Nonrandom motif occurrences for the groupings in (F) are consistent with the mathematical model.
We find substantial correlations in pairwise connectivity. For example, L5PTs receive more connections from one another the more connections they receive from L6CCs (Figure 4E). These in-degree correlations emerge when the axons of two neurons jointly overlap with the dendrites of another neuron. The greater the number of joint overlap volumes—and of presynaptic sites therein—the greater the probability that both axons connect to the dendrites of the same neuron. An analysis of the ensemble reveals that, in any network configuration, correlations in connectivity are present and that the strengths of these correlations reflect how similar the neurons’ projection patterns are (Figure S6B)—i.e., the more similar the projection patterns, the more similar are the overlap patterns. For example, despite substantial differences between L5PTs and L6CCs, the axons of both populations predominantly project to the deep layers, where they span horizontally across several barrel columns (Narayanan et al., 2015). In contrast, L5IT axons predominately project to the upper layers and remain confined to a barrel column in the deep layers. As a result, in-degree correlations are weaker between L5ITs and the other two cell types (Figure S6C).
We generalize our observations to all neurons in the barrel cortex model. For this purpose, we quantify the respective means, CVs, and correlations of connection probability distributions for more than 200 groupings that represent populations of different cell type combinations (Figure 4F). For any of the groupings, correlations are present and motif occurrences deviate from those in random networks. The sparser and the more heterogeneous neurons connect to one another within a group, the more over-represented are recurrent connections between them. Conversely, the more densely neurons connect to one another, the more under-represented are feedforward connections. These relationships are consistent with the respective predictions of the mathematical model (Figure 4G). Thus, the nonrandom architectures of neuronal networks reflect the specific morphological properties of their constituents because of the impact of morphology on correlations, sparsity, and heterogeneity in pairwise connectivity.
Principles linking neuron morphology to network architecture
We reveal four principles by which the neurons’ morphologies impact network architectures. First, the vast majority of neurons whose axons and dendrites overlap remain unconnected. As a result, the more axon-dendrite branch pairs are packed into the neuropil relative to the number of synapses they can form, the smaller the probability that their respective pre- and postsynaptic sites connect to one another. Thus, the packing density of the neuropil translates into the means of connection probability distributions, and thereby defines a networks’ sparsity (Figure 5A). Second, the greater the cellular diversity, the broader are the distributions of connection probabilities. Thus, cellular diversity translates into the CV of connection probability distributions, and thereby defines a network’s heterogeneity (Figure 5B). Third, the more similar the projection patterns of the neurons are, the more similar are their respective overlap patterns across subvolumes. Thereby, similarities in the neurons’ projection patterns translate into correlations between connection probability and degree distributions (Figure 5C). Fourth, because of these correlations, the degrees of sparsity and heterogeneity define a network’s specific nonrandom topology. High packing density and high cellular diversity, for example, as in the cerebral cortex, thereby yield recurrent network architectures (Figure 5D). Tissue with a low packing density and a low cellular diversity yields feedforward architectures.
Figure 5.

Principles linking neuron morphology to network architecture
(A) The packing density of the neuropil translates into the means of connection probability distributions, and thereby defines a networks’ sparsity.
(B) The cellular diversity translates into the widths of connection probability distributions, and thereby defines a network’s heterogeneity.
(C) Similarities in dendrite and axon projection patterns translate into similar overlap patterns, which result in correlations of connection probability and degree distributions.
(D) In the presence of correlations, the degrees of sparsity and heterogeneity define a network’s specific nonrandom topology. Feedforward motifs become increasingly over-represented the denser and the more homogeneously neurons are connected (i.e., low packing density and low cellular diversity). Conversely, recurrent motifs become increasingly over-represented the sparser and the more heterogeneously neurons are connected.
Neuron morphology predicts empirically observed wiring specificity
How strong is the impact of neuron morphology on network architecture? Here we can address this question, because the ensemble of network configurations provides a null hypothesis for testing to what degree empirically observed wiring specificity requires specific synapse formation mechanisms. For this purpose, we compare the connectivity patterns predicted here with a rich body of literature that represents several decades of connectivity measurements by different laboratories. First, we test the predicted relationship between packing density and sparsity in connectivity. We generate 500,000 μm³ subvolumes in layer 4 of the barrel cortex model (Figure S2C), analogous to dense reconstructions in the mouse barrel cortex (Motta et al., 2019). On average, these subvolumes comprise more than 108 axon-dendrite pairs. The vast majority of these branch pairs remain unconnected in any network configuration (Figure 6A), while approximately 105 are connected by a single synapse, approximately 4,000 by two synapses, approximately 150 by three synapses, and approximately 20 by four or more synapses (Figure 6B). These predictions for both the packing density (Figure S2D) and the resulting connectivity patterns are consistent with the empirical observations (Motta et al., 2019).
Figure 6.

Predicted versus empirical connectivity data
(A) Predicted occurrences of unconnected branch pairs per 500,000 μm³ large subvolumes in layer 4 of the rat barrel cortex model (n = 252).
(B) Occurrences of branch pairs connected by one or more synapses (min/median/max) for the same subvolumes as in (A) match with empirical data from mouse barrel cortex (1 (Motta et al., 2019)).
(C) Predicted connection probabilities match those of four example studies (2 [Bruno and Sakmann, 2006]; 3 [Sun et al., 2006]; 4 [Yoshimura et al., 2005]; 5 [Perin et al., 2011]). (Left) Mean ± STD. (Right) Box plots represent median, and 25th and 75th percentiles.
(D) Empirical connection probabilities for 89 layer and/or cell type groupings versus the respective means predicted here (Table S1). Gray shading represents 95% prediction interval. Asterisks denote inconsistencies with empirical data.
(E) Predicted nonrandom motif occurrences between L5PTs (mean) match with the empirical data (6 [Song et al., 2005]). As reported by Song et al. (2005), we normalized the triplet ratios by the predicted occurrences of doublet motifs (inset). The Y axis in log scale. Error bars for the predictions represent the range across models.
(F) Over-representation of motifs between eight L5PTs increases with the number of connected neurons empirically (5 [Perin et al., 2011]) and in the barrel cortex model.
Second, we test the predicted relationship between cellular diversity and heterogeneity in connectivity. For this purpose, we group neurons analogous to measurements that sampled connectivity between neuron pairs depending on their soma locations within a particular layer, cell types, inter-somatic distances, or combinations thereof (Figure 6C). In total, we predict the pairwise connectivity for 89 such samplings that reflect different locations and/or cell types and compare those with the respective empirical data reported across a set of 29 studies (Tables S1, S2, and S3). The predicted connection probabilities correlate significantly with the empirical data (R = 0.75; p < 10−16). Approximately two-thirds of the empirical connectivity values deviate from the prediction by less than half a standard deviation of the respective connection probability distribution, 94% by less than one standard deviation (Figure 6D). Random permutations of the predicted connection probabilities yield correlations with the empirical data that are not significant (R = 0.00 ± 0.11).
Finally, we test the predicted nonrandom occurrences of motifs. The occurrences of motifs and their respective deviations from a random network were systematically assessed for triplets of L5PTs (Song et al., 2005). The barrel cortex model predicts nonrandom motif occurrences for this cell type that are consistent with these empirical data, with the notable exception of the feedforward loop and the recurrent feedback motifs (Figure 6E). Moreover, probing the occurrences of motifs between up to eight L5PTs revealed that, independent of their particular topology, motifs become increasingly over-represented with increasing numbers of connected neurons (Perin et al., 2011). This relationship is qualitatively consistent with our predictions (Figure 6F). Thus, the barrel cortex model predicts the observed occurrences of clusters of synapses, layer-, cell type- and distance-specific connectivity, and over- or under-representation of motifs. Consequently, such wiring specificity can emerge in cortical networks from the neurons’ morphological properties, even if synapse formation mechanisms that introduce wiring specificity were absent.
Outlook: Disentangling sources of wiring specificity in dense connectomics data
We apply our statistical approach to an electron microscopy reconstruction of 1 mm3 of the human cortex (Shapson-Coe et al., 2021). We analyze this petascale connectomics dataset in its preliminary form, which, however, reflects the current state-of-the-art for dense reconstructions of cortical tissue. We divide the dataset into small subvolumes and split all synaptic connections therein into pre- and postsynaptic sites along the axons and dendrites, respectively (Figure 7A). Analogous to the analysis of our barrel cortex model, we derive all network configurations that can emerge from the hence quantified projection patterns, packing density, and cellular diversity of the neuropil and calculate how likely these configurations are to appear in the absence of synapse formation mechanisms that introduce wiring specificity (Figure 7B). The resulting ensemble of networks for this fragment of human cortex predicts nonrandom topologies that are consistent with the current stage of reconstruction (Figure 7C). Interestingly, the predicted occurrences of the feedback motif deviate from the reconstruction for some of the layer-specific groupings of pyramidal neurons (Figure 7D). These observations illustrate that our statistical approach sets the stage to disentangle whether wiring specificity in dense connectomics data could reflect the specific morphologies of the neurons (i.e., consistent with the prediction), or specific synapse formation mechanisms (i.e., inconsistent with the prediction).
Figure 7.

Disentangling sources of wiring specificity in dense connectomics data
(A) Current stage of the dense electron microscopy reconstruction of one cubic millimeter of human cortex, as recently reported (Shapson-Coe et al., 2021). We colored the reconstructed neuron morphologies by their laminar soma locations and putative morphological cell types (analogous to Figure S1). Zoom-in shows three examples of layer 5 pyramidal neurons (L5PY). The electron microscopy image shows one synapse between the example neurons. We split all reconstructed synapses in this dataset into presynaptic (i.e., boutons) and postsynaptic sites (e.g., spines).
(B) We divide the dense dataset into small subvolumes, count the pre- and postsynaptic sites along axons and dendrites therein, and generate the different network configurations, which can account for them. We illustrate the resulting networks for the example neurons from (A). Arrows denote the likelihoods that e.g., Cell i is connected by at least one synapse to the dendrites of Cell j within one of their overlap volumes (i.e., in 10% of the network configurations).
(C) Predicted nonrandom motif occurrences between the 200 most connected neurons per layer match with the dense reconstructions. Error bars represent standard deviations across layers. Note: we did not observe motif 1 in the dense reconstruction of the inspected samples.
(D) Predicted nonrandom occurrences of triplet motifs for the 50, 100, 150, and 200 most connected pyramidal neurons per layer are consistent with the dense reconstructions (left), except for the feedback motif (right).
Discussion
We use a statistical approach to reveal how the neurons’ morphologies impact the architecture of the networks they form. We consider the overlap between dendritic and axonal projections patterns, as well as the packing density and cellular of diversity of the neuropil. We find four principles by which these three morphology-related factors translate into nonrandom pairwise and higher-order connectivity patterns. Such wiring specificity is considered to reflect specific synapse formation mechanisms (e.g., molecular recognition of cell type and activity). This interpretation is due to the assumption that the impact of neuron morphology on connectivity can be assessed by testing Peters’ rule (Braitenberg and Schüz, 1991). According to this hypothesis, axons form synaptic connections randomly wherever they get in close proximity with a dendrite (Peters and Feldman, 1976). Axo-dendritic overlap would hence not only be necessary—as assumed here—but sufficient to account for connectivity. Consequently, Peters’ rule can be simply restated as “overlap predicts connectivity.” However, here we demonstrate that axo-dendritic overlap could predict connectivity in principle for only a very small minority of the branch pairs. Thus, testing of Peters’ rule is not equivalent to testing the impact of neuron morphology on network architecture. Consequently, observations that violate Peters’ rule do not provide sufficient evidence to conclude that such wiring specificity reflects specific synapse formation mechanisms. Our findings now set the stage to disentangle morphological from synaptic origins of wiring specificity by applying our statistical approach to dense reconstructions of sufficiently large brain volumes (Figure 7).
We predict connectivity patterns from subcellular to network scales that are in agreement with those observed empirically. This consistency raises the question, which synapse formation mechanisms could implement such strong relationships between neuron morphology and network architecture. Our assumption that all possible connections within a subvolume of the neuropil are equally likely is consistent with nonspecific synapse formation mechanisms, for example, that axons compete with one another to connect to the available postsynaptic sites. Such mechanisms represent a prominent wiring strategy during the development of the peripheral (Lanuza et al., 2018; Turney and Lichtman, 2012) and central nervous systems (Penn et al., 1998). It is hence tempting to speculate that neuron morphology development, in conjunction with competitive synapse formation mechanisms, establishes a scaffolding of wiring specificity in the architectures of cortical networks (Zador, 2019). Consistent with theoretical considerations (Koulakov et al., 2021), we therefore propose that the emergence of wiring specificity via neuron morphology development may reflect an efficient evolutionary strategy to maintain cortical network architectures across generations while providing sufficient flexibility for invading new ecological niches (Catania, 2017).
The impact of neuron morphology on cortical networks might diminish throughout life. Consistency with the empirical data could thereby reflect the fact that connectivity measurements in the literature originated largely from young animals. This possibility is supported by dense reconstructions of the nematode C. elegans, which recently revealed that the neuropil structure of its nervous system provides a constant scaffolding on which connectivity is remodeled from birth to adulthood (Cook et al., 2020). Interestingly, some morphologically determined connectivity patterns were maintained throughout life. This may also apply to the cerebral cortex, as its proper function is critically linked to two network properties that we find are strongly impacted by morphology: heterogeneity and correlations in connectivity (Landau et al., 2016). Consequently, to ensure the robustness of cortical dynamics, homeostatic mechanisms may maintain morphologically determined wiring specificity, despite the constant remodeling of cortical networks. Our findings and statistical approach will allow testing whether the impact of neuron morphology on cortical network architecture decreases or is maintained during maturation.
Limitations of the study
We emphasize that our findings do not imply that the impact of specific synapse formation mechanisms on wiring specificity is negligible. For example, the respective occurrences of motifs 7 and 9 in the barrel cortex (Figure 6E), and of motif 11 in the human cortex (Figure 7D) cannot be explained by the morphological properties of the neurons. Moreover, we do not evaluate the spatial distributions of synaptic connections along the entire dendrite morphologies of the neurons. Recent work demonstrated that axons can target specific dendritic subdomains of particular cell types (Guest et al., 2022; Karimi et al., 2020)—observations that are unlikely to emerge from neuron morphology. Finally, we do not systematically evaluate the connectivity patterns for different inhibitory cell types. Depending on their cell type, axons of inhibitory neurons can preferentially target specific other cell types and specific subcellular compartments (reviewed in Kubota, 2014). Testing the degrees to which the morphologies of inhibitory neurons impact network architectures would hence require incorporating the target specificity of different inhibitory cell types into our statistical approach when generating the network configurations. For now, however, the relationships between morphology and target specificity of inhibitory neurons are not fully resolved. Thus, here we limit our analysis to excitatory intracortical and thalamocortical connections for which empirical connectivity data is available. Online at https://cortexinsilico.zib.de/, we provide access to the predicted connectivity patterns between the neurons in all layers of the barrel cortex (e.g., motif occurrences), which will allow testing their significance once the respective empirical connectivity data becomes available.
STAR★Methods
Key resources table
| REAGENT or RESOURCE | SOURCE | IDENTIFIER |
|---|---|---|
| Deposited data | ||
| Raw and analyzed data | This paper | CortexInSilico: https://cortexinsilico.zib.de/download |
| Analysis routines | This paper | GitHub: https://github.com/zibneuro/udvary-et-al-2022 |
| Archived version of code | This paper | Zenodo: https://doi.org/10.5281/zenodo.6344508 |
| Software and algorithms | ||
| Amira | FEI | ≥2019.2 |
| NeuroNet (Amira plugin) | Egger et al., 2014 | https://www.zib.de/software/neuronet |
| CortexInSilico | This paper | https://cortexinsilico.zib.de/ |
| MATLAB | https://de.mathworks.com/ | R2020b |
| Python | https://www.python.org/ | 3.6.10 |
| C++ | https://isocpp.org/ | C++03 |
| Other | ||
| Human Cortex Dataset | Shapson-Coe et al., 2021 | https://h01-release.storage.googleapis.com/data.html |
Resource availability
Lead Contact
Further information and requests for resources should be directed to and will be fulfilled by the Lead Contact, Marcel Oberlaender (marcel.oberlaender@mpinb.mpg.de).
Materials availability
This study did not generate new unique reagents.
Method details
Structural model of rat barrel cortex
NeuroNet
We reverse engineered the structural composition of the neuropil for the rat barrel cortex by using NeuroNet, a custom-designed extension package for Amira software (FEI). NeuroNet was described in detail previously (Egger et al., 2014). NeuroNet requires the following anatomical data as input: (i) a reconstruction of the three-dimensional (3D) geometry and cytoarchitecture for the cortical volume of interest, (ii) a spatially dense reconstruction of the distributions of excitatory (EXC) and inhibitory (INH) neuron somata within the volume, (iii) samples of in vivo labeled dendrite and axon reconstructions that represent neurons from all layers and for all major morphological cell types (Figure S1A), and (iv) cell type- and target layer-specific measurements for the densities of pre- and postsynaptic sites along these axons and dendrites, respectively. The output by NeuroNet is a digital model of the cortical volume (Egger et al., 2020), where each soma is represented by one axon and dendrite from the sample of morphologies. The model hence provides quantitative estimates for the spatial distributions of all neurons, and their dendrites and axons—including the distributions of pre- and postsynaptic sites along them (Narayanan et al., 2017).
Anatomical input data
All anatomical data used here as input for NeuroNet was acquired in Wistar rats, primarily during the fifth postnatal week after the critical periods of neuron morphology development and has been reported previously. To capture the characteristic geometrical, cytoarchitectonic, and cellular organization of the rat barrel cortex in the model, we reconstructed precise 3D maps of cortical barrel columns with surface reconstructions of the pia and white matter (Egger et al., 2012), and quantified the locations of all EXC and INH neuron somata in the rat barrel cortex and in VPM thalamus (Meyer et al., 2013). To capture the cell type-specific morphological organization of the rat barrel cortex in the model, we reconstructed a sample of in vivo-labeled EXC neuron morphologies (De Kock et al., 2007; Narayanan et al., 2015; Oberlaender et al., 2012a) and the intracortical part of in vivo-labeled VPM axon morphologies (Oberlaender et al., 2012b). NeuroNet replaced each neuron of the reconstructed distribution of EXC somata with a morphology from this sample of reconstructions. The neurons’ locations in the model were on average within ±119 μm of their reconstructed 3D soma positions within the barrel cortex (Egger et al., 2012). We placed as many thalamocortical axons as the average measured number of neurons per respective VPM barreloid. To account for EXC connections onto INH neurons, we incorporated reconstructions of INH neurons into the model (Arzt et al., 2018; Helmstaedter et al., 2009; Koelbl et al., 2015; Egger et al., 2015). For in vitro-labeled INH neurons, morphologies were extrapolated by assuming radial symmetry. Connections from or onto INH neurons were hence not systematically analyzed. We derived the number of presynaptic sites (i.e., axonal boutons) by multiplying the axon length that each neuron contributes to a particular subvolume with the number of boutons per length (Egger et al., 2014), as measured for all EXC cell types and layer 1 INH neurons, and depending on the axons’ target layer (Egger et al., 2015; Narayanan et al., 2015). For all remaining INH neurons, we set the density to 0.2 boutons per μm axon as reported elsewhere (Karube et al., 2004; Markram et al., 2004; Wang et al., 2002). Based on the resulting density distribution of boutons along the cortical depth, we scaled the total number of postsynaptic sites along the dendrites. More specifically, we performed the scaling separately for the targets of boutons from EXC and INH axons. First, for targets of EXC boutons, we derived the number of postsynaptic sites along EXC dendrites (i.e., spines) by assuming that spine densities are proportional to dendritic length. For the respective number of postsynaptic sites along INH dendrites and somata, we assumed proportionality to their respective surface areas. The derived density of postsynaptic sites for EXC neurons ranged from 1.04 to 1.68 spines per μm dendritic length, consistent with empirical spine density measurements (Larkman, 1991; Kawaguchi et al., 2006). The derived density of postsynaptic sites for INH neurons was 0.74 per μm2 of dendritic or somatic surface, consistent with empirical synapse density measurements on INH somata (Keller and White, 1987; Ahmed et al., 1997). Second, for targets of INH boutons, we derived the number of postsynaptic sites along both EXC and INH dendrites and somata by assuming proportionality to their respective surface areas. The derived density of postsynaptic sites for EXC and INH neurons was 0.06 per μm2 of dendritic and somatic surface, consistent with empirical data (Ahmed et al., 1997; Keller and White, 1987; White et al., 1984).
Validation of the barrel cortex model
We tested how representative the 3D projection patterns of our sample of EXC axon and dendrite morphologies is. First, we aligned the dendrite morphologies of each cell type by their lateral soma position and calculated dendrite innervation volumes at a 50 μm resolution for an increasing sample of morphologies (Figure S1B). For each cell type and sample size, we calculated the differences between the respectively determined innervation volumes and that innervated by all morphologies for this type. Second, we determined the respective dendrite length contribution per subvolume of each combination of morphologies. For each sample size of morphologies, we calculated the CV of the dendrite length per subvolume across all possible combinations (Figures S1C and S1D). We repeated the same analysis for axons without alignment by somata. We tested whether the barrel cortex model provides realistic estimates for the packing density and cellular diversity of the neuropil. We, therefore, compared the model prediction with empirical data (Braitenberg and Schüz, 1998; Motta et al., 2019; Santuy et al., 2018; Chandrasekaran et al., 2015) (Figures S2B–S2E). To test the robustness of the packing density and cellular diversity, we created more than 30,000 barrel cortex models with different anatomical data as input. We then quantified the variability across models for 512 (50 μm)³ large subvolumes within the C2 barrel column—i.e., axonal and dendritic path length, number of branches, number of branches that remain unconnected to a soma within the same subvolume, number of boutons, number of contributing cells and cell types, and path length to the soma from each branch (Figures S2D–S2F). First, we assessed how the limited sample size of morphology reconstructions affects these quantities. We generated barrel cortex models where only one morphology per cell type, two morphologies, and so on were used as input. Starting with one morphology per type, we used a random sample of 500 combinations of morphologies as input to generate 500 models. All models were based on the same distribution of neuron somata (i.e., average across four barrel cortices (Meyer et al., 2013)). For each subvolume, we determined the CV of each quantity across the 500 models. We then calculated the median CV of each quantity across all subvolumes (Figure S2G). We repeated this analysis for two morphologies per cell type and so on until the maximal sample size was reached, respectively. Second, we assessed how the variability of soma distributions across animals affects these quantities. We repeated the analysis with models that were based on each of the four measured soma distributions, respectively (Meyer et al., 2013). We again calculated the median CV of each quantity across all subvolumes (Figure S2G).
Generation of networks
First, we calculated the dense structural overlap (DSO) as the product of the numbers of pre- and postsynaptic sites that neurons i and j contribute to a subvolume x, relative to the total number of postsynaptic sites contributed by all neurons in the barrel cortex model, here indexed with N.
| (Equation 1) |
Based on this quantity, we assume that any presynaptic site has equal probability of forming a connection with any of the allowed postsynaptic sites within the same subvolume. The probability p for the presence of n connections between neurons i and j within a subvolume x across all networks is therefore given by a Poisson distribution with parameter n:
| (Equation 2) |
We assume that the formation of connections does not affect synapse formation elsewhere. Thus, the probability P that neurons i and j are connected by at least one synapse across all networks is given by:
| (Equation 3) |
where the index k runs over all subvolumes in which neurons i and j overlap. Parameterizing the subvolumes of the barrel cortex model by the quantity DSO, followed by application of Equations 2 and 3, yielded the networks that we analyzed here. We analyzed networks generated for cubic subvolumes with 50 μm edge length unless stated otherwise (e.g., Figure 2).
Mathematical model for networks with correlations
We consider our ensemble of networks as a distribution of pairwise connection probabilities pi that generates network configurations. Suppose that K connections are drawn from any such generating distribution , where and represent the mean (i.e., sparsity) and variance (i.e., heterogeneity) of the pairwise connectivity in the corresponding networks. If each of the K connections is drawn independently, the probability of observing for example recurrent loops (motif 1) is accordingly the expected value of :
| (Equation 4) |
Thus, when connection probabilities are independent of one another, motifs will occur as expected for randomly connected networks—i.e., occurrences are independent from the network’s heterogeneity and only reflect the mean of the underlying pairwise statistics. Consequently, our observations of nonrandom occurrences of motifs, and their dependencies on network heterogeneity, cannot be consistent with the assumption that connection probabilities are independent of one another. Instead, only correlations in the networks could explain our observations. We therefore investigated how the presence of correlations affects the occurrences of motifs. For this purpose, we developed a mathematical model for correlated connectivity that is closely related to the one studied in (Macke et al., 2011). In the following, denotes a Gaussian distribution with mean and variance , denote the respective Gaussian probability density function evaluated at t, denotes the respective cumulative probability density function evaluated at , and the complementary cumulative probability density function is defined by . For simplicity, the mathematical model assumes that whether there is an i-th edge between two nodes (denoted by Xi = 1, otherwise Xi = 0) is the result of a combination of only one “private” source Ti, and one “shared” source S. The larger the shared source S is relative to the private one Ti, the more correlated the resultant connection probabilities are. Here we found that such shared sources could originate from similarities in the neurons’ locations and morphologies. The more similar the dendrite or axon projection patterns of neurons are, the more similar are their respective contributions to the structural composition of the neuropil across subvolumes, which leads to correlations between connection probability and degree distributions. The mathematical model could be easily generalized by incorporating more than one shared source (e.g., one for each cell type combination). The mathematical model has two parameters: , bounded between 0 and 1, and representing the magnitude of the shared source, and thus the degree of correlation in the sources. As we will demonstrate in the following, also determines the heterogeneity of connection probabilities—the larger is the more heterogeneous are the connection probabilities. The parameter represents the degree of connectivity—the greater is the higher are the connection probabilities. We define that the i-th edge exists (i.e., Xi = 1) whenever the joint input of Ti and S, denoted by Zi, is larger than 0:
where
where
Thus, . If , Xi is only determined by the shared source S, while if , Xi is only determined by the private source Ti. Given this mathematical model, the connection probability pi for each edge Xi is given by:
And we likewise get
Deriving the covariance between any two connections Xi and Xj yields:
Thus, in the mathematical model the covariance of the connections is equal to the variance of connection probabilities—the more strongly the connection probabilities vary, the more strongly the connections themselves are correlated. Hence, the parameter represents a measure of both, the degree of correlation and heterogeneity. To assess the impact of and the mean connection probability onto motif occurrences and deviations, the probability that k out of K connections of a motif are realized is given by:
| (Equation 5) |
The probability of observing recurrent loops (K = k) is accordingly:
| (Equation 6) |
This mathematical model was implemented as a numerical simulation in Matlab. We iterated over 250 -values ranging from −2 to 2 and 250 -values ranging from 0 to 1. Per combination of and values, 10 trials, each with 100,000 random samples, were generated. For each trial, the mean and variance across the connection probabilities pi (i.e., and ), the probability of each triplet motif with (i.e., maximal number of edges in a triplet), and the respective probability expected in random network based solely on was calculated.
The details of the mathematical model for one trial are below.
Algorithm 1. Mathematical model of correlated connectivity.
Input: simulator with degree of correlations and heterogeneity and degree of connectivity randomly initialize shared source .
// is a vector of connection probabilities
// E denotes the expected value
// Var denotes the variance
// maximal number of edges in a triplet
for k = 0 to K do
// probability of triplet motif with edges
// probability of triplet motif with edges in random network
return, , ,
The deviation of motif occurrences from a random network of each triplet motif was the ratio between the means of the motif probabilities across all trials. The deviations were mapped on a grid spanned by 20 -values (i.e., sparsity) and 20 -values (i.e., correlations and heterogeneity) and visualized by a log-space color map (Figure S5C). Each of the 220 cell type-specific triplet combinations was mapped into the grid space (Figure 4G). Specifically, we inferred for each combination its respective -value based on the variance and mean of the connection probabilities of each combination (Figure 4F) and a lookup table of , , and -values as determined by the numerical simulation.
Quantification and statistical analysis
We used custom-written routines in C++, Python, or MATLAB 2020b software (Mathworks, Natick, MA) for analysis and Amira software for visualization. Boxplots were generated with the Matlab built-ins boxplot or boxchart where the bottom and top of the box represents the 25th and 75th percentiles, and the line within the box the median. The lines extend to the adjacent values. Outliers are all values more than 1.5 times the interquartile range away from the top or bottom of the box.
Connectivity analyses in the barrel cortex model
We restricted our analysis to layers 2 to 6 within the C2 barrel column. Within that volume, we calculated the number of boutons and branch pairs that form zero to eight or more synapses per (50 μm)³ large subvolumes (n = 512). We repeated this analysis for 512 subvolumes with 1, 5, 10, and 25 μm edge lengths and for 64 subvolumes with 100 μm edge length. At the 1 μm edge length, we excluded 229 subvolumes where either no axon or no dendrite were present. At the cellular level, we restricted our analysis to a combination of approximately 400 million neuron pairs. For each pair, we determined the number of (50 μm)³ large subvolumes with axo-dendritic overlap, referred to as . We then calculated in how many networks the pair forms zero to noverlap synapses across all subvolumes. The resulting occurrences represent an upper bound since we constrained the overall number of connections and not the number of connections per subvolume. We mapped the number of connections per pair on bins of 1% width ranging from 0% (no connection between pair) to 100% (as many connections as noverlap). Finally, we determined the average number of occurrences across all pairs per bin. The resulting profile was smoothed with a moving median for visualization purposes. We determined how many of approximately 400 million pairs overlap at 1, 5, 10, 25, and 100 μm edge length and how often those were connected in the barrel cortex model.
We used the Matlab built-in digraph to illustrate network configurations for 50 neurons as a graph. The edges between the neurons were realized based on their predicted connection probability. We constrained each configuration to have the same number of edges. We generated the random network example by randomly assigning the same number of edges to 50 neurons. To analyze network topologies, we calculated the occurrence probability of each of the 15 motifs for a set of 8 million randomly selected neuron triplets, with each neuron belonging to a particular neuron population (e.g., neurons were grouped by their cell type or soma position in a layer). We calculated the mean probability of the occurrences for each motif as predicted for the barrel cortex model and compared it with those expected in a random network. First, we calculated the mean connection probabilities for each of the six edges between all of the sampled neurons. Second, we used these six mean connection probabilities to calculate the occurrence probability of each motif. Third, we divided the predicted motif probabilities by their respective expected probabilities in the random network. We calculated the deviation of motif occurrences of all 15 motifs for all 220 cell type-specific triplet combinations. For each triplet combination, we calculated the mean and CV of their connection probability distribution across all six edges. For triplets with neurons from at least two different cell types (n = 210), we also calculated the mean across all in-degree correlation coefficients involving these cell types. We extended our analysis to motifs between more than three neurons. We computed the probabilities of motif 1 (recurrent loop) and 13 (feedforward chain) for up to 10 neurons. For this purpose, we randomly sampled sets of neurons per motif size (10 million for each motif) from the barrel cortex model (i.e., 3 to 10) and computed the occurrence probabilities, respectively. We then compared the respective probabilities with those computed in random networks based on the mean connection probability across all neurons of the sample. We computed the mean, standard deviation, and CV of the connection probabilities between all groupings. We assessed correlations between neurons by calculating the number of incoming edges nEDGES between presynaptic neurons i (including those from VPM) and postsynaptic neurons j by summing their respective DSO across all overlapping subvolumes x:
| (Equation 7) |
We grouped all pre- and postsynaptic neurons by their cell type identity, and summed nEDGES(i, j) across each presynaptic population. This resulted in the mean number of connections (i.e., in-degree) each postsynaptic neuron j receives from this population across networks. We computed a linear regression fit and Pearson's linear correlation coefficient between the in-degrees of two different presynaptic populations onto all neurons per postsynaptic cell type. We repeated this computation for all combinations of presynaptic cell types.
Comparison with empirical connectivity data
We calculated the occurrences that two branches form zero, one, two, three, and (at least) four synapses for all branch pairs for a sample of 252 subvolumes of 100 × 100 × 50 μm³ in layer 4 for comparison with the empirical data reported for layer 4 of mouse barrel cortex (Motta et al., 2019). We compared our predictions with 89 empirical connection probability measurements reported across a set of 29 studies (Avermann et al., 2012; Bannister and Thomson, 2007; Beierlein and Connors, 2002; Beierlein et al., 2003; Brown and Hestrin, 2009; Bruno and Sakmann, 2006; Bruno and Simons, 2002; Constantinople and Bruno, 2013; Crandall et al., 2017; Feldmeyer et al., 1999, 2002, 2005, 2006, Hofer et al., 2011; Holmgren et al., 2003; Jiang et al., 2015; Jouhanneau et al., 2015, 2018; Krieger et al., 2007; Lefort et al., 2009; Markram et al., 1997; Mercer et al., 2005; Perin et al., 2011; Petersen and Sakmann, 2000; Silberberg and Markram, 2007; Song et al., 2005; Sun et al., 2006; Thomson et al., 2002; Yoshimura et al., 2005). We emulated the respective experimental conditions in the barrel cortex model. For empirical data from in vitro studies, we created twenty virtual brain slices of 300 μm thickness through the barrel cortex model. The slices were shifted by 20 μm with respect to one another along the rostrocaudal axis. We truncated the axons and dendrites of all neurons whose somata were located within each slice (i.e., we cut branches at their intersection with the slice surface, and removed those branches from the model that became disconnected from the soma). We computed the connection probabilities between each neuron pair in the virtual slices as defined by (Equation 1), (Equation 2), (Equation 3) with the quantity DSO being the contribution of pre- and postsynaptic sites by the truncated pairs’ morphologies with respect to the total number of postsynaptic sites contributed by all neurons. We grouped the neurons as described in the respective studies (Table S1); i.e., by their laminar soma location and—if reported—by their cell type. Layer borders were defined as reported previously (Meyer et al., 2013). If the recording depth underneath the slice surface was not reported, we restricted the comparison to pairs within the mean reported range of recording depths (31–130 μm). We computed the Pearson’s linear correlation coefficient between the empirical and predicted connection probabilities and the 95% confidence bounds for new observations based on a linear regression with no intercept using the Matlab built-ins fitlm and predict. We performed a random permutation test on the correlation coefficient by shuffling the empirical and the predicted connection probabilities and re-computing their correlation coefficient. We repeated this step 100,000 times. We compared the predictions with two empirical studies that performed connectivity measurements as a function of inter-somatic distance (Perin et al., 2011; Avermann et al., 2012) (Tables S2 and S3). Here, we grouped neurons additionally by their inter-somatic distance along the lateral axis (i.e., the axis running parallel to the slice surface). We compared the predicted deviations of motif occurrences across L5PT triplets and doublets with empirical observations (Song et al., 2005). We grouped the neurons accordingly and calculated the motif occurrences and ratios for approximately 1.7 million L5PT doublets and approximately 200,000 L5PT triplets across 20 slices through the barrel cortex model. We used the same analysis as reported by (Song et al., 2005) and normalized the resulting triplet ratios by the doublet motif occurrences to avoid over- or under-representation of triplet motifs due to over- or under-representation of doublet motifs. We compared the motif probabilities across the number of edges in motifs of eight neurons to empirical observations (Perin et al., 2011). For this purpose, we randomly sampled 20,000 sets of eight L5PTs across the 20 slices through the barrel cortex model. For each set of neurons and each number of edges (ranging from 0 to 56 edges), we computed the number of edge combinations (e.g., 1 combination is possible for 0 or 56 edges, but more than 1010 combinations are possible of 10 edges). If the number of edge combinations was less than 1,000, we iterated over all combinations. If the number of combinations was larger than 1,000, we randomly generated 1,000 motifs that matched the number of edges. We calculated the respective (occurrence) probability of each edge motif in the slices through the barrel cortex model and a random network constrained by the respective mean connection probability.
Connectivity analyses in the human cortex reconstruction
We downloaded the annotated synapse dataset released with the C3 segmentation (gs://h01-release/data/20210601/c3/synapses/exported/) and filtered it for synapses whose presynaptic site was an axon and whose postsynaptic site was either a dendrite, soma, or axon initial segment, resulting in 133,704,943 synapses as described in Shapson-Coe et al. (2021). We divided the dataset into subvolumes of (25 μm)³ and assigned each synapse to a subvolume based on its location. Then we split each synapse into a pre- and postsynaptic sites. The dataset contains 15,567 reconstructions annotated as a ‘neuron.’ For each pair of neurons, we calculated the quantity DSO of its EXC and INH synapses separately. We then summed the EXC and INH DSO for each neuron pair over all subvolumes and derived the ensemble of network configurations. We determined the 50, 100, 150, and 200 most connected neurons per layer. For each of these groupings, we determined how often each triplet motif occurred in the reconstructed dataset compared to a random network that has the same mean connection probability. We repeated this analysis for the ensemble of networks as well as for samples of pyramidal neurons (annotated ‘pyramidal’).
Acknowledgments
We thank Kevin Briggman, Peter Strick, Haim Sompolinsky, Idan Segev, and David Fitzpatrick for comments on the manuscript. Funding was provided by the Max Planck Institute for Neurobiology of Behavior – caesar, the Center for Neurogenomics and Cognitive Research, the European Research Council under the European Union’s Horizon 2020 research and innovation program (grant agreement 633428; to M.O.), the German Federal Ministry of Education and Research (grants BMBF/FKZ 01GQ1002 and 01IS18052; to M.O. and J.M.), and the Deutsche Forschungsgemeinschaft (SFB 1089 to M.O. and J.M.; and SPP 2041 to M.O., J.M., and H.H; and EXC number 2064/1, 39072764 to J.M.).
Author contributions
M.O. conceived and designed the study. D.U. generated the data and developed the analysis. P.H. and H.H. developed analysis routines and created the online resource. J.M. developed the mathematical model. C.K. and B.S. provided data. D.U., P.H., and M.O. analyzed the data, and M.O. and D.U. wrote the paper with help from all authors.
Declaration of interests
The authors declare no competing interests.
Published: April 12, 2022
Footnotes
Supplemental information can be found online at https://doi.org/10.1016/j.celrep.2022.110677.
Supplemental information
An asterisk (∗) after the reference denotes connectivity measurements within the septum; age is given in postnatal days; n denotes the number of pairs tested; P(A,B) denotes the connection probability of type A to type B, either measured or predicted (% of networks) as the mean or standard deviation (STD). Deviation between empirically observed and predicted connection probability: dev = (P(A,B) empirical – mean of P(A,B) predicted) / (STD of P(A,B) predicted). prctl denotes percentage of predicted connection probabilities that are lower or equal than P(A,B) empirical (e.g., prctl = 0: none of the predicted connection probabilities are lower or equal than P(A,B) empirical; prctl = 100: all predicted connection probabilities are lower or equal than P(A,B) empirical). Correlation between predictions and empirical data: R = 0.71 (p < 10−5, n = 32 for rat); R = 0.55 (p = 10−5, n = 57 for mouse).
Data and code availability
-
•
All original code is publicly available at GitHub: https://github.com/zibneuro/udvary-et-al-2022.
-
•
An archived version of record of the code is available at Zenodo: https://doi.org/10.5281/zenodo.6344508.
-
•
The model of the rat barrel cortex, the derived network configurations, the underlying morphological data, and all analysis routines are available online at CortexInSilico: https://cortexinsilico.zib.de/download.
-
•
Any additional information required to reanalyze the data reported in this paper is available from the Lead Contact upon request.
References
- Ahmed B., Anderson J.C., Martin K.A., Nelson J.C. Map of the synapses onto layer 4 basket cells of the primary visual cortex of the cat. J. Comp. Neurol. 1997;380:230–242. [PubMed] [Google Scholar]
- Arzt M., Sakmann B., Meyer H.S. Anatomical correlates of local, translaminar, and transcolumnar inhibition by layer 6 GABAergic interneurons in somatosensory cortex. Cereb. Cortex. 2018;28:2763–2774. doi: 10.1093/cercor/bhx156. [DOI] [PubMed] [Google Scholar]
- Avermann M., Tomm C., Mateo C., Gerstner W., Petersen C.C. Microcircuits of excitatory and inhibitory neurons in layer 2/3 of mouse barrel cortex. J. Neurophysiol. 2012;107:3116–3134. doi: 10.1152/jn.00917.2011. [DOI] [PubMed] [Google Scholar]
- Bannister A.P., Thomson A.M. Dynamic properties of excitatory synaptic connections involving layer 4 pyramidal cells in adult rat and cat neocortex. Cereb. Cortex. 2007;17:2190–2203. doi: 10.1093/cercor/bhl126. [DOI] [PubMed] [Google Scholar]
- Beierlein M., Connors B.W. Short-term dynamics of thalamocortical and intracortical synapses onto layer 6 neurons in neocortex. J. Neurophysiol. 2002;88:1924–1932. doi: 10.1152/jn.2002.88.4.1924. [DOI] [PubMed] [Google Scholar]
- Beierlein M., Gibson J.R., Connors B.W. Two dynamically distinct inhibitory networks in layer 4 of the neocortex. J. Neurophysiol. 2003;90:2987–3000. doi: 10.1152/jn.00283.2003. [DOI] [PubMed] [Google Scholar]
- Bennett S.H., Kirby A.J., Finnerty G.T. Rewiring the connectome: evidence and effects. Neurosci. Biobehav Rev. 2018;88:51–62. doi: 10.1016/j.neubiorev.2018.03.001. [DOI] [PMC free article] [PubMed] [Google Scholar]
- Berry K.P., Nedivi E. Spine dynamics: are they all the same? Neuron. 2017;96:43–55. doi: 10.1016/j.neuron.2017.08.008. [DOI] [PMC free article] [PubMed] [Google Scholar]
- Binzegger T., Douglas R.J., Martin K.A. A quantitative map of the circuit of cat primary visual cortex. J. Neurosci. 2004;24:8441–8453. doi: 10.1523/JNEUROSCI.1400-04.2004. [DOI] [PMC free article] [PubMed] [Google Scholar]
- Braitenberg V., Schüz A. Springer; 1991. Peters’ Rule and White’s Exceptions. Anatomy of the Cortex. [Google Scholar]
- Braitenberg V., Schüz A. Springer; 1998. Cortex: Statistics and Geometry of Neuronal Connectivity. [Google Scholar]
- Briggman K.L., Helmstaedter M., Denk W. Wiring specificity in the direction-selectivity circuit of the retina. Nature. 2011;471:183–188. doi: 10.1038/nature09818. [DOI] [PubMed] [Google Scholar]
- Brown S.P., Hestrin S. Intracortical circuits of pyramidal neurons reflect their long-range axonal targets. Nature. 2009;457:1133–1136. doi: 10.1038/nature07658. [DOI] [PMC free article] [PubMed] [Google Scholar]
- Bruno R.M., Sakmann B. Cortex is driven by weak but synchronously active thalamocortical synapses. Science. 2006;312:1622–1627. doi: 10.1126/science.1124593. [DOI] [PubMed] [Google Scholar]
- Bruno R.M., Simons D.J. Feedforward mechanisms of excitatory and inhibitory cortical receptive fields. J. Neurosci. 2002;22:10966–10975. doi: 10.1523/JNEUROSCI.22-24-10966.2002. [DOI] [PMC free article] [PubMed] [Google Scholar]
- Catania K.C. Behavioral pieces of neuroethological puzzles. J. Comp. Physiol. A. Neuroethol Sens Neural Behav. Physiol. 2017;203:677–689. doi: 10.1007/s00359-016-1143-7. [DOI] [PMC free article] [PubMed] [Google Scholar]
- Chandrasekaran S., Navlakha S., Audette N.J., Mccreary D.D., Suhan J., Bar-Joseph Z., Barth A.L. Unbiased, high-throughput electron microscopy analysis of experience-dependent synaptic changes in the neocortex. J. Neurosci. 2015;35:16450–16462. doi: 10.1523/JNEUROSCI.1573-15.2015. [DOI] [PMC free article] [PubMed] [Google Scholar]
- Constantinople C.M., Bruno R.M. Deep cortical layers are activated directly by thalamus. Science. 2013;340:1591–1594. doi: 10.1126/science.1236425. [DOI] [PMC free article] [PubMed] [Google Scholar]
- Cook S.J., Crouse C.M., Yemini E., Hall D.H., Emmons S.W., Hobert O. The connectome of the Caenorhabditis elegans pharynx. J. Comp. Neurol. 2020;528:2767–2784. doi: 10.1002/cne.24932. [DOI] [PMC free article] [PubMed] [Google Scholar]
- Crandall S.R., Patrick S.L., Cruikshank S.J., Connors B.W. Infrabarrels are layer 6 circuit modules in the barrel cortex that link long-range inputs and outputs. Cell Rep. 2017;21:3065–3078. doi: 10.1016/j.celrep.2017.11.049. [DOI] [PMC free article] [PubMed] [Google Scholar]
- De Kock C.P., Bruno R.M., Spors H., Sakmann B. Layer- and cell-type-specific suprathreshold stimulus representation in rat primary somatosensory cortex. J. Physiol. 2007;581:139–154. doi: 10.1113/jphysiol.2006.124321. [DOI] [PMC free article] [PubMed] [Google Scholar]
- Egger R., Dercksen V.J., Udvary D., Hege H.C., Oberlaender M. Generation of dense statistical connectomes from sparse morphological data. Front. Neuroanat. 2014;8:129. doi: 10.3389/fnana.2014.00129. [DOI] [PMC free article] [PubMed] [Google Scholar]
- Egger R., Narayanan R.T., Guest J.M., Bast A., Udvary D., Messore L.F., Das S., De Kock C.P.J., Oberlaender M. Cortical output is gated by horizontally projecting neurons in the deep layers. Neuron. 2020;105:122–137.e8. doi: 10.1016/j.neuron.2019.10.011. [DOI] [PMC free article] [PubMed] [Google Scholar]
- Egger R., Narayanan R.T., Helmstaedter M., De Kock C.P., Oberlaender M. 3D reconstruction and standardization of the rat vibrissal cortex for precise registration of single neuron morphology. PLoS Comput. Biol. 2012;8:e1002837. doi: 10.1371/journal.pcbi.1002837. [DOI] [PMC free article] [PubMed] [Google Scholar]
- Egger R., Schmitt A.C., Wallace D.J., Sakmann B., Oberlaender M., Kerr J.N. Robustness of sensory-evoked excitation is increased by inhibitory inputs to distal apical tuft dendrites. Proc. Natl. Acad. Sci. U S A. 2015;112:14072–14077. doi: 10.1073/pnas.1518773112. [DOI] [PMC free article] [PubMed] [Google Scholar]
- Feldmeyer D., Egger V., Lubke J., Sakmann B. Reliable synaptic connections between pairs of excitatory layer 4 neurones within a single 'barrel' of developing rat somatosensory cortex. J. Physiol. 1999;521:169–190. doi: 10.1111/j.1469-7793.1999.00169.x. [DOI] [PMC free article] [PubMed] [Google Scholar]
- Feldmeyer D., Lubke J., Sakmann B. Efficacy and connectivity of intracolumnar pairs of layer 2/3 pyramidal cells in the barrel cortex of juvenile rats. J. Physiol. 2006;575:583–602. doi: 10.1113/jphysiol.2006.105106. [DOI] [PMC free article] [PubMed] [Google Scholar]
- Feldmeyer D., Lubke J., Silver R.A., Sakmann B. Synaptic connections between layer 4 spiny neurone-layer 2/3 pyramidal cell pairs in juvenile rat barrel cortex: physiology and anatomy of interlaminar signalling within a cortical column. J. Physiology-London. 2002;538:803–822. doi: 10.1113/jphysiol.2001.012959. [DOI] [PMC free article] [PubMed] [Google Scholar]
- Feldmeyer D., Roth A., Sakmann B. Monosynaptic connections between pairs of spiny stellate cells in layer 4 and pyramidal cells in layer 5A indicate that lemniscal and paralemniscal afferent pathways converge in the infragranular somatosensory cortex. J. Neurosci. 2005;25:3423–3431. doi: 10.1523/JNEUROSCI.5227-04.2005. [DOI] [PMC free article] [PubMed] [Google Scholar]
- Gal E., London M., Globerson A., Ramaswamy S., Reimann M.W., Muller E., Markram H., Segev I. Rich cell-type-specific network topology in neocortical microcircuitry. Nat. Neurosci. 2017;20:1004–1013. doi: 10.1038/nn.4576. [DOI] [PubMed] [Google Scholar]
- Gal E., Perin R., Markram H., London M., Segev I. Neuron geometry underlies a universal local architecture in neuronal networks. bioRxiv. 2019 doi: 10.1101/656058. Preprint at. [DOI] [Google Scholar]
- Gibbs J.W. Charles Scribner's Sons; 1902. Elementary Principles in Statistical Mechanics. [Google Scholar]
- Guest J.M., Bast A., Narayanan R.T., Oberlaender M. Thalamus Gates Active Dendritic Computations in Cortex during Sensory Processing. bioRxiv. 2022 doi: 10.1101/2021.10.21.465325. Preprint at. [DOI] [Google Scholar]
- Helmstaedter M., Sakmann B., Feldmeyer D. L2/3 interneuron groups defined by multiparameter analysis of axonal projection, dendritic geometry, and electrical excitability. Cereb. Cortex. 2009;19:951–962. doi: 10.1093/cercor/bhn130. [DOI] [PubMed] [Google Scholar]
- Hofer S.B., Ko H., Pichler B., Vogelstein J., Ros H., Zeng H., Lein E., Lesica N.A., Mrsic-Flogel T.D. Differential connectivity and response dynamics of excitatory and inhibitory neurons in visual cortex. Nat. Neurosci. 2011;14:1045–1052. doi: 10.1038/nn.2876. [DOI] [PMC free article] [PubMed] [Google Scholar]
- Holler S., Kostinger G., Martin K.A.C., Schuhknecht G.F.P., Stratford K.J. Structure and function of a neocortical synapse. Nature. 2021;591:111–116. doi: 10.1038/s41586-020-03134-2. [DOI] [PubMed] [Google Scholar]
- Holmgren C., Harkany T., Svennenfors B., Zilberter Y. Pyramidal cell communication within local networks in layer 2/3 of rat neocortex. J. Physiol. 2003;551:139–153. doi: 10.1113/jphysiol.2003.044784. [DOI] [PMC free article] [PubMed] [Google Scholar]
- Jiang X., Shen S., Cadwell C.R., Berens P., Sinz F., Ecker A.S., Patel S., Tolias A.S. Principles of connectivity among morphologically defined cell types in adult neocortex. Science. 2015;350:aac9462. doi: 10.1126/science.aac9462. [DOI] [PMC free article] [PubMed] [Google Scholar]
- Jouhanneau J.S., Kremkow J., Dorrn A.L., Poulet J.F. In vivo monosynaptic excitatory transmission between layer 2 cortical pyramidal neurons. Cell Rep. 2015;13:2098–2106. doi: 10.1016/j.celrep.2015.11.011. [DOI] [PMC free article] [PubMed] [Google Scholar]
- Jouhanneau J.S., Kremkow J., Poulet J.F.A. Single synaptic inputs drive high-precision action potentials in parvalbumin expressing GABA-ergic cortical neurons in vivo. Nat. Commun. 2018;9:1540. doi: 10.1038/s41467-018-03995-2. [DOI] [PMC free article] [PubMed] [Google Scholar]
- Karimi A., Odenthal J., Drawitsch F., Boergens K.M., Helmstaedter M. Cell-type specific innervation of cortical pyramidal cells at their apical dendrites. Elife. 2020;9 doi: 10.7554/eLife.46876. [DOI] [PMC free article] [PubMed] [Google Scholar]
- Karube F., Kubota Y., Kawaguchi Y. Axon branching and synaptic bouton phenotypes in GABAergic nonpyramidal cell subtypes. J. Neurosci. 2004;24:2853–2865. doi: 10.1523/JNEUROSCI.4814-03.2004. [DOI] [PMC free article] [PubMed] [Google Scholar]
- Kasthuri N., Hayworth K.J., Berger D.R., Schalek R.L., Conchello J.A., Knowles-Barley S., Lee D., Vazquez-Reina A., Kaynig V., Jones T.R., et al. Saturated reconstruction of a volume of neocortex. Cell. 2015;162:648–661. doi: 10.1016/j.cell.2015.06.054. [DOI] [PubMed] [Google Scholar]
- Kawaguchi Y., Karube F., Kubota Y. Dendritic branch typing and spine expression patterns in cortical nonpyramidal cells. Cereb. Cortex. 2006;16:696–711. doi: 10.1093/cercor/bhj015. [DOI] [PubMed] [Google Scholar]
- Keller A., White E.L. Synaptic organization of GABAergic neurons in the mouse SmI cortex. J. Comp. Neurol. 1987;262:1–12. doi: 10.1002/cne.902620102. [DOI] [PubMed] [Google Scholar]
- Koelbl C., Helmstaedter M., Lubke J., Feldmeyer D. A barrel-related interneuron in layer 4 of rat somatosensory cortex with a high intrabarrel connectivity. Cereb. Cortex. 2015;25:713–725. doi: 10.1093/cercor/bht263. [DOI] [PMC free article] [PubMed] [Google Scholar]
- Koulakov A., Shuvaev S., Zador A.M. Encoding innate ability through a Genonic Bottleneck. bioRxiv. 2021 doi: 10.1101/2021.03.16.435261. Preprint at. [DOI] [Google Scholar]
- Krieger P., Kuner T., Sakmann B. Synaptic connections between layer 5B pyramidal neurons in mouse somatosensory cortex are independent of apical dendrite bundling. J. Neurosci. 2007;27:11473–11482. doi: 10.1523/JNEUROSCI.1182-07.2007. [DOI] [PMC free article] [PubMed] [Google Scholar]
- Kubota Y. Untangling GABAergic wiring in the cortical microcircuit. Curr. Opin. Neurobiol. 2014;26:7–14. doi: 10.1016/j.conb.2013.10.003. [DOI] [PubMed] [Google Scholar]
- Landau I.D., Egger R., Dercksen V.J., Oberlaender M., Sompolinsky H. The impact of structural heterogeneity on excitation-inhibition balance in cortical networks. Neuron. 2016;92:1106–1121. doi: 10.1016/j.neuron.2016.10.027. [DOI] [PMC free article] [PubMed] [Google Scholar]
- Lanuza M.A., Tomàs J., Garcia N., Cilleros-Mañé V., Just-Borràs L., Tomàs M. Axonal competition and synapse elimination during neuromuscular junction development. Curr. Opin. Physiol. 2018;4:25–31. [Google Scholar]
- Larkman A.U. Dendritic morphology of pyramidal neurones of the visual cortex of the rat: III. Spine distributions. J. Comp. Neurol. 1991;306:332–343. doi: 10.1002/cne.903060209. [DOI] [PubMed] [Google Scholar]
- Lefebvre J.L., Sanes J.R., Kay J.N. Development of dendritic form and function. Annu. Rev. Cell Dev. Biol. 2015;31:741–777. doi: 10.1146/annurev-cellbio-100913-013020. [DOI] [PubMed] [Google Scholar]
- Lefort S., Tomm C., Floyd Sarria J.C., Petersen C.C. The excitatory neuronal network of the C2 barrel column in mouse primary somatosensory cortex. Neuron. 2009;61:301–316. doi: 10.1016/j.neuron.2008.12.020. [DOI] [PubMed] [Google Scholar]
- Macke J.H., Opper M., Bethge M. Common input explains higher-order correlations and entropy in a simple model of neural population activity. Phys. Rev. Lett. 2011;106:208102. doi: 10.1103/PhysRevLett.106.208102. [DOI] [PubMed] [Google Scholar]
- Markram H., Lubke J., Frotscher M., Roth A., Sakmann B. Physiology and anatomy of synaptic connections between thick tufted pyramidal neurones in the developing rat neocortex. J. Physiol. 1997;500:409–440. doi: 10.1113/jphysiol.1997.sp022031. [DOI] [PMC free article] [PubMed] [Google Scholar]
- Markram H., Muller E., Ramaswamy S., Reimann M.W., Abdellah M., Sanchez C.A., Ailamaki A., Alonso-Nanclares L., Antille N., Arsever S., et al. Reconstruction and simulation of neocortical microcircuitry. Cell. 2015;163:456–492. doi: 10.1016/j.cell.2015.09.029. [DOI] [PubMed] [Google Scholar]
- Markram H., Toledo-Rodriguez M., Wang Y., Gupta A., Silberberg G., Wu C. Interneurons of the neocortical inhibitory system. Nat. Rev. Neurosci. 2004;5:793–807. doi: 10.1038/nrn1519. [DOI] [PubMed] [Google Scholar]
- Mercer A., West D.C., Morris O.T., Kirchhecker S., Kerkhoff J.E., Thomson A.M. Excitatory connections made by presynaptic cortico-cortical pyramidal cells in layer 6 of the neocortex. Cereb. Cortex. 2005;15:1485–1496. doi: 10.1093/cercor/bhi027. [DOI] [PubMed] [Google Scholar]
- Meyer H.S., Egger R., Guest J.M., Foerster R., Reissl S., Oberlaender M. Cellular organization of cortical barrel columns is whisker-specific. Proc. Natl. Acad. Sci. U S A. 2013;110:19113–19118. doi: 10.1073/pnas.1312691110. [DOI] [PMC free article] [PubMed] [Google Scholar]
- Milo R., Shen-Orr S., Itzkovitz S., Kashtan N., Chklovskii D., Alon U. Network motifs: simple building blocks of complex networks. Science. 2002;298:824–827. doi: 10.1126/science.298.5594.824. [DOI] [PubMed] [Google Scholar]
- Miner D., Triesch J. Plasticity-Driven self-organization under topological constraints accounts for non-random features of cortical synaptic wiring. PLoS Comput Biol. 2016;12:e1004759. doi: 10.1371/journal.pcbi.1004759. [DOI] [PMC free article] [PubMed] [Google Scholar]
- Mishchenko Y., Hu T., Spacek J., Mendenhall J., Harris K.M., Chklovskii D.B. Ultrastructural analysis of hippocampal neuropil from the connectomics perspective. Neuron. 2010;67:1009–1020. doi: 10.1016/j.neuron.2010.08.014. [DOI] [PMC free article] [PubMed] [Google Scholar]
- Motta A., Berning M., Boergens K.M., Staffler B., Beining M., Loomba S., Hennig P., Wissler H., Helmstaedter M. Dense connectomic reconstruction in layer 4 of the somatosensory cortex. Science. 2019;366 doi: 10.1126/science.aay3134. [DOI] [PubMed] [Google Scholar]
- Narayanan R.T., Egger R., Johnson A.S., Mansvelder H.D., Sakmann B., De Kock C.P., Oberlaender M. Beyond columnar organization: cell type- and target layer-specific principles of horizontal axon projection patterns in rat vibrissal cortex. Cereb. Cortex. 2015;25:4450–4468. doi: 10.1093/cercor/bhv053. [DOI] [PMC free article] [PubMed] [Google Scholar]
- Narayanan R.T., Udvary D., Oberlaender M. Cell type-specific structural organization of the six layers in rat barrel cortex. Front Neuroanat. 2017;11:91. doi: 10.3389/fnana.2017.00091. [DOI] [PMC free article] [PubMed] [Google Scholar]
- Oberlaender M., De Kock C.P., Bruno R.M., Ramirez A., Meyer H.S., Dercksen V.J., Helmstaedter M., Sakmann B. Cell type-specific three-dimensional structure of thalamocortical circuits in a column of rat vibrissal cortex. Cereb. Cortex. 2012;22:2375–2391. doi: 10.1093/cercor/bhr317. [DOI] [PMC free article] [PubMed] [Google Scholar]
- Oberlaender M., Ramirez A., Bruno R.M. Sensory experience restructures thalamocortical axons during adulthood. Neuron. 2012;74:648–655. doi: 10.1016/j.neuron.2012.03.022. [DOI] [PMC free article] [PubMed] [Google Scholar]
- Penn A.A., Riquelme P.A., Feller M.B., Shatz C.J. Competition in retinogeniculate patterning driven by spontaneous activity. Science. 1998;279:2108–2112. doi: 10.1126/science.279.5359.2108. [DOI] [PubMed] [Google Scholar]
- Perin R., Berger T.K., Markram H. A synaptic organizing principle for cortical neuronal groups. Proc. Natl. Acad. Sci. U S A. 2011;108:5419–5424. doi: 10.1073/pnas.1016051108. [DOI] [PMC free article] [PubMed] [Google Scholar]
- Peters A., Feldman M.L. The projection of the lateral geniculate nucleus to area 17 of the rat cerebral cortex. I. General description. J. Neurocytol. 1976;5:63–84. doi: 10.1007/BF01176183. [DOI] [PubMed] [Google Scholar]
- Petersen C.C., Sakmann B. The excitatory neuronal network of rat layer 4 barrel cortex. J. Neurosci. 2000;20:7579–7586. doi: 10.1523/JNEUROSCI.20-20-07579.2000. [DOI] [PMC free article] [PubMed] [Google Scholar]
- Rees C.L., Moradi K., Ascoli G.A. Weighing the evidence in Peters' rule: does neuronal morphology predict connectivity? Trends Neurosci. 2017;40:63–71. doi: 10.1016/j.tins.2016.11.007. [DOI] [PMC free article] [PubMed] [Google Scholar]
- Sanes J.R., Yamagata M. Many paths to synaptic specificity. Annu. Rev. Cell Dev. Biol. 2009;25:161–195. doi: 10.1146/annurev.cellbio.24.110707.175402. [DOI] [PubMed] [Google Scholar]
- Santuy A., Rodriguez J.R., Defelipe J., Merchan-Perez A. Volume electron microscopy of the distribution of synapses in the neuropil of the juvenile rat somatosensory cortex. Brain Struct. Funct. 2018;223:77–90. doi: 10.1007/s00429-017-1470-7. [DOI] [PMC free article] [PubMed] [Google Scholar]
- Shapson-Coe A., Januszewski M., Berger D.R., Pope A., Wu Y., Blakely T., Schalek R.L., Li P., Wang S., Maitin-Shepard J., et al. A connectomic study of a petascale fragment of human cerebral cortex. bioRxiv. 2021 doi: 10.1101/2021.05.29.446289. Preprint at. [DOI] [Google Scholar]
- Silberberg G., Markram H. Disynaptic inhibition between neocortical pyramidal cells mediated by martinotti cells. Neuron. 2007;53:735–746. doi: 10.1016/j.neuron.2007.02.012. [DOI] [PubMed] [Google Scholar]
- Song S., Sjostrom P.J., Reigl M., Nelson S., Chklovskii D.B. Highly nonrandom features of synaptic connectivity in local cortical circuits. PLoS Biol. 2005;3:e68. doi: 10.1371/journal.pbio.0030068. [DOI] [PMC free article] [PubMed] [Google Scholar]
- Sun Q.Q., Huguenard J.R., Prince D.A. Barrel cortex microcircuits: thalamocortical feedforward inhibition in spiny stellate cells is mediated by a small number of fast-spiking interneurons. J. Neurosci. 2006;26:1219–1230. doi: 10.1523/JNEUROSCI.4727-04.2006. [DOI] [PMC free article] [PubMed] [Google Scholar]
- Thomson A.M., West D.C., Wang Y., Bannister A.P. Synaptic connections and small circuits involving excitatory and inhibitory neurons in layers 2-5 of adult rat and cat neocortex: triple intracellular recordings and biocytin labelling in vitro. Cereb. Cortex. 2002;12:936–953. doi: 10.1093/cercor/12.9.936. [DOI] [PubMed] [Google Scholar]
- Turney S.G., Lichtman J.W. Reversing the outcome of synapse elimination at developing neuromuscular junctions in vivo: evidence for synaptic competition and its mechanism. PLoS Biol. 2012;10:e1001352. doi: 10.1371/journal.pbio.1001352. [DOI] [PMC free article] [PubMed] [Google Scholar]
- Wang Y., Gupta A., Toledo-Rodriguez M., Wu C.Z., Markram H. Anatomical, physiological, molecular and circuit properties of nest basket cells in the developing somatosensory cortex. Cereb. Cortex. 2002;12:395–410. doi: 10.1093/cercor/12.4.395. [DOI] [PubMed] [Google Scholar]
- White E.L., Benshalom G., Hersch S.M. Thalamocortical and other synapses involving nonspiny multipolar cells of mouse SmI cortex. J. Comp. Neurol. 1984;229:311–320. doi: 10.1002/cne.902290303. [DOI] [PubMed] [Google Scholar]
- Yogev S., Shen K. Cellular and molecular mechanisms of synaptic specificity. Annu. Rev. Cell Dev. Biol. 2014;30:417–437. doi: 10.1146/annurev-cellbio-100913-012953. [DOI] [PubMed] [Google Scholar]
- Yoshimura Y., Dantzker J.L., Callaway E.M. Excitatory cortical neurons form fine-scale functional networks. Nature. 2005;433:868–873. doi: 10.1038/nature03252. [DOI] [PubMed] [Google Scholar]
- Zador A.M. A critique of pure learning and what artificial neural networks can learn from animal brains. Nat. Commun. 2019;10:3770. doi: 10.1038/s41467-019-11786-6. [DOI] [PMC free article] [PubMed] [Google Scholar]
Associated Data
This section collects any data citations, data availability statements, or supplementary materials included in this article.
Supplementary Materials
An asterisk (∗) after the reference denotes connectivity measurements within the septum; age is given in postnatal days; n denotes the number of pairs tested; P(A,B) denotes the connection probability of type A to type B, either measured or predicted (% of networks) as the mean or standard deviation (STD). Deviation between empirically observed and predicted connection probability: dev = (P(A,B) empirical – mean of P(A,B) predicted) / (STD of P(A,B) predicted). prctl denotes percentage of predicted connection probabilities that are lower or equal than P(A,B) empirical (e.g., prctl = 0: none of the predicted connection probabilities are lower or equal than P(A,B) empirical; prctl = 100: all predicted connection probabilities are lower or equal than P(A,B) empirical). Correlation between predictions and empirical data: R = 0.71 (p < 10−5, n = 32 for rat); R = 0.55 (p = 10−5, n = 57 for mouse).
Data Availability Statement
-
•
All original code is publicly available at GitHub: https://github.com/zibneuro/udvary-et-al-2022.
-
•
An archived version of record of the code is available at Zenodo: https://doi.org/10.5281/zenodo.6344508.
-
•
The model of the rat barrel cortex, the derived network configurations, the underlying morphological data, and all analysis routines are available online at CortexInSilico: https://cortexinsilico.zib.de/download.
-
•
Any additional information required to reanalyze the data reported in this paper is available from the Lead Contact upon request.