Abstract
The antifungal agent fluconazole (FLC) is widely used in clinical practice. Monitoring FLC levels is useful in complicated clinical settings and in experimental infection models. A bioassay using Candida pseudotropicalis, a simple and cost-effective method, is validated only for FLC levels ranging from 5 to 40 mg/liter. An extension of the analytical range is needed to cover most yeast MICs. A new bioassay in RPMI agar containing methylene blue was developed using C. albicans DSY1024, a mutant rendered hypersusceptible to FLC constructed by the deletion of the multidrug efflux transporter genes CDR1, CDR2, CaMDR1, and FLU1. Reproducible standard curves were obtained with FLC concentrations in plasma ranging from 1 to 100 mg/liter (quadratic regression coefficient > 0.997). The absolute sensitivity was 0.026 μg of FLC. The method was internally validated according to current guidelines for analytical method validation. Both accuracy and precision lied in the required ±15% range. FLC levels measured by bioassay and by high-performance liquid chromatography (HPLC) performed with 62 plasma samples from humans and rats showed a strong correlation (coefficients, 0.979 and 0.995, respectively; percent deviations of bioassay from HPLC values, 0.44% ± 15.31% and 2.66% ± 7.54%, respectively). In summary, this newly developed bioassay is sensitive, simple, rapid, and inexpensive. It allows nonspecialized laboratories to determine FLC levels in plasma to within the clinically relevant concentration range and represents a useful tool for experimental treatment models.
Fluconazole (FLC) is widely used in clinical practice. Its favorable pharmacokinetics (high oral bioavailability, minimal metabolization, low protein binding in plasma, and predominant renal excretion as unchanged drug) facilitates the management of its dosing (6, 9). However, in some situations its pharmacokinetics is difficult to predict. In these cases, the determination of circulating FLC levels is important to guide its dosing. On the other hand, the relationship between the MIC of FLC and FLC levels in plasma is determinant for clinical outcome of infections due to Candida isolates with decreased susceptibility to FLC (1, 3, 5, 7, 10, 12, 14, 15). The treatment of these infections requires adjustments in FLC dosages. Finally, pharmacokinetic studies are important in experimental treatment models (4). For all these purposes, the relevant FLC concentration range lies between 2 and 60 mg/liter. Two methods for quantification of FLC in biological samples are available. High-performance liquid chromatography (HPLC) is the method of choice but requires expensive equipment and laborious sample preparation. Bioassay affords several practical advantages, such as simplicity, rapidity, and minor costs. Two studies describe an FLC bioassay using Candida pseudotropicalis (8, 13). The method proposed by Rex et al. (13) was validated for FLC levels between 5 and 40 mg/liter. The aim of the present work was to develop a bioassay with an extended analytical range using C. albicans DSY1024, a mutant hypersusceptible to FLC constructed by deletion of the multidrug transporter genes CDR1, CDR2, CaMDR1, and FLU1 (2, 16).
MATERIALS AND METHODS
Strains and media.
C. albicans DSY1024 (Δcdr1::hisG/Δcdr1::hisG Δcdr2::hisG/Δcdr2::hisG Δcamdr1::hisG/Δcamdr1::hisG Δflu1::hisG/Δflu1::hisG-URA3-hisG) (MIC of FLC, 0.03 mg/liter) was constructed by targeted gene deletions in the parent strain CAF4-2 (FLC MIC of 0.25 mg/liter) (2). In preliminary assays, C. albicans DSY1024 was compared to the Ura+ parental strain C. albicans CAF2-1 (FLC MIC of 0.25 mg/liter), to the reference isolate C. albicans ATCC 90028 (FLC MIC of 0.25 to 1 mg/liter), and to a clinical strain of C. pseudotropicalis (FLC MIC of 0.5 mg/liter). The strains were maintained at 4°C on Sabouraud dextrose agar plates (Difco Laboratories, Basel, Switzerland) and subcultured twice at 35°C before each experiment.
Bioassay preparation.
A single CFU of the isolate to be tested was grown overnight in Sabouraud liquid medium (Diagnostics Pasteur, Marnes La Coquette, France) with shaking at 200 rpm and at 35°C. The inoculum was prepared by diluting the overnight culture with 0.9% NaCl to an optical density of 0.5 measured by a spectrophotometer (model 340; Sequoia Turner Inc., Taiwan). This optical density corresponded to 1 × 10⁷ to 2 × 10⁷ CFU/ml. The viable counts were verified by subcultures on Sabouraud dextrose agar plates. MOPS (Fluka, Buchs, Switzerland)-buffered RPMI 1640 with l-glutamine without bicarbonate (Difco Laboratories) was prepared at a concentration double that recommended by NCCLS-approved standard M27-A for antifungal susceptibility testing (69.04 g/liter; i.e., 0.33 M and 20.8 g/liter, respectively) (13). The broth medium was then sterilized by ultrafiltration (Stericup [pore size, 0.22 μm]; Millipore Corp., Bedford, Mass.). A 4% agar (purified BBL agar; Becton Dickinson, Microbiology System, Cockeysville, Md.) was autoclaved and then allowed to equilibrate at a temperature of 45°C. RPMI (61 ml), 61 ml of 4% agar, 0.5 ml of methylene blue (2,500 mg/liter), and 2.5 ml of inoculum were mixed at the temperature of 45°C. The final volume of 125 ml (containing MOPS-buffered RPMI at the concentration recommended by the NCCLS for antifungal susceptibility testing, 2% agar, methylene blue [10 mg/liter], and a final inoculum of 1 × 10⁵ to 2 × 10⁵ CFU/ml) was poured in square glass plates (220 by 220 mm). Thereafter, 38 round wells (diameter, 4 mm; capacity, 25 μl) were cut using a sterile cork borer over a standard template. Each analytical run tested in duplicate the following (25-μl) plasma samples: one blank, eight standards, four quality controls (for preparation of both, see below), and six unknowns. The plasma was allowed to diffuse from wells to agar at 4°C for 2 h. The plate was then incubated at 35°C for 12 h. Growth inhibition was read by measuring the horizontal, the vertical, and the two diagonal diameters to the nearest 0.1 mm with a vernier calliper. For the FLC concentration range 1 to 100 mg/liter, the expected diameters of growth inhibition ranged from 8 to 36 mm.
Spiked plasma samples.
Two batches of all spiked samples, one in pooled human heparinized plasma and the other in pooled rat heparinized plasma, were prepared by serial dilutions of FLC (kindly provided by Pfizer, Sandwich, United Kingdom). FLC standards ranged between 1 and 100 mg/liter. FLC quality controls contained 1.875, 3.75, 15, and 60 mg/liter. Each batch was divided in aliquots (60 μl for the bioassay; 250 μl for HPLC), kept at −80°C, and used for all analytical runs.
Plasma samples ex vivo. (i) Pharmacokinetic studies in humans.
Healthy volunteers were given the following single doses of FLC (Diflucan tablets; Pfizer, Zürich, Switzerland) orally: 100 mg (three subjects), 200 mg (three subjects), or 400 mg (three subjects). Blood was drawn by venipuncture 1, 7, and 24 h after drug administration. Following centrifugation (2,000 × g for 10 min at 4°C) aliquots were prepared and stocked as described for spiked samples.
(ii) Pharmacokinetic studies in rats.
Healthy female Wistar rats were injected with the following single doses of FLC (Diflucan, injectable form [2 mg/liter]; Pfizer) intraperitoneally: 9 mg/kg of body weight (six animals) and 45 mg/kg (six animals). Blood was drawn by puncture of the periorbital venous plexus under ether anesthesia 1, 4, and 8 h after drug administration and processed as described above.
HPLC. (i) Sample preparation.
Frozen aliquots were thawed at room temperature. Aliquots (240 μl) of plasma were transferred into disposable microtube filtration units (Ultrafree; Millipore Corporation) containing cellulose filters with a 5-kDa cutoff. The tubes were centrifuged at 15,000 × g and 15°C for 60 min, and 160 μl of filtrate was collected. (P. A. Majcherczyk, O. Marchetti, M. P. Glauser, J. Bille, D. Sanglard, and P. Moreillon, Eur. Cong. Clin. Microbiol. Infect. Dis., abstr. P1185, 1999).
(ii) HPLC system.
The HPLC system (Hitachi Instruments, Ichige, Hitachinaka, Japan) consisted of the L-7200 autosampler, the L-7100 gradient pump (with low-pressure mixing), and the L-7450 diode array detector. Column temperature was maintained at 30°C using a Pelcooler (LabSource, Reinach, Switzerland). The results were analyzed using the D-7000 HPLC System Manager program (Hitachi Instruments). The amount of FLC was calculated by the external standards method.
Separation was performed by injection of a 60-μl sample into a C18 reverse-phase column (SuperPac Sephasil C18; column dimensions, 5 μm by 4 mm by 250 mm; Pharmacia Biotech, Uppsala, Sweden), protected with a guard cartridge (C18; column dimensions, 5 μm by 4 mm by 10 mm). The mobile phase was an isocratic gradient of 30% methanol–70% acetate buffer (0.1 M sodium acetate; pH 5.0). Elution was at a flow rate of 1 ml/min, and detection was at 210 nm. FLC eluted at 8.40 min.
Each analytical run included one blank, eight standards, and four quality control samples. All spiked and unknown samples (60 μl) were tested in duplicate.
Statistical analysis.
Bioassay and HPLC were internally validated independently for the analytical range 1.875 to 60 mg/liter according to the current recommendations for analytical method validation for both human and rat plasmas (17). These guidelines require a standard curve consisting of five to eight points with reproducible linear or nonlinear responses and statistical fits. The present work used standard curves consisting of eight points and calculated by quadratic regression. Furthermore, stability by freezing, specificity, intra- and interrun accuracy (percent deviation from nominal value was calculated according to the following formula: measured value/nominal value × 100), and precision (coefficient of variation was calculated as follows: standard deviation [SD] of measured values/mean measured values × 100) were determined for each quality control sample. The correlations of FLC concentrations measured by bioassay and HPLC for each single sample from healthy volunteers and rats were analyzed by the nonparametric Spearman method. Furthermore, corresponding mean percent deviations (± SD) of the values obtained by bioassay from those obtained by HPLC were calculated.
RESULTS
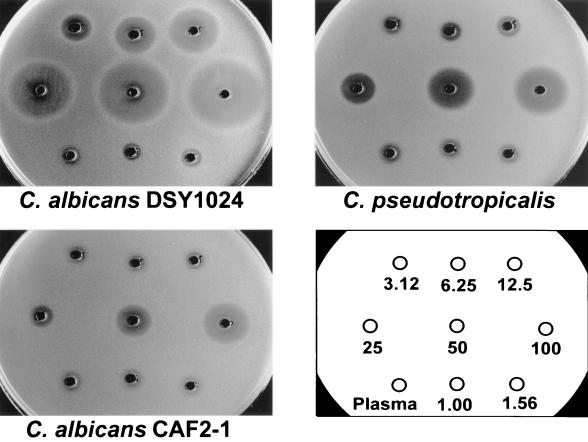
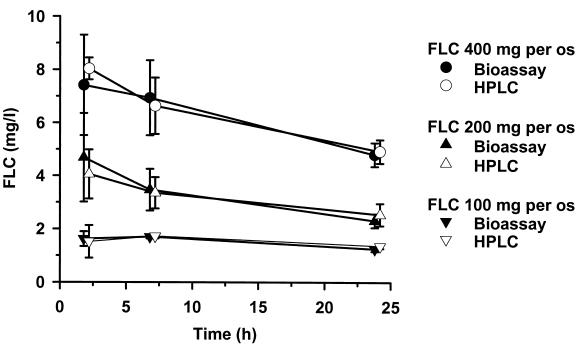
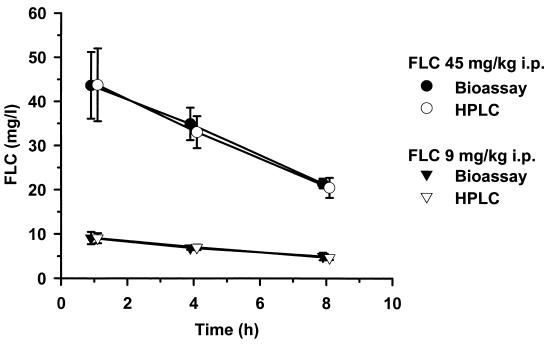
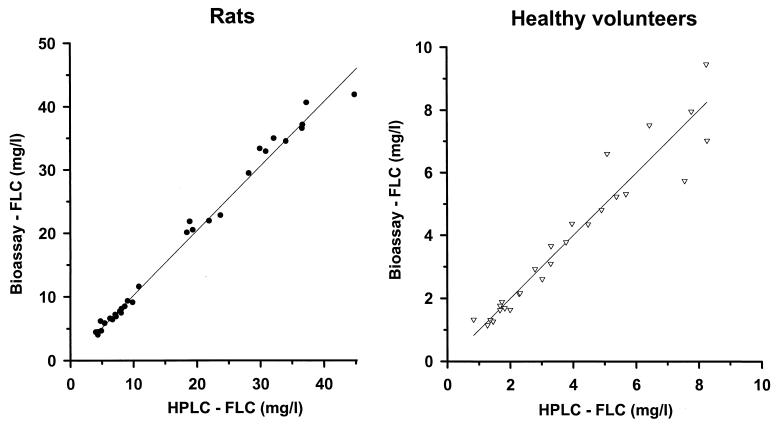
FLC bioassays were performed using the hypersusceptible C. albicans mutant DSY1024, the parent strain CAF2-1, and the reference strain C. pseudotropicalis (Fig. 1). The test using C. albicans ATCC 90028 gave identical results to those obtained with CAF2-1 (data not shown). The zones of growth inhibition obtained with DSY1024 were free of residual growth and ranged between 8 mm for an FLC concentration of 1 mg/liter and 36 mm for an FLC concentration of 100 mg/liter. Standard curves in this analytical range had a quadratic regression coefficient of >0.9975 and an excellent reproducibility: b0 = −0.4490 ± 0.0805, b1 = 0.0551 ± 0.0052, b2 = 4.6603 e−4 ± 1.0694 e−4. The limit of quantification of a 1-mg/liter concentration in a sample volume of 25 μl corresponded to an absolute sensitivity of 0.026 μg of FLC. The results of the internal intra- and interrun validation in human plasma are summarized in Table 1. For each quality control sample, intra- and interrun deviations and coefficients of variation were in the recommended range of ±15%. The average intrarun deviation determined in quintuplicate for the four spiked quality controls was −3.72% ± 7.67%, and the corresponding coefficient of variation was 3.27% ± 0.63%. The interrun deviation over five analytical runs was −3.29% ± 6.99%; the coefficient of variation was 3.39% ± 0.96%. The internal validation procedure in rat plasma gave similar results (data not shown). The results of FLC pharmacokinetics in healthy volunteers determined by bioassay and by HPLC are shown in Fig. 2. At all time points investigated, the plasma levels measured with the bioassay after administration of three different single doses of FLC were close to those measured by HPLC. Similarly, after administration of two different single doses of FLC to rats, the pharmacokinetic values obtained with both methods were superposable (Fig. 3). The correlation between FLC level of each single plasma sample measured by bioassay and by HPLC was studied, and the results obtained with both methods for 27 human samples and 35 rat samples are reported in Fig. 4. The Spearman correlation coefficients between HPLC and bioassay were 0.979 and 0.995 for human and rat samples, respectively. The average deviations of the values obtained by bioassay from those obtained by HPLC were 0.44% ± 15.31% and 2.66% ± 7.54%, respectively.
FIG. 1.
FLC bioassays with different Candida isolates. The tested FLC concentrations spiked in plasma ranged between 1 and 100 mg/liter. The limits of quantification were 1 mg/liter for the new proposed method using the C. albicans mutant strain DSY1024, 12.5 mg/liter using the parent strain C. albicans CAF2-1, and 6.25 mg/liter for the reference method using C. pseudotropicalis.
TABLE 1.
Intra- and interrun validation in human plasma of the FLC bioassay using hypersusceptible mutant DSY1024c
| Nominal FLC concn (mg/liter) | Intrarun validation (n = 5)
|
Interrun validation (n = 5)
|
||||
|---|---|---|---|---|---|---|
| Measured FLC concn (mg/liter) | Deviationa (%) | Coefficient of variation (%)b | Measured FLC concn (mg/liter) | Deviationa (%) | Coefficient of variation (%)b | |
| 1.875 | 1.69 ± 0.05 | −9.87 ± 2.83 | 3.14 | 1.71 ± 0.06 | −8.80 ± 3.00 | 3.51 |
| 3.75 | 3.37 ± 0.09 | −10.13 ± 2.54 | 2.76 | 3.44 ± 0.10 | −8.99 ± 1.37 | 2.91 |
| 15 | 15.77 ± 0.66 | 5.50 ± 4.43 | 4.19 | 15.82 ± 0.74 | 5.54 ± 4.90 | 4.68 |
| 60 | 59.75 ± 1.79 | −0.40 ± 3.00 | 3.00 | 59.45 ± 1.46 | −0.91 ± 2.44 | 2.46 |
| All | −3.72 ± 7.67 | 3.27 ± 0.63 | −3.29 ± 6.99 | 3.39 ± 0.96 | ||
The accuracy is expressed by the deviation between measured and nominal FLC levels of five different determinations for the same plasma sample.
The precision is expressed by the coefficient of variation.
Results are means ± SDs.
FIG. 2.
Pharmacokinetics of FLC in plasma of healthy humans. Comparative results of bioassay and HPLC after 400-, 200-, and 100-mg single doses of Diflucan per os. Each time point represents the mean value and the SD (error bars) of the plasma levels determined in three different individuals.
FIG. 3.
Pharmacokinetics of FLC in plasma of rats. Comparative results of bioassay and HPLC after 45- and 9-mg/kg single doses of Diflucan intraperitoneally. Each time point represents the mean value and the SD (error bars) of the plasma levels determined in three different animals.
FIG. 4.
Correlation of the FLC concentrations measured by HPLC and by bioassay. The plasma levels measured with the two methods for each single plasma sample collected for the pharmacokinetic studies shown in Fig. 2 and 3 are represented: healthy volunteers (right panel) (r = 0.979) and rats (left panel) (r = 0.995).
DISCUSSION
A simple method to reliably measure FLC concentrations in plasma is useful to guide the treatment in complicated clinical settings and in experimental models. For all these purposes, a test covering the concentration range 2 to 60 mg/liter is required. The deletion of several multidrug efflux transporter genes in C. albicans generated a strain (DSY1024) hypersusceptible to FLC (2). This mutant allowed the development of a new and sensitive bioassay for FLC. The method was internally validated according to the requirements of the international guidelines for analytical method validation in the relevant concentration range 1.875 to 60 mg/liter (17).
Pharmacokinetic studies of healthy humans and rats showed an excellent correlation between the FLC concentrations measured by HPLC and those measured by bioassay. The proposed bioassay is simple, rapid, inexpensive, and reliable. It can be used in routine microbiology laboratories and does not require specialized personnel or sophisticated equipment. The small plasma volumes needed make it possible to determine FLC levels in pediatric samples and in samples from small animals used as experimental models. This method might also be used with other biological fluids. The development of an automatic reading system could further improve test standardization. Additionally, the adaptation of the implementation of this new method to other azole antifungals deserves further investigations.
ACKNOWLEDGMENTS
We are indebted to Laurent Decosterd, Christian Durussel, Marica Gallazzo, and Marlyse Giddey for their competent methodological and technical support.
REFERENCES
- 1.Anaissie E, Kontoyiannis D P, Huls C, Vartivarian S, Karl C, Prince R A, Bosso J, Bodey G P. Safety, plasma concentrations, and efficacy of high-dose fluconazole in invasive mold infections. J Infect Dis. 1995;172:599–602. doi: 10.1093/infdis/172.2.599. [DOI] [PubMed] [Google Scholar]
- 2.Calabrese D, Bille J, Sanglard D. A novel multidrug efflux transporter gene of the major facilitator superfamily from Candida albicans (FLUI) conferring resistance to fluconazole. Microbiology. 2000;146:2743–2754. doi: 10.1099/00221287-146-11-2743. [DOI] [PubMed] [Google Scholar]
- 3.Cameron M L, Schell W A, Bruch S, Bartlett J A, Waskin H A, Perfect J. Correlation of in vivo fluconazole resistance of Candida isolates in relation to therapy and symptoms of individuals seropositive for human immunodeficiency virus type 1. Antimicrob Agents Chemother. 1993;37:2449–2453. doi: 10.1128/aac.37.11.2449. [DOI] [PMC free article] [PubMed] [Google Scholar]
- 4.Craig W A. Pharmacokinetic/pharmacodynamic parameters: rationale for antibacterial dosing of mice and men. Clin Infect Dis. 1998;26:1–12. doi: 10.1086/516284. [DOI] [PubMed] [Google Scholar]
- 5.Ghannoum M A, Rex J H, Galgiani J N. Susceptibility testing of fungi: current status of correlation of in vitro data with clinical outcome. J Clin Microbiol. 1996;34:489–495. doi: 10.1128/jcm.34.3.489-495.1996. [DOI] [PMC free article] [PubMed] [Google Scholar]
- 6.Grant S M, Clissold S P. Fluconazole. A review of its pharmacodynamic and pharmacokinetic properties, and therapeutic potential in superficial and systemic mycoses. Drugs. 1990;39:877–916. doi: 10.2165/00003495-199039060-00006. [DOI] [PubMed] [Google Scholar]
- 7.Graybill J R, Najvar L K, Holmberg J D, Correa A, Luther M F. Fluconazole treatment of Candida albicans infection in mice: does in vitro susceptibility predict in vivo response? Antimicrob Agents Chemother. 1995;39:2197–2200. doi: 10.1128/aac.39.10.2197. [DOI] [PMC free article] [PubMed] [Google Scholar]
- 8.Hülsewede J W, Dermouni H. Serum level determination of fluconazole by high-performance liquid chromatography and bioassay. Zbl Bakteriol. 1996;283:492–496. doi: 10.1016/s0934-8840(96)80126-5. [DOI] [PubMed] [Google Scholar]
- 9.Humphrey M J, Jevons S, Tarbit M H. Pharmacokinetic evaluation of UK-49,858, a metabolically stable triazole antifungal drug, in animals and humans. Antimicrob Agents Chemother. 1985;28:648–653. doi: 10.1128/aac.28.5.648. [DOI] [PMC free article] [PubMed] [Google Scholar]
- 10.Louie A, Liu Q-F, Drusano G L, Liu W, Mayers M, Anaissie E, Miller M H. Pharmacokinetic studies of fluconazole in rabbits characterizing doses which achieve peak levels in serum and area under the concentration-time curve values which mimic those of high-dose fluconazole in humans. Antimicrob Agents Chemother. 1998;42:1512–1514. doi: 10.1128/aac.42.6.1512. [DOI] [PMC free article] [PubMed] [Google Scholar]
- 11.National Committee for Clinical Laboratory Standards. Reference method for broth dilution antifungal susceptibility testing of yeasts. 17, no. 9. Approved standard M27-A. Wayne, Pa: National Committee for Clinical Laboratory Standards; 1997. [Google Scholar]
- 12.Radetsky M, Wheeler R C, Roe M H, Todd J K. Microtiter broth dilution method for yeast susceptibility testing with validation by clinical outcome. J Clin Microbiol. 1986;24:600–606. doi: 10.1128/jcm.24.4.600-606.1986. [DOI] [PMC free article] [PubMed] [Google Scholar]
- 13.Rex J H, Hanson L H, Amantea M A, Stevens D A, Bennett J E. Standardization of a fluconazole bioassay and correlation of results to those obtained by high-pressure liquid chromatography. Antimicrob Agents Chemother. 1991;35:846–850. doi: 10.1128/aac.35.5.846. [DOI] [PMC free article] [PubMed] [Google Scholar]
- 14.Rex J H, Nelson P W, Paetznick V L, Lozano-Chiu M, Espinel-Ingroff A, Anaissie E. Optimizing the correlation between results of testing in vitro and therapeutic outcome in vivo for fluconazole by testing critical isolates in a murine model of invasive candidiasis. Antimicrob Agents Chemother. 1998;42:129–134. doi: 10.1128/aac.42.1.129. [DOI] [PMC free article] [PubMed] [Google Scholar]
- 15.Rex J H, Pfaller M A, Galgiani J N, Bartlett J A, Espinel-Ingroff A, Ghannoum M A, Lancaster M, Odds F C, Rinaldi M G, Walsh T J, Barry A L. Development of interpretive breakpoints for antifungal susceptibility testing: conceptual framework and analysis of in vitro-in vivo correlation data for fluconazole, itraconazole and Candida infections. Subcommittee on Antifungal Susceptibility Testing of the National Commitee for Clinical Laboratory Standards. Clin Infect Dis. 1997;24:235–247. doi: 10.1093/clinids/24.2.235. [DOI] [PubMed] [Google Scholar]
- 16.Sanglard D, Ischer F, Monod M, Bille J. Susceptibilities of Candida albicans multidrug transporter mutants to various antifungal agents and other metabolic inhibitors. Antimicrob Agents Chemother. 1996;40:2300–2305. doi: 10.1128/aac.40.10.2300. [DOI] [PMC free article] [PubMed] [Google Scholar]
- 17.Shah V P, Midha K K, Dighe S, McGilveray I J, Skelly J P, Yacobi A, Layloff T, Viswanathan C T, Cook C E, McDowall R D, Pittmann K A, Spector S. Analytical methods validation: bioavailability, bioequivalence and pharmacokinetic studies. Eur J Drug Metab Pharmacokinet. 1991;16:249–255. doi: 10.1007/BF03189968. [DOI] [PubMed] [Google Scholar]


