Abstract
The log transformation is often used to reduce skewness of a measurement variable. If, after transformation, the distribution is symmetric, then the Welch t-test might be used to compare groups. If, also, the distribution becomes close to normal, then a reference interval might be determined.
Keywords: Statistics, log transformation, reference intervals, t-test
Introduction
The aim of this article is to show good practice in the use of a suitable transformation for skewed data, using an example. The National Health and Nutrition Examination Study (NHANES) cohort provides a large open-access dataset. 1 Data from 2017 to 2018 were selected. For those aged 18–29 years, the prevalence of kidney disease will be low; the sample is considered to be composed of healthy subjects (494 males and 524 females).
The main use of the urinary albumin/creatinine ratio is to provide early evidence of microvascular renal disease in patients with diabetes; values much above 3 mg/mmol are considered to be clinically significant. From a statistical perspective, there are issues with ratio variables, and one will be identified in this article. Here, the albumin measurement alone will be explored.
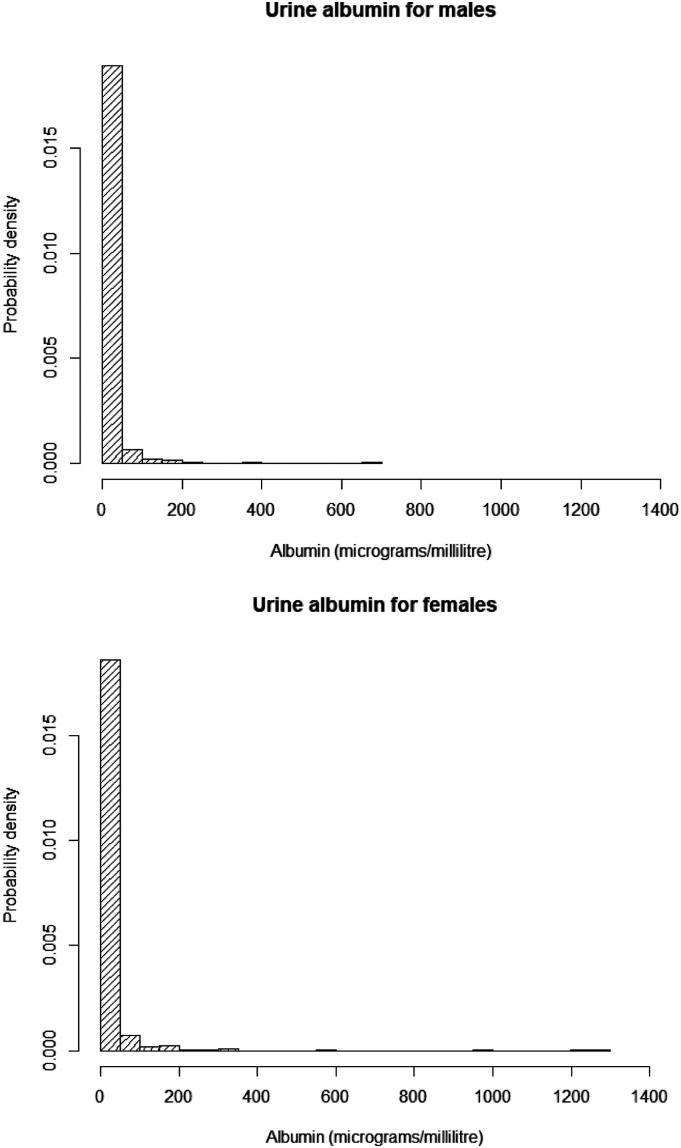
Figure 1 shows that the distribution of urine albumin is skewed to the right with a long right tail. Suitable summary statistics are the median and interquartile range (IQR). The IQR specifies the 25% and 75% centiles and therefore half of the distribution lies between them. For men, median urine albumin is 10.30 μg/mL, with an IQR of 4.55–15.47 μg/mL; for women, median is 9.10 μg/mL, with IQR 5.35–19.30 μg/mL (although means and standard deviations could be calculated, they are not useful since the distribution is far from normal).
Figure 1.
Histograms of urine albumin for males and females from NHANES 2017–18 for participants aged 19–29.
It can also be useful, statistically, to state the range of values in the sample. For men, the range is 0.60–102.30 μg/mL, and for women, 0.60–244.00 μg/mL. The lowest values are above the limit of detection – no measurements require to be set to a minimum value after falling below the limit of detection (LOD). This is important because zero values and values below the LOD can sometimes cause difficulties with transformations.
Which transformation?
The albumin data are typical of the values reported for many assays. The values are either positive or zero – never negative – and there is a long tail to the right of higher values. One suitable transformation might be the square root. Importantly, this is valid even if there are zero values. When there are no zero values then a reciprocal transformation (1 divided by the value) may be useful, or a logarithmic transformation. The aim of all transformations is to produce a reasonably symmetric distribution. This provides a good basis for further statistical techniques. The transformed distribution need not be totally normal, although if it is, that would enable more confidence in tests based on smaller samples and might simplify statistical modelling of albumin.
If there are many zero values, then methods beyond the scope of this article will be required. If there are just a few (less than 2%), then reciprocal and logarithmic transformations may still be used after adding a small positive number to all values. Logarithm of zero is not well defined (minus infinity) and neither is 1/0 (infinity); adding a small number avoids this embarrassment. An example of such a transformation is the function y = 1/(0.01 + x) where x is the original measurement. Here, 0.01 has been chosen as a small value that makes little difference to the measurement but enables the transformation to be valid, that is, provide sensible values for all measurements.
Natural logarithm or common logarithm
It is possible to use either natural logarithms – to base e – or common logarithms – to base 10. The method is the same. The advantage of common logarithms is that they are more readily ‘interpreted’ or checked. For example, a log10 value of ‘2. xxx’ will lie between 100 and 1000 since log10 (100) = 2 and log10 (1000) = 3.
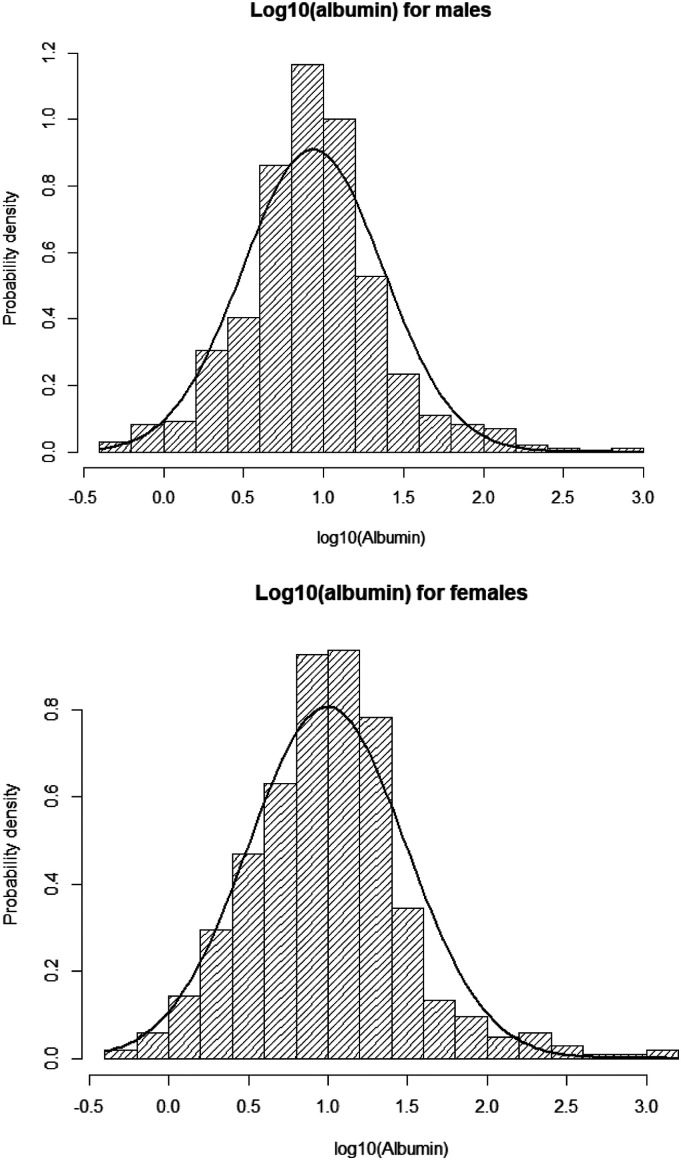
The transformed distributions, using a log10 transformation, are shown in Figure 2. This includes a fitted curve representing the normal distribution, with the same mean and standard deviation. Although the Shapiro–Wilk test, the most efficient test for normality, fails for both males and females, the fits do not visually appear to be poor. The symmetric shape of the distribution ensures that for these sample sizes, Welch’s t-test comparing the log10 (albumin) values of males and females will be valid. 2 This is because the Welch t-test takes advantage of the central limit theorem – it compares means which will be normally distributed. The test statistic is t = 2.087 with 1012.2 degrees of freedom so that the p value is 0.0372; according to this statistical test, there is a significant difference in the mean values of log10 (albumin) (0.933 for males and 0.995 for females).
Figure 2.
Histograms for log10 (albumin) for males and females.
It is not essential to transform albumin values in order to test the difference in the distributions. A log transformation however provides the opportunity to use a Welch t-test which had good validity. Had no transformation been used, then testing might have been instead undertaken with a non-parametric Wilcox rank sum test of the medians which yields a p value of 0.026. Although non-parametric, this test does assume that the distributions of males and females differ only by their median, that is, there is a shift up or down. In contrast, the Welch t-test tests a difference in means while allowing for a difference in variance or spread. This is why log transformation followed by a Welch t-test is preferred.
Back transformation
It is more helpful to think on the original scale (μg/mL) than on a logarithmic scale. A back transformation is therefore needed. For common logarithms, this is achieved by raising to the power 10. So, means transform, respectively, from 0.933 to 100.933 = 8.6 μg/mL and 0.995 to 100.995 = 9.9 μg/mL. Note that these are not the arithmetic means of the urine albumin measurements (which are 16.5 and 25.9 μg/mL). Instead, they are the geometric means, defined for measurements y1 … yn to be the nth root of the product of them all. Note that zero values will cause problems here, and so need to be handled with care.
Reference intervals
A reference interval might be obtained by (a) transforming measurements so that they are normally distributed, (b) calculating a reference interval on the transformed scale, and then (c) transforming back (see, for example, Shine 2008 3 ) Since we have shown differences in urine albumin between males and females, two separate reference intervals will have to be derived. This is not a textbook example, but rather an example based on real data with real issues.
The log transformations have not produced normal distributions; although close to normal, there are discrepancies in the upper tails of the distribution which will violate the assumptions necessary for the first method provided here (log transformation). It is included to illustrate the method and to show how the method can induce errors.
For males, the log-transformed variable has a mean of 0.934 and a standard deviation of 0.439. Under the – false – assumption of normal distribution, the reference interval for log10 (albumin) is (0.934 ± [1.96*0.439]) or (0.074–1.794). Transforming back by taking antilogarithms, we get (100.074–101.794) or (1.2–62.2), that is, a reference interval of 1.2–62.2 μg/mL is suggested. Note that we will have doubts about the upper limit since this is where the distribution of log10 (albumin) appears to vary from normality. The female sample has a mean of 0.995 and standard deviation, 0.495. Following the same procedure produces a reference interval of 1.2–92.2 μg/mL.
Transforming to a normal distribution and using 2.5% and 97.5% centiles of the fitted normal distribution can be useful when the sample size is small (fewer than 50 observations) and the approximation to normality is better, especially in the tails. In the NHANES example used illustratively here, the sample sizes are larger, and a reference interval can be obtained using the 2.5% and 97.5% centiles of the male and female urine albumin distributions. These are (1.1 and 88.3) for males and (1.1 and 155.1) for females. The reference intervals thus produced are 1–88 μg/mL for males and 1–155 μg/mL for females. Note the differences in the upper reference limits compared to those based on log10 transformation. The assumption of a normal distribution by the latter method is violated by the presence of values in the upper tails that are inconsistent with a normal distribution. This might occur if, say, some participants in NHANES have kidney disease and therefore elevated albumin in their urine.
Consider the impact that outliers might have on the dataset. These are often defined as observations that lie 1.5 times the size of the IQR beyond the upper and lower quartiles. Shine recommends their removal. 2 For the male sample, this means removing values that lie above (1.5*(15.47–4.55) + 15.47) = 31.85, that is, 32 μg/mL. None are removed at the lower end since (1.5*[15.47–4.55]) is larger than 4.55 and all values are positive. For the female sample, the same process results in removal of values above 40 μg/mL. Removing outliers however does not ‘fix’ the lack of fit (for normality) in the tail area around the 2.5% and 97.5% percentiles in this example. Substantial differences remain between the direct percentile method and the method based on transforming to a ‘normal’ distribution.
Summary
This illustration has used data from a real sample. The uses of log transformation were illustrated along with potential for error. For comparing distributions, the Wilcox rank sum test was more straightforward, and for reference intervals, log transformation led to potential errors where the approximation to the normal distribution of log10 (albumin) was not ideal due to potential contamination in the upper tail.
Acknowledgements
The assistance of the ACB editorial team was much appreciated.
Footnotes
Declaration of conflicting interests: The author(s) declared no potential conflicts of interest with respect to the research, authorship, and/or publication of this article.
Funding: The author(s) received no financial support for the research, authorship, and/or publication of this article.
Ethical approval: None required as the data analysed are publically available.
Guarantor: RMW.
Contributorship: RMW is the sole contributor.
ORCID iD
Robert M West https://orcid.org/0000-0001-7305-3654
References
- 1.National Center for Health Statistics . National Health and Nutrition Examination Survey. Hyattsville, MD: National Center for Health Statistics; 2020. https://wwwn.cdc.gov/nchs/nhanes/search/datapage.aspx?Component=Laboratory&CycleBeginYear=2017. accessed 19 June 2021. [Google Scholar]
- 2.West RM. Best practice in statistics: use the Welch t-test when testing the difference between two groups. Ann Clinical Biochemistry. 2021;58(4):267–269. [DOI] [PubMed] [Google Scholar]
- 3.Shine B. Use of routine clinical laboratory data to define reference intervals. Ann Clin Biochem Int J Lab Med. 2008;45:467–475. [DOI] [PubMed] [Google Scholar]


