

Abstract
Cytochrome P450 (CYP) 2E1 was suggested to be the major enzyme involved in trichloroethylene (TRI) metabolism and TRI-induced hepatotoxicity, although the latter molecular mechanism is not fully understood. The involvement of CYP2E1 in TRI-induced hepatotoxicity and its underlying molecular mechanism were studied by comparing hepatotoxicity in cyp2e1+/+ and cyp2e1−/− mice. The mice were exposed by inhalation to 0 (control), 1000, or 2000 ppm of TRI for 8 h a day, for 7 days, and TRI-hepatotoxicity was assessed by measuring plasma alanine aminotransferase (ALT) and aspartate aminotransferase (AST) activities and histopathology. Urinary metabolites of trichloroethanol and trichloroacetic acid (TCA) were considerably greater in cyp2e1+/+ compared to cyp2e1−/− mice, suggesting that CYP2E1 is the major P450 involved in the formation of these metabolites. Consistent with elevated plasma ALT and AST activities, cyp2e1+/+ mice in the 2000 ppm group showed histopathological inflammation. TRI significantly upregulated PPARα, which might function to inhibit NFκB p50 and p65 signalling. In addition, TRI-induced NFκB p52 mRNA, and significantly positive correlation between NFκB p52 mRNA expression and plasma ALT activity levels were observed, suggesting the involvement of p52 in liver inflammation. Taken together, the current study directly demonstrates that CYP2E1 was the major P450 involved in the first step of the TRI metabolism, and the metabolites produced may have two opposing roles: one inducing hepatotoxicity and the other protecting against the toxicity. Intermediate metabolite(s) from TRI to chloral hydrate produced by CYP2E1-mediated oxidation may be involved in the former, and TCA in the latter.
Keywords: Trichloroethylene, CYP2E1, Metabolism, Hepatotoxicity, PPARα, NFκB
Introduction
Trichloroethylene (TRI) is a chlorinated solvent that has been used to remove grease from metal parts or lenses and as a constituent in other chemicals. Because it is extensively used in consumer products and industrial applications, more than 3.5 million individuals are estimated to be exposed to TRI annually (NTP, 1990). The occupational exposure to TRI is declining in fully industrialized countries due to technological innovation and legislation (Grote et al., 2003), but it is increasing in the emerging industrialized countries, especially in Asia (Huang et al., 2002).
Studies conducted in animals reported that exposure to TRI causes renal damage (Mensing et al., 2002) and impaired reproductive function in male mice (Forkert et al., 2002). Moreover, TRI exposure at high concentrations was found to affect the immune system (Kaneko et al., 2000) and to induce autoimmune hepatitis in autoimmuneprone MRL mouse model (Griffin et al., 2000). Human exposure to TRI leads to damaging health effects such as disturbances in the central nervous system, cardiac arrhythmias, and renal and hepatic damage (ASTDR, 1997). A retrospective study of aircraft workers has suggested a correlation between TRI and renal disease (Radican et al., 2006). Low-level exposure to TRI negatively impacted hepatic function among Japanese workers (Nagaya et al., 1993). In addition to these adverse effects, a recent clinical study revealed that TRI causes severe hypersensitive skin damage associated with impaired hepatic function (Huang et al., 2006; Kamijima et al., 2007).
TRI is metabolized through two pathways: either oxidation by cytochrome P450 (CYP) as a major one or conjugation with glutathione (GSH) as a minor one. The liver is the primary site where TRI is oxidatively metabolized to the initial metabolite TRI-epoxide, and this intermediate metabolite is then converted to chloral hydrate (CH), which is rapidly metabolized to trichloroacetic acid (TCA) and trichloroethanol (TCE) via aldehyde dehydrogenase and alcohol dehydrogenase, respectively (Lash et al., 2000). Some CYPs such as CYP1A1/2, CYP2B1/2, CYP2C11 and CYP2E1 were reported to be involved in the hepatic metabolism of TRI (Nakajima et al., 1990; Guengerich et al., 1991). Among these P450s, CYP2E1 is the most important due to its role in the conversion of TRI to CH in both humans and rodents (Nakajima et al., 1992), suggesting that CYP2E1 may also be responsible for the hepatotoxicity induced by TRI exposure.
Nakajima et al. (1988), Nakajima (1997) suggested an important role for CYP2E1 in TRI-induced hepatotoxicity by determining the relationship between induction of CYP2E1 by ethanol treatment and the elevation of TRI-induced hepatotoxicity. However, concerns remained with regard to the potential effects of the presence or absence of residual alcohol in the body. To avoid these potential effects, the role of CYP2E1 in chemical-induced hepatotoxicity can be investigated directly using cyp2e1−/− mice lacking CYP2E1 expression (Wong et al., 1998; Nakajima et al., 2005). Recently, it was reported that the hepatotoxicity following chemical exposure was contributed by the induction of nuclear factor kappa B (NFκB) (Jaeschke et al., 2002; Brasil et al., 2006). Activation of NFκB produced pro-inflammatory cytokines that are associated with liver injury (Laskin and Laskin, 2001). Nevertheless, it is not known whether NFκB activation contributes to TRI-induced hepatotoxicity.
In determining the role of CYP2E1 in TRI-induced liver damage and its molecular mechanism, TRI-induced hepatotoxicity was investigated by comparing toxicity in cyp2e1+/+ and cyp2e1−/− mice. NFκB-related signalling pathways were also determined in both mouse lines. The involvement of CYP2E1 in TRI-induced hepatotoxicity and the possible involvement of p52 could be demonstrated by resistance to TRI-induced hepatotoxicity in mice lacking CYP2E1.
Materials and methods
Chemicals.
TRI was a kind gift from the Japan Association for Hygiene of Chlorinated Solvent. Its purity was at least 99% as judged by gas chromatography-mass spectrometry (GC-MS). All other chemicals were purchased from commercial sources and were of the highest purity available.
Animals.
This study was conducted according to the Animal Experimental Guidelines of the Nagoya University Graduate School of Medicine. A pair of parental stocks of cyp2e1−/− and cyp2e1+/+ mice was shipped from the Laboratory of Metabolism, National Cancer Institute, Bethesda, MD, USA and housed in a room set at 12:12 light:dark cycle (lights on at 09.00 h and off at 21.00 h), with stable relative humidity (57–60%) and a constant temperature (23–25 °C). Food and water were provided ad libitum. The mice were then bred and reared at the Institute of Laboratory Animal Research, Graduate School of Medicine, Nagoya University. Eighteen cyp2e1−/− male mice of an Sv/129 genetic background and 18 wild-type male Sv/129 mice were used in this study. When mice reached 10-weeks-old (body weight approximately 25 g), each strain was randomly divided into 3 groups of 6 animals each.
Exposure to TRI.
The inhalation route was selected to simulate workplace conditions in which workers are exposed to TRI primarily by inhalation. In the previous experiment, we demonstrated that 1000 or 2000 ppm of TRI for 8 h significantly elevated plasma AST activity in rats (Nakajima et al., 1988), which was the basis for selecting these two dosages in the present study. These concentrations are much higher than observed in the usual occupational exposure settings, but sometimes occur when an immersion tank for defatting process with TRI is cleaned up (Nakajima et al., 1980). The three groups of both genotypes were exposed to 1000 ppm, 2000 ppm TRI or fresh air in an inhalation chamber for 8 h a day for 7 consecutive days. Daily exposure commenced at 09.30 and was terminated at 17.30 h. TRI concentrations in the chamber were measured every 10 s by gas chromatography and digitally controlled to within ±5% of the target concentration. While being exposed or unexposed to TRI on the 1st, 4th, and 7th day of exposure, the mice were housed in individual metal metabolism cages to collect urine from individual mice.
After 7 days of exposure, 6 mice in each group were killed by exsanguination through the abdominal aorta under pentobarbital anesthesia and subjected to necropsy. Blood obtained from the abdominal aorta was directed into heparinised tubes, and separated by centrifugation at 3000 rpm for 10 min. The liver was then dissected out carefully and weighed immediately. A small liver section was excised from the median lobe of each mouse, and fixed in 10% neutral buffered formalin.
Determination of serum aminotransferase activities.
The aspartate aminotransferase (AST) and alanine aminotransferase (ALT) activities were measured by the colorimetric method using a Transaminase C II Test Kit (Wako, Osaka, Japan).
Measurement of metabolites in urine.
Urinary trichloroethanol (TCE) and trichloroacetic acid (TCA) concentrations were measured by gas chromatography-mass spectrometry (GC-MS, Agilent Technology) under the analytical conditions referred to using a published method (Song and Ho, 2003) with slight modifications. ß-Glucuronidase (196 U) was added to urine samples (200 μl) and incubated overnight at 37 °C. 45 μl of 0.1 M sulfuric acid was added to the hydrolyzed urine sample plus an internal standard (dichloroacetic acid, 200 mM in methanol, 5 μl). The sample was then mixed with 500 μl of water-0.1 M sulfuric acid-methanol (6:5:1) and heated at 70 °C for 10 min to produce the derivatives. After cooling to room temperature, 500 μl of hexane-dichloromethane (1:1) was added to the mixture for extraction, and mixed by shaker for 20 min. After 2 min without agitation, the mixture was centrifuged at 900 ×g for 15 min and the supernatant solution (1 μl) injected into the GC-MS.
Details of the GC-MS method (Agilent Technologies, GC: 6890N, MS: 5975, injector: 7683B series, autosampler: 7683 series) were as follows: capillary column, HP-5MS; carrier gas, helium with velocity of 1.0ml/min; oven temperature, 50 °C (3 min) – 50 °C/min – 200 °C (2 min); temperature of injection port, MSD transfer line, ion source, and quadropole, 150 °C, 280 °C, 230 °C, and 150 °C, respectively; analysis mode, EI; positive ion, 70 eV; SIM parameter: dichloroacetic acid (internal standard) 59 m/z, TCE 49 m/z, TCA 59 m/z. The detection limit of the present GC-MS method was 0.10 mg/l for TCE and 0.22 mg/l for TCA.
Histopathology.
Tissue blocks were embedded in paraffin and cut into 5-μm thick sections that were then mounted on glass slides, and stained with hematoxylin and eosin (H & E). Photomicrographic images were captured on an Olympus digital camera-equipped microscope. The histological changes in the liver were scored based on the following scheme: 0, no necrosis; 1, minimal, defined as only occasional necrotic cells in any lobule; 2, mild, defined as less than one-third of the lobular structure affected; 3, moderate, defined as between one-third and two-thirds of the lobular structure affected; and 4, severe, defined as greater than two-thirds of the lobular structure affected (Soni et al., 1998).
Real-time quantitative PCR.
mRNAs encoding NFκB p65, p52, p50; peroxisome proliferator-activated receptor alpha (PPARα), very long chain acyl-CoA dehydrogenase (VLCAD), peroxisomal bifunctional protein (hydratase+3-hydroxyacyl-CoA dehydrogenase) (PH), CYP4A10, inhibitor of kappa B (IκBα) and tumor necrosis factor receptor 1 and 2 (TNFR1 and TNFR2) were monitored on an ABI PRISM 7000 Sequence Detection System (Applied Biosystems, Foster City, CA, USA). The sequences for the forward and reverse primers were as follows: β-actin (GI191581) forward: 5α-ACCACAGCTGAGAGGGAAATCG-3′ and reverse: 5′-AGAGGTCTTTACGGATGTCAACG-3′; CYP4A10 (GI37382629) forward: 5′-ACACTGCTCCGCTTCGAACT-3′ and reverse: 5′-CAGCACAAGTCGGGCTAAGG-3′; TNFR1 (GI158533987) forward: 5′-CTGTTCAGAAATGGGAAGACT-3′ and reverse 5′-TCGCAAGGTCTGCATTG-3′; TNFR2 (GI76253923) forward: 5′-GCCAGATCTCACAGGAATAC-3′ and reverse: 5′-TGGCCAGGAGGACACTTA-3′. The sequences of other genes were described elsewhere (Ito et al., 2007).
Total RNA was isolated from the liver using the RNeasy Mini Kit (QIAGEN, Tokyo, Japan). DNase digestion with the RNase-Free DNase Kit (QIAGEN) was used to remove contaminating genomic DNA. Seventy ng of total RNA was reverse transcribed into cDNA in a 20-μl reaction solution containing Oligo(dT)20 primers and SuperScript™III reverse transcriptase (Invitrogen) according to the manufacturer’s instructions. The PCR reaction volume (25 μl) contained 1× SYBR Green PCR Master Mix (Applied Biosystems), 0.1 μM of each forward and reverse primer, and cDNA diluted with TE including 1 μg/mL transfer-RNA. Reactions were run for 50 cycles (denaturation at 95 °C for 15 s, annealing and extension at 60 °C for 1 min) following an initial 2-min step at 50 °C for enzyme activation and a 10-min incubation at 95 °C. The results were normalized to the level of the housekeeping gene β-actin-mRNA expression and were shown relative to the control level in the cyp2e1+/+ mice.
Western blot analysis.
Nuclear fraction was extracted from a part of liver using a kit of protein extraction reagent T-PER (PierceBiotechnology, Rockford, IL, USA). Samples of liver homogenate (VLCAD, PH, IkBα, TNFR1, TNFR2) and nuclear fraction (NFκB p65, p50, p52; PPARα) were subjected to 10% polyacrylamide gel electrophoresis and then transferred to nitrocellulose membranes (Bio-Rad). After blocking with 3% nonfat milk in Tris-buffered saline (TBS) for 1 h at room temperature, membranes were incubated with respective primary polyclonal antibodies against NFκB p65, p50, p52, IκBα, PPARα, TNFR1, and TNFR2 (Santa Cruz Biotechnology Inc., Temecula, CA, USA), and PH and VLCAD, which were used elsewhere (Aoyama et al., 1998; Nakajima et al., 2000), overnight at 4 °C. After washing the membranes with TBS and TBS containing 0.1% Tween-20, the membranes were incubated with alkaline phosphate-conjugated goat anti-rabbit IgG (Jackson ImmunoResearch, West Grope, PA, USA). The specific immune complexes were detected by 1-Step™ NBT\BCIP (Pierce Biotechnology, Rockford, IL, USA). Each band was quantified by densitometry using the Lane and Spot Analyzer version 5.0 (ATTO corporation, Tokyo, Japan).
Statistical analysis.
Data were expressed as mean ± SD. Two-way analysis of variance (ANOVA) was conducted to examine the effects of two factors, gene and TRI exposure, and their interaction, followed by Dunnet’s test to compare the effects of exposure. Pearson’s correlation coefficient analysis was performed with plasma ALT activity for expression of NFκB p52 mRNA or amount of urine metabolite excreted on 7th day of exposure. Histopathological changes obtained were evaluated by Wilcoxon’s rank-order analysis. The significant statistical difference was set at p<0.05.
Results
Liver and body weight
Table 1 shows the changes in the body weight, liver weight and liver/body weight ratios in cyp2e1+/+ and cyp2e1−/− mice after TRI treatment. Significant differences in liver weight and liver/body ratios were seen between the non-exposed control group of cyp2e1−/− and cyp2e1+/+ mice. Body weight was not significantly increased in either mouse line following TRI exposure. In contrast, liver weight and liver/body ratios were significantly increased in cyp2e1+/+ mice but not in cyp2e1−/− mice, suggesting that TRI influenced liver weight and liver/body ratios only in the wild-type mice expressing CYP2E1.
Table 1.
Body and liver weight after trichloroethylene treatment
| Mice | TRI (ppm) | N | Body weight (g) | Liver weight (g) | Liver/body (%) |
|---|---|---|---|---|---|
|
| |||||
| cyp2e1−/− | 0 | 6 | 24.48±1.44 | 1.45±0.10 | 5.47±0.23 |
| 1000 | 6 | 24.55±2.26 | 1.36±0.18 | 5.51±0.27 | |
| 2000 | 6 | 24.99±4.05 | 1.42±0.38 | 5.58±0.70 | |
| cyp2e1+/+ | 0 | 6 | 23.66±2.44 | 1.10±0.14a | 4.63±0.13a |
| 1000 | 6 | 24.52±1.17 | 1.62±0.06b | 6.62±0.40b | |
| 2000 | 6 | 24.94±1.78 | 1.80±0.16b | 7.24±0.84b | |
Significantly different (p<0.05) from 0 ppm group (control) in cyp2e1−/− mice.
Significantly different (p<0.05) from 0 ppm group (control) in cyp2e1+/+ mice.
Urine metabolite levels
Urinary TCE and TCA levels are shown in Figs. 1A and B. In the 0 ppm group in both mouse lines, TCE and TCA levels were below the detection limit. In a comparison between genotypes, levels of urinary TCE in the cyp2e1+/+ mice exposed to 1000 and 2000 ppm TRI were significantly different from those in cyp2e1−/− mice on the 1st day, but not the 4th (p=0.07) or 7th (p=0.05) day of exposure (Fig. 1A). Levels of TCA in the urine of cyp2e1+/+ mice exposed to 1000 ppm and 2000 ppm TRI on each day were significantly different from those in cyp2e1−/− mice (Fig. 1B). Interactions between the genotype and the dose were not significant in TCE or TCA on any day of exposure. In general, the urinary TCE level in cyp2e1−/− mice was less than half that in cyp2e1+/+ mice; urinary TCA levels in the former were about one-fourth those in the latter. These results suggest that the metabolism of TRI in both cyp2e1+/+ and cyp2e1−/− mice might have reached saturation at 1000 ppm TRI.
Fig. 1.
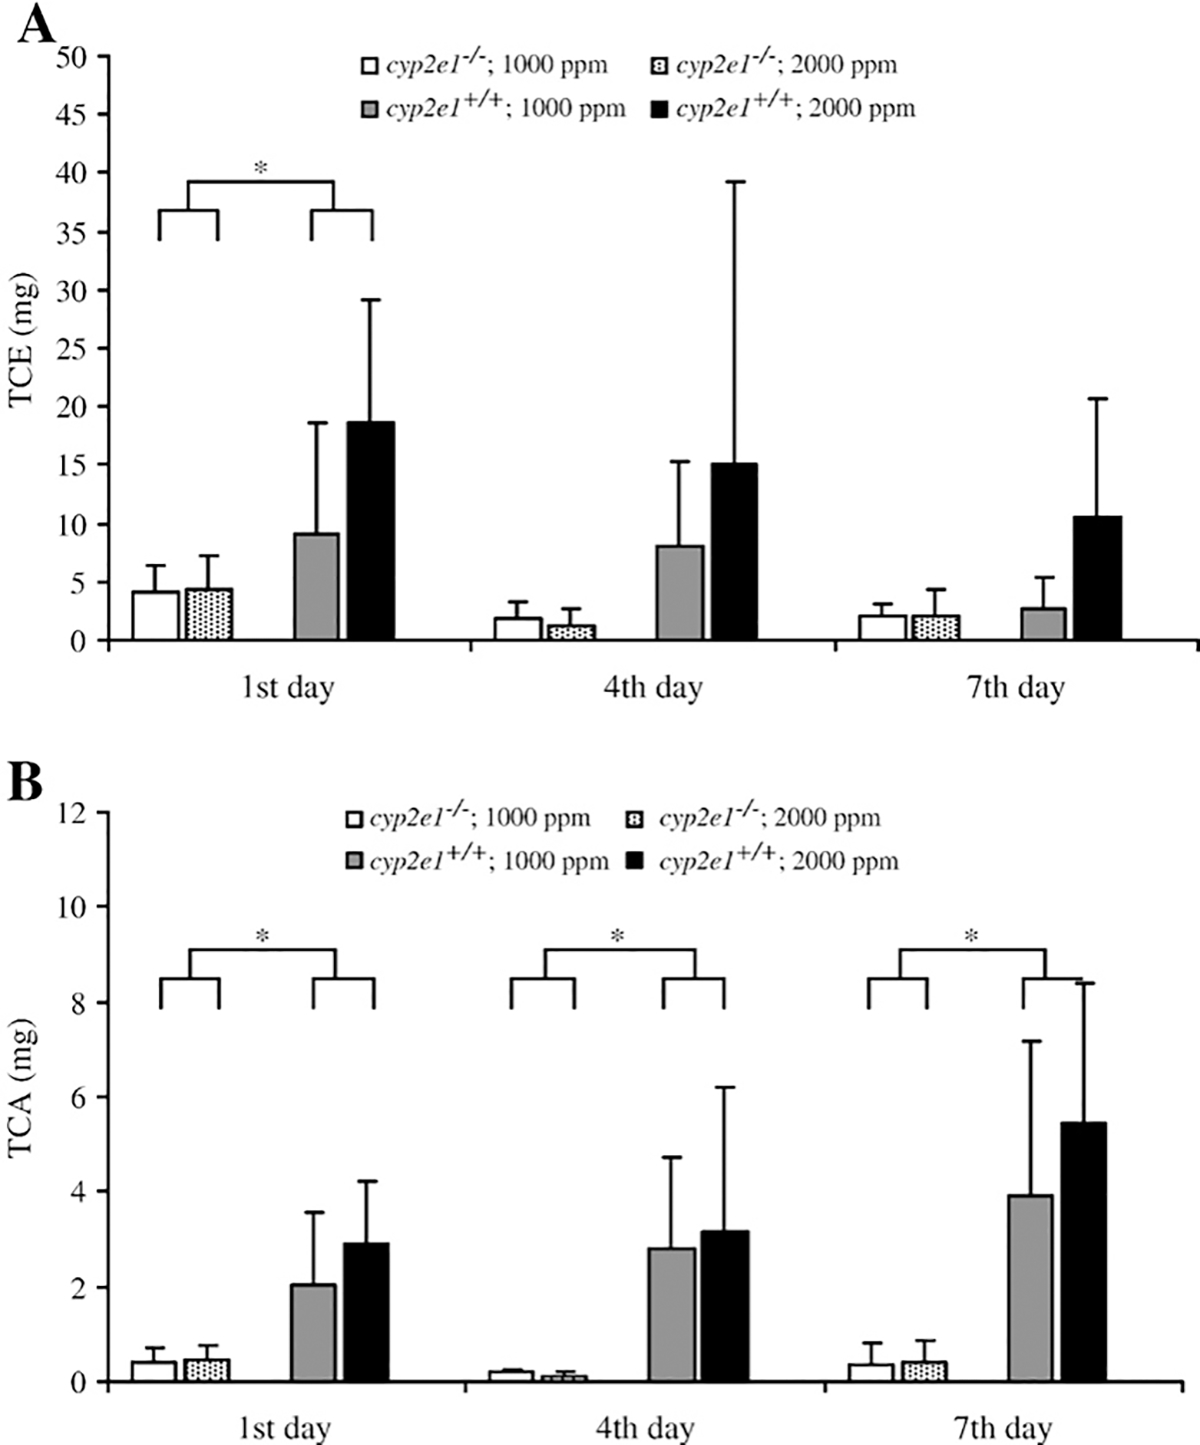
Amount of trichloroethanol (TCE) (A) and trichloroacetic acid (TCA) (B) on the 1st, 4th and 7th day of TRI exposure in cyp2e1+/+ and cyp2e1−/− mice. Values represent means ± SD for 5–6 mice per group. *Significant difference (p<0.05) between genotypes.
Biochemical changes
Plasma AST and ALT were used to assess the TRI-induced liver damage in cyp2e1+/+ and cyp2e1−/− mice. Plasma AST and ALT activities after TRI treatment in both groups of mice were significantly increased only in the 2000 ppm group of cyp2e1+/+ mice (Figs. 2A and B). A significant relationship between ALT activity and urinary TCE or TCA levels was observed (Fig. 3).
Fig. 2.
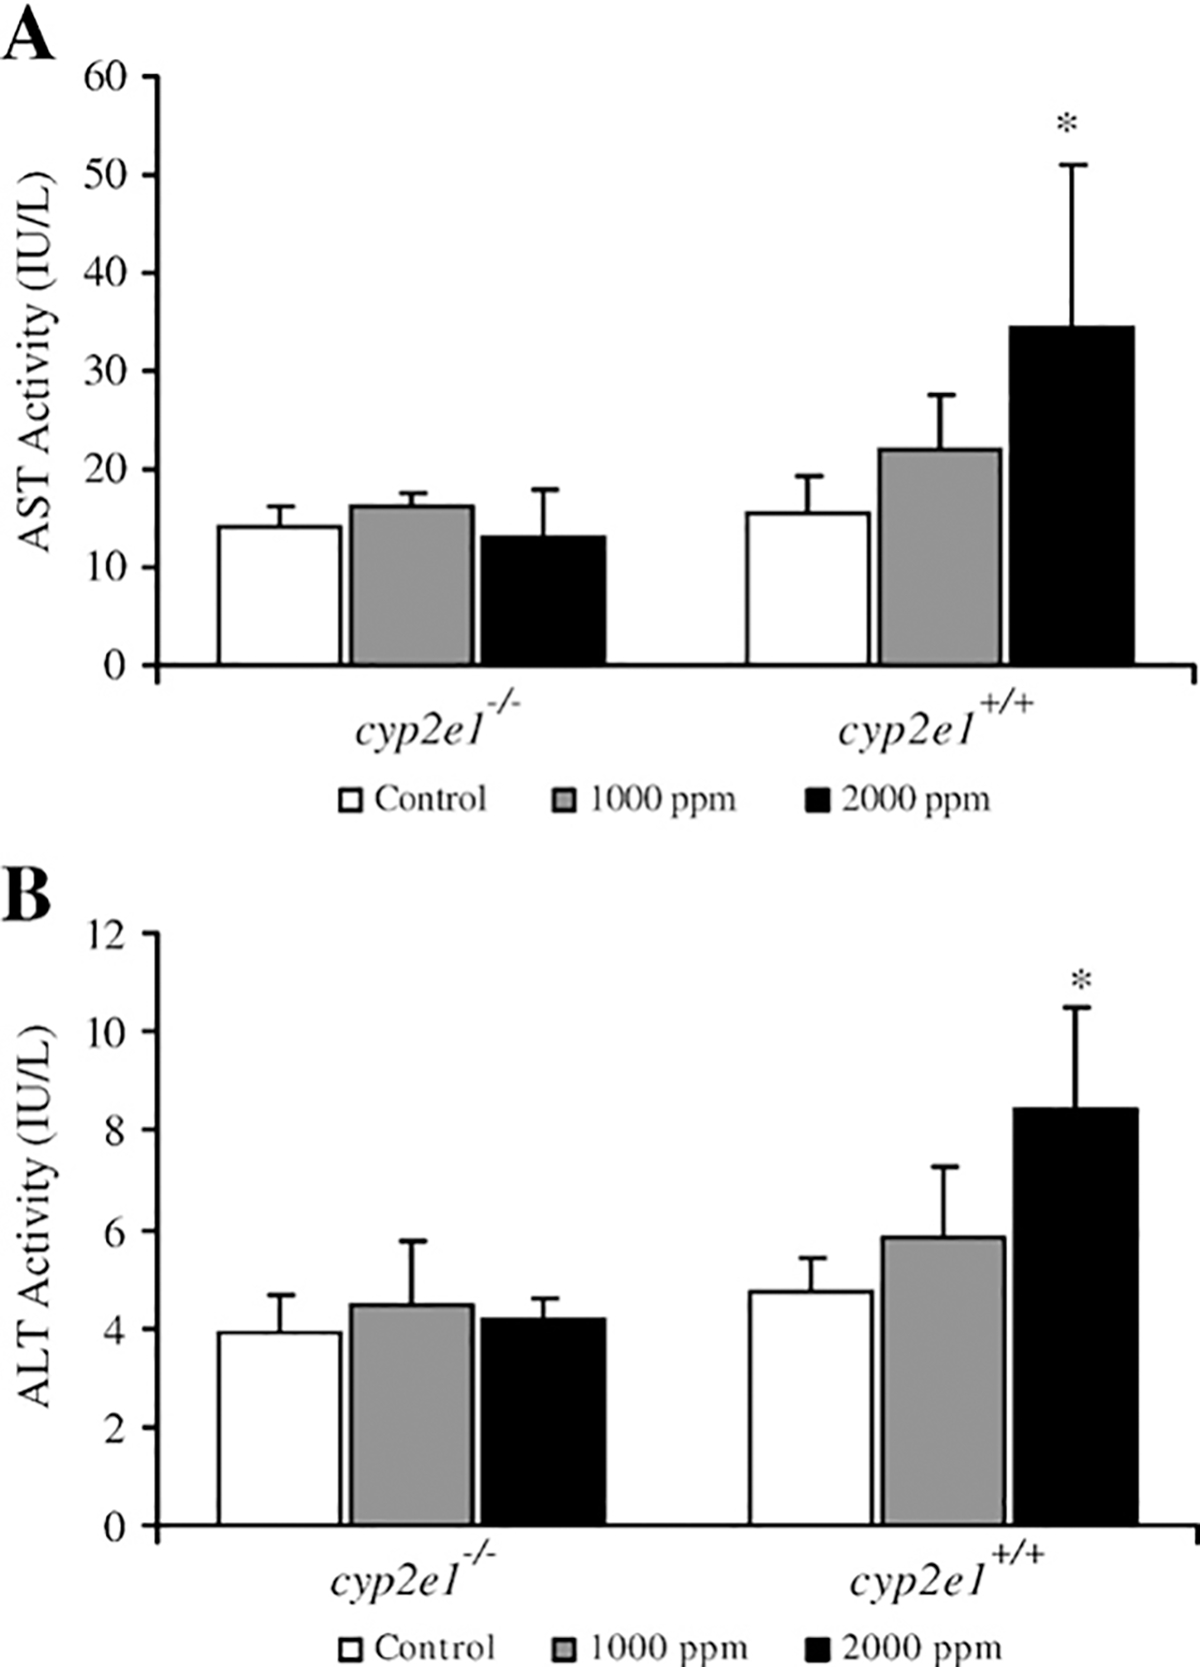
Plasma aspartate aminotransferase (AST) (A) and alanine aminotransferase (ALT) (B) activities in cyp2e1+/+ and cyp2e1−/− mice after treatment with TRI. Values represent means ± SD for 4–6 mice per group. *Significantly different (p<0.05) from 0 ppm group (control) in the same genotyped mice.
Fig. 3.
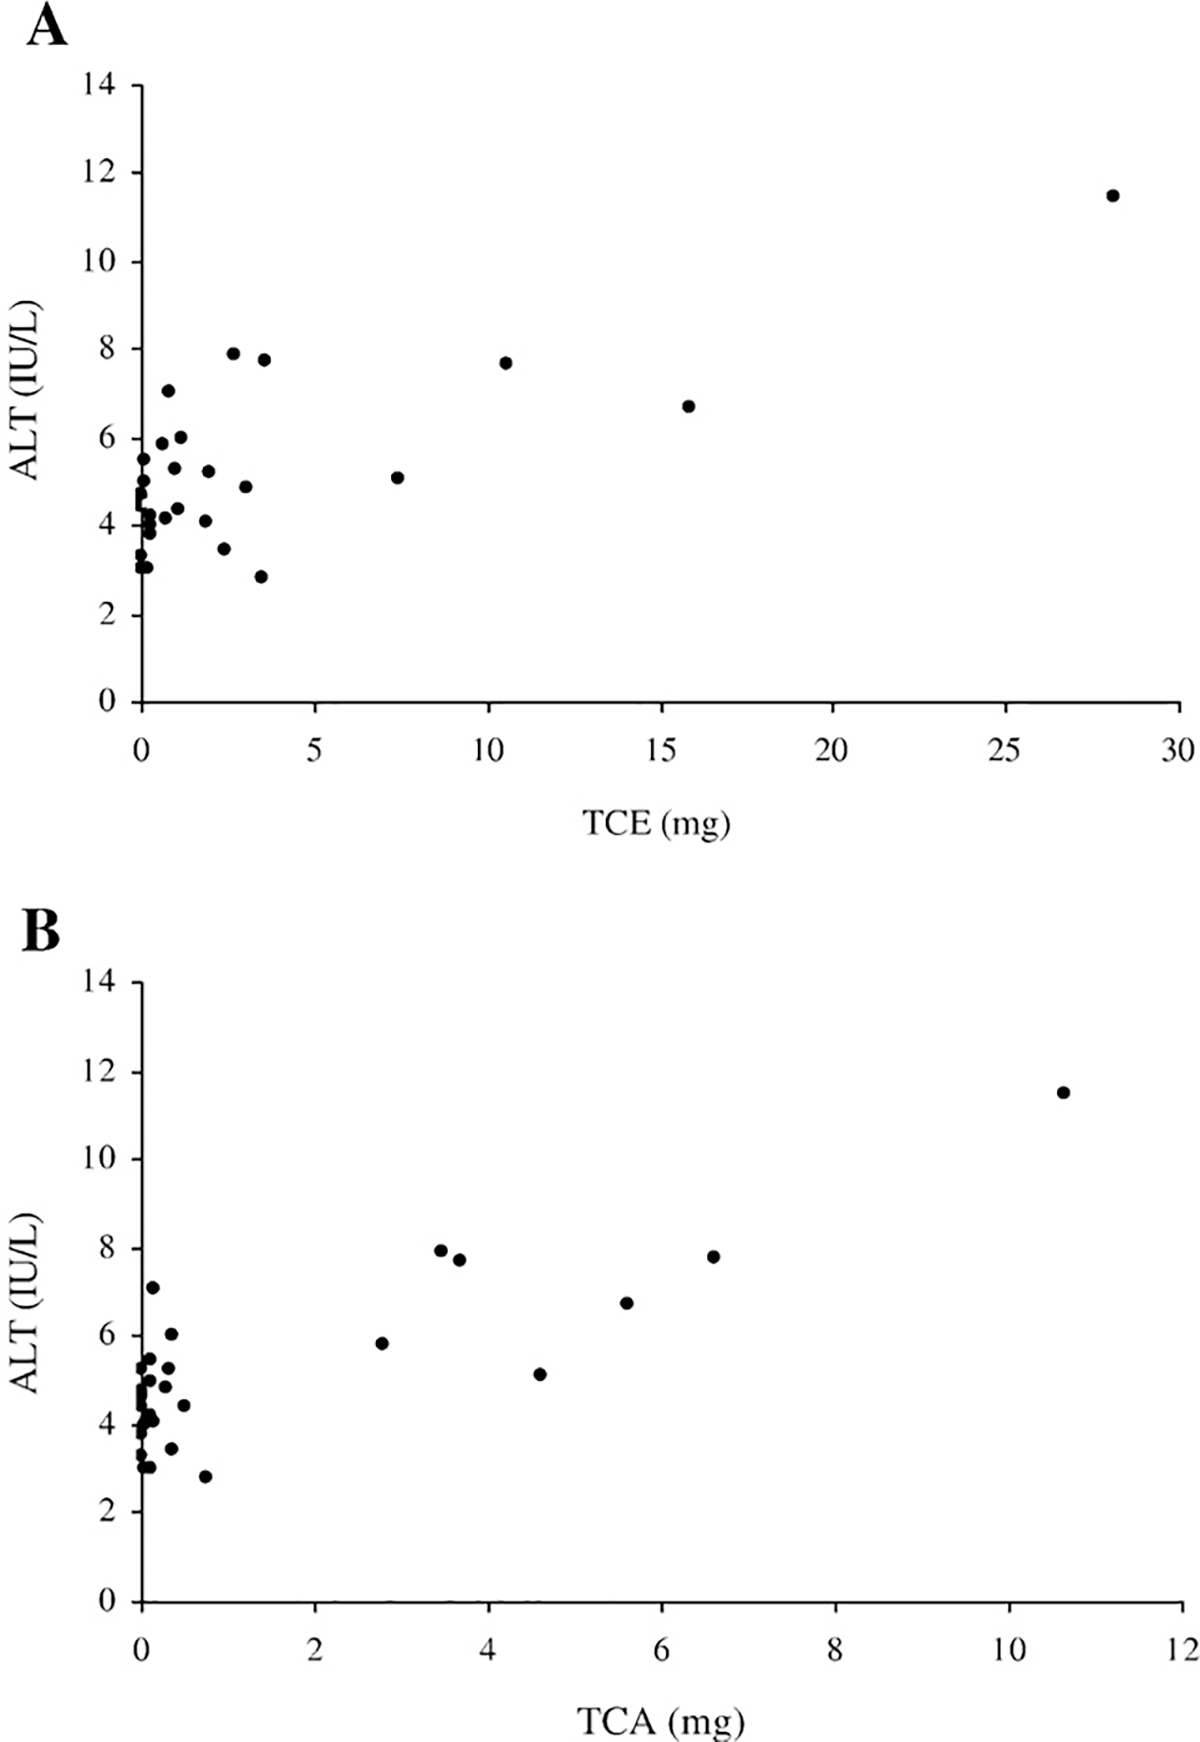
Relationship between ALT activity and amount of urine metabolites excreted on the 7th day of exposure. Correlation coefficients between plasma ALT activity and (3A) TCE (r=0.7331) and (3B) TCA (r=0.8169) were significant (p<0.05).
Histopathological analysis
The histopathological findings are presented in Fig. 4 and Table 2. In the control group of cyp2e1+/+ and all groups of cyp2e1−/−, no mice showed any overt signs of injury or abnormalities. In contrast, though not all mice showed histopathological abnormalities in the 1000 ppm group, cyp2e1+/+ mice exposed to both 1000 ppm and 2000 ppm TRI showed pathological changes. For example, in the 2000 ppm-treated cyp2e1+/+ mice, necrosis occurred in less than one-third of the lobular structure. Immunohistochemical analysis revealed that CYP2E1 was expressed mainly around the centrilobular area in cyp2e1+/+ mice where necrotic changes were induced (data not shown).
Fig. 4.
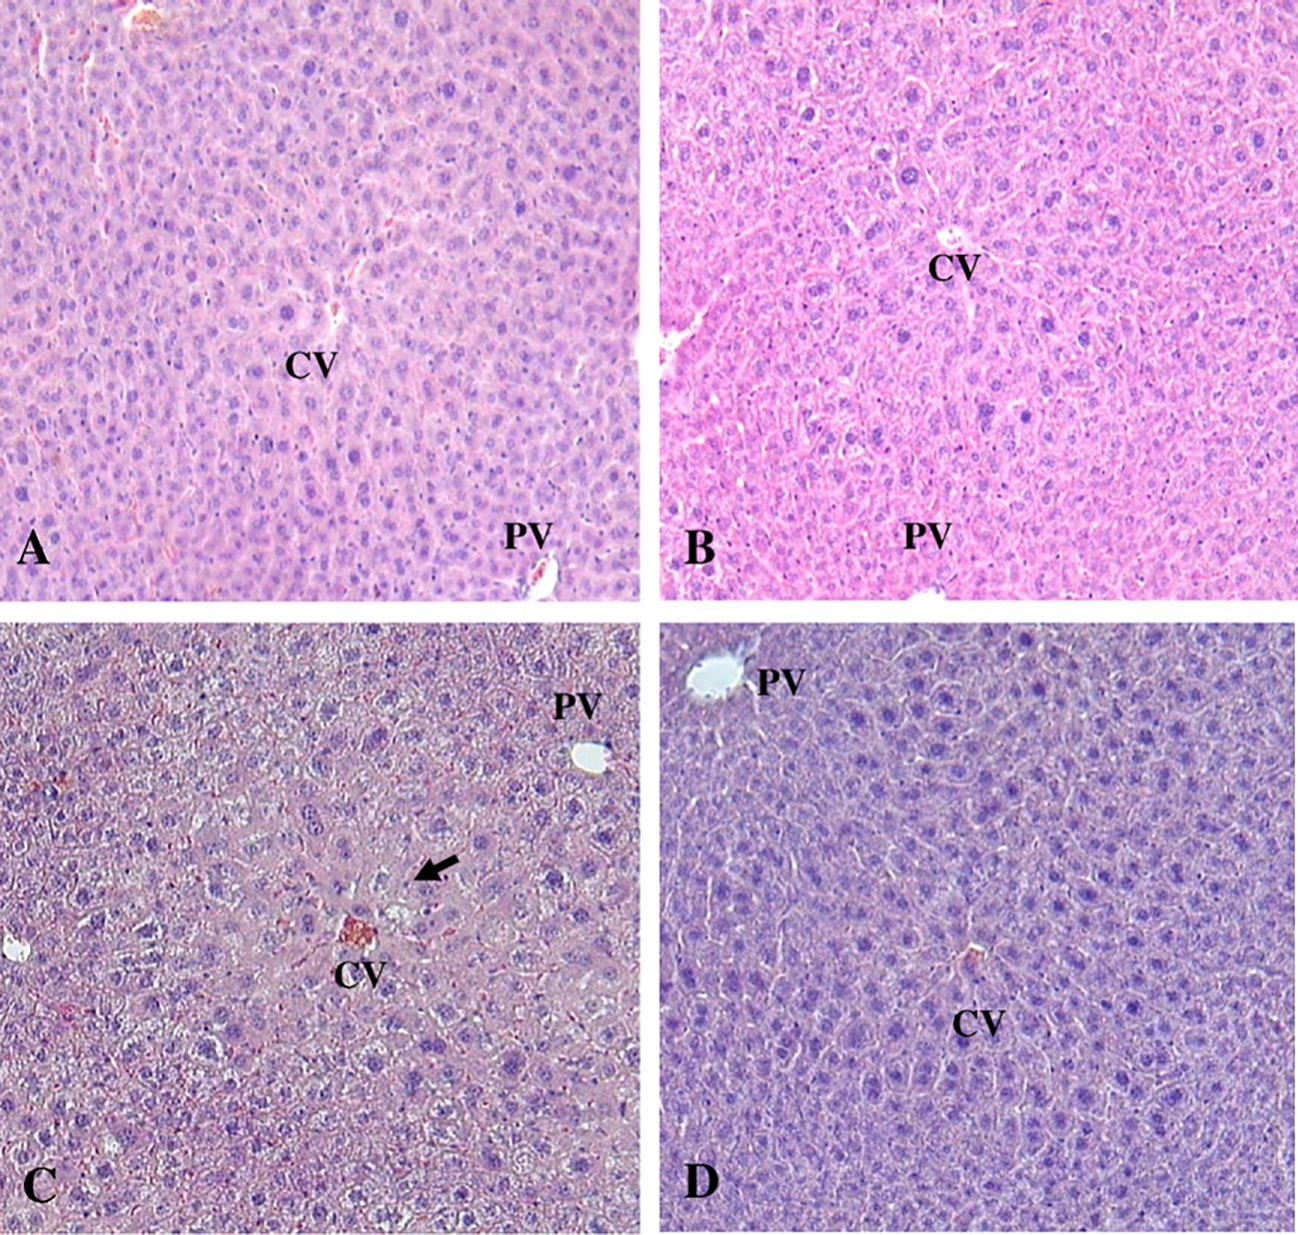
Liver histopathological findings after TRI treatment. All sections stained with H&E. (A) and (B), Liver section photomicrograph taken from cyp2e1+/+ and cyp2e1−/− mice treated with 0 ppm of TRI, respectively. Note that histological structure of the liver appeared normal. (C), Liver from cyp2e1+/+ mice treated with 2000 ppm of TRI. Mild histological changes around centrilobular area appeared (arrow). Infiltration of mononuclear inflammatory cells was not obvious. (D), Liver from cyp2e1−/− mice treated with 2000 ppm of TRI. No abnormal histological changes appeared in liver. PV, portal vein; CV, central vein; original magnification × 100.
Table 2.
Relative degree of hepatic injury
| Mice | TRI (ppm) | N | Histological score | |||||
|---|---|---|---|---|---|---|---|---|
|
| ||||||||
| cyp2e1−/− | 0 | 6 | 0 | 0 | 0 | 0 | 0 | 0 |
| 1000 | 6 | 0 | 0 | 0 | 0 | 0 | 0 | |
| 2000 | 6 | 0 | 0 | 0 | 0 | 0 | 0 | |
| cyp2e1+/+ | 0 | 6 | 0 | 0 | 0 | 0 | 0 | 0 |
| 1000 | 6 | 1–2 | 0 | 1–2 | 0 | 0 | 1 | |
| 2000 | 6 | 1–2 | 3 | 1–2 | 1 | 1–2 | 1–2* | |
Note: Liver sections were obtained from control mice and mice treated for 1 week with TRI. Hepatic injuries histopathologically detected were scored (from 0–4, ranging from no change to slightly/moderately and severely change) in hepatocytes as described in Materials and methods. Statistical differences were determined by Wilcoxon’s rank sum analysis using an alpha value equal to 0.05.
Significantly different (p<0.05) from 0 ppm group (control) in the same genotyped mice.
mRNA expression
The NFκB family, IκBα, and PPARα appear to be important in the mechanism of inflammation as suggested by increases in AST and ALT activity in response to TRI-inhalation. Indeed, one TRI metabolite, TCA, is a PPARα ligand as revealed by the finding that TRI treatment significantly induced PPARα-target genes in mice (Nakajima et al., 2000). In total, TRI exposure induced PPARα mRNA and its target genes only in cyp2e1+/+ mice (Figs. 5A–C). TRI exposure significantly increased the expression levels of PPARα, VLCAD and PH mRNA. In particular, the mRNA levels of microsomal enzyme CYP4A10 significantly increased in cyp2e1+/+ mice after TRI exposure in a dose-dependent manner (Fig. 5D).
Fig. 5.
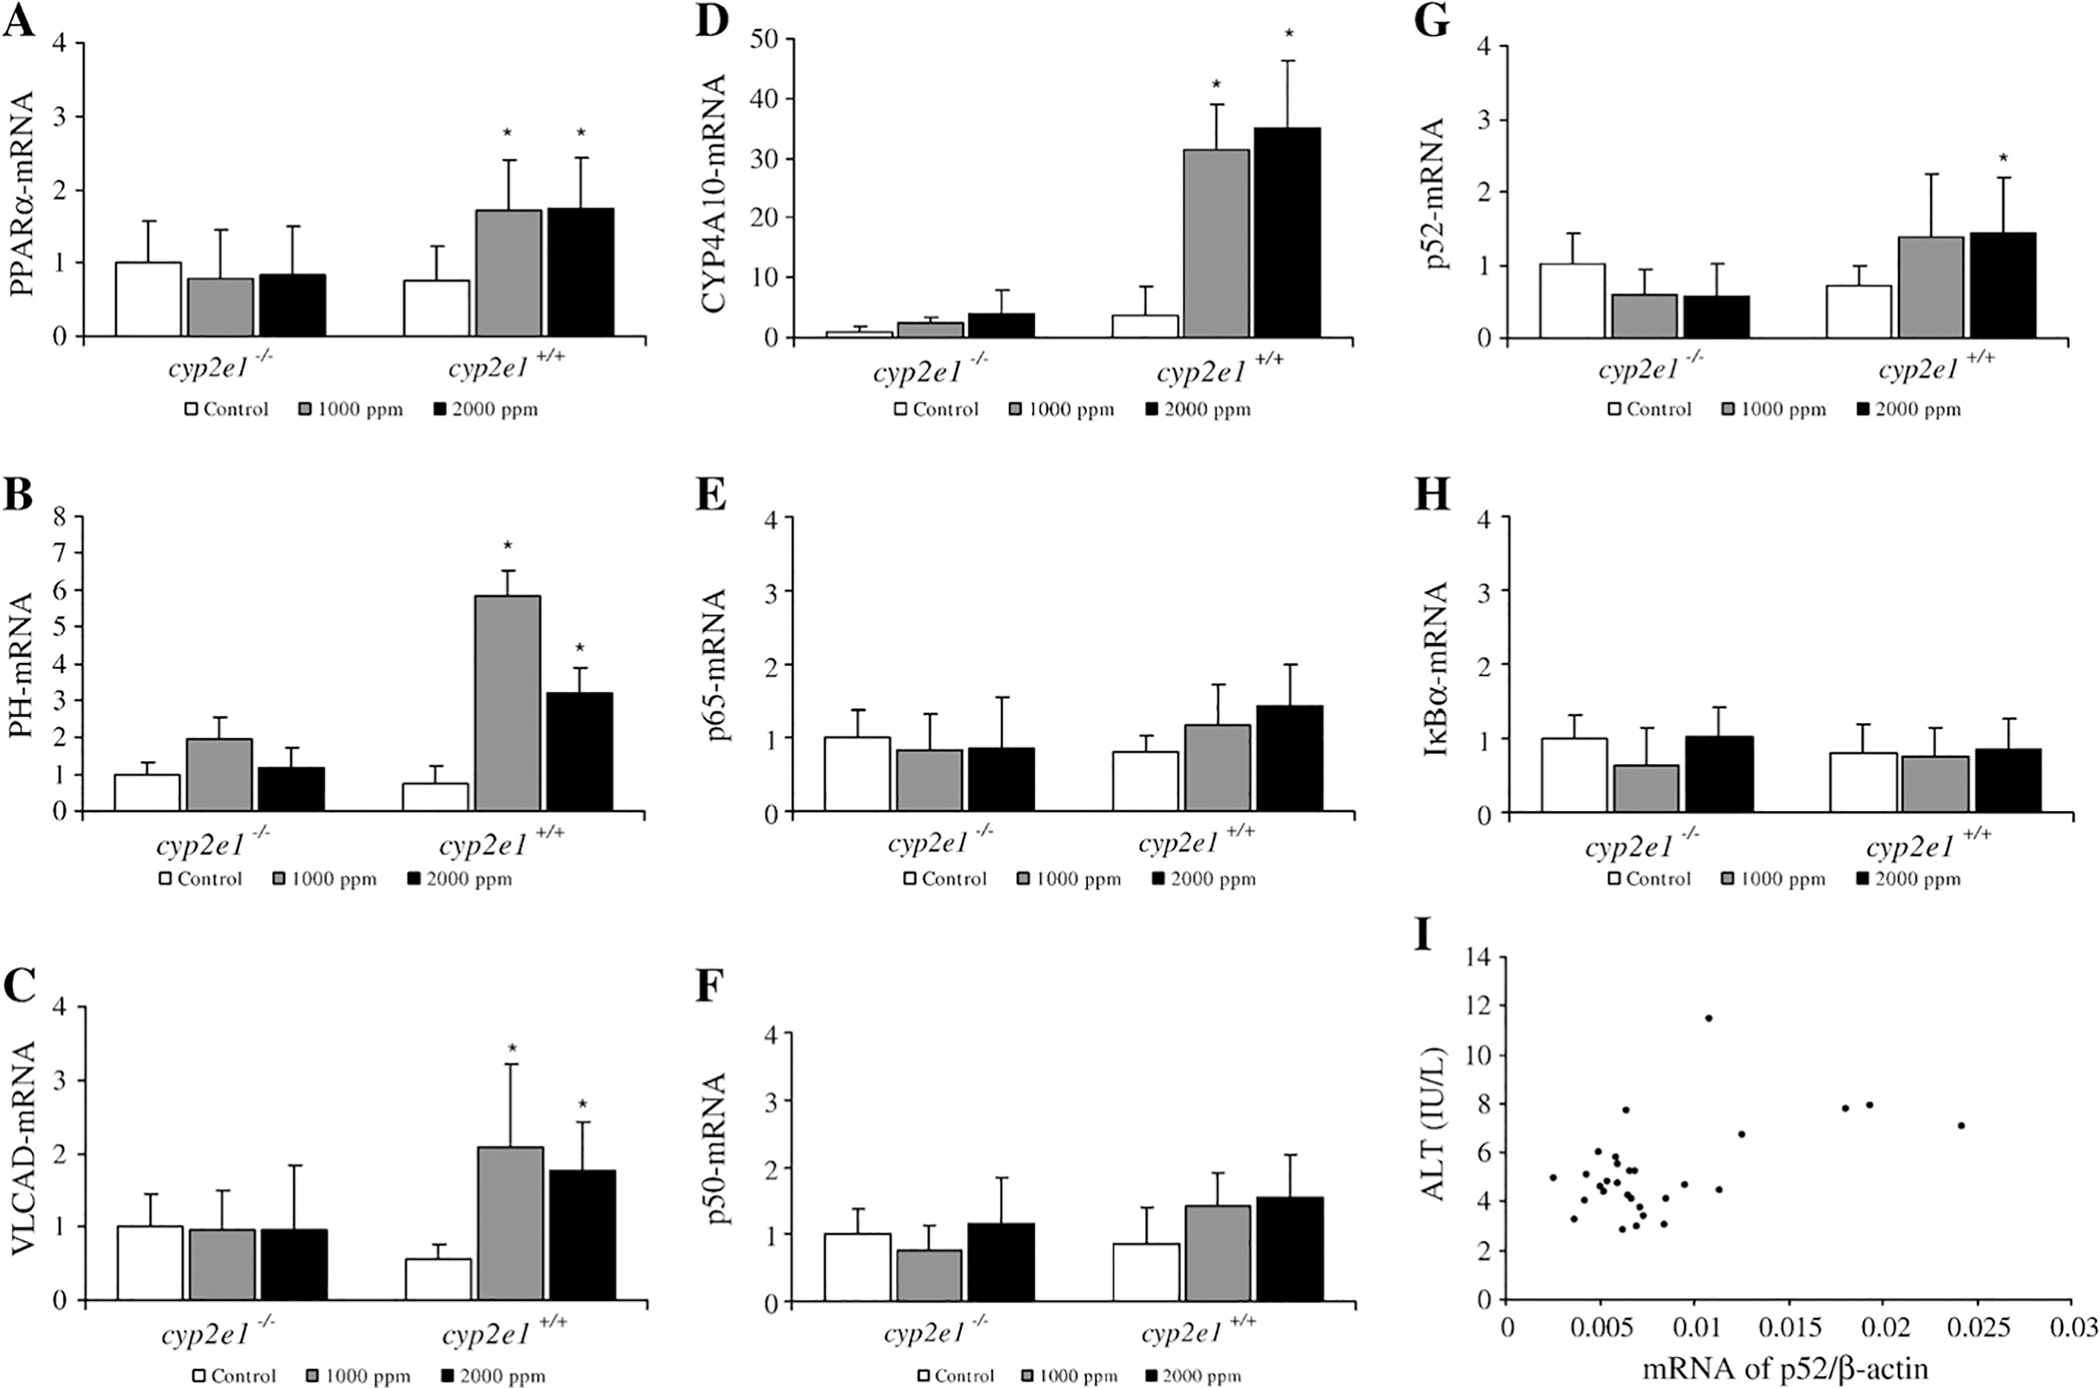
mRNA expression of PPARα (A), PH (B), VLCAD (C), CYP4A10 (D), NFκB p65, p50, p52 (E, F, G); and IκBα (H), in liver from cyp2e1+/+ and cyp2e1−/− mice after TRI exposure. Values represent means ± SD for 6 mice per group. NFκB, PPARα and IκBα mRNA levels were normalized to level of ß-actin mRNA in same preparation, and mean from each control group was assigned value of 1.0. *Significantly different (p<0.05) from 0 ppm group (control). (I) Correlation coefficient (r=0.5075) between plasma ALT activity and expression NFκB p52 mRNA was significant (p<0.05). All data both cyp2e1+/+ and cyp2e1−/− mice were plotted (n=29).
Overall, TRI exposure did not significantly increase the expression of p65 and p50 mRNAs in either cyp2e1+/+ or cyp2e1−/− mice (Figs. 5E–G). However, p52 mRNA expression significantly increased in the 2000 ppm group of cyp2e1+/+ mice, and correlation analysis showed that a significantly positive relationship existed between the expression of NFκB p52 mRNA and plasma ALT activity (Fig. 5I), while no correlation was seen between NFκB p65 or p50 and ALT activity (data not shown). In cyp2e1+/+ and cyp2e1−/− mice, IκBα mRNA were not significantly increased after TRI exposure (Fig. 5H). TRI treatment did not increase the expression of TNFR1 and TNFR2 mRNA in cyp2e1+/+ and cyp2e1−/− mice (data not shown).
Protein expression
In accord with the result of mRNA expression by real-time quantitative PCR, TRI exposure significantly induced protein levels of PPARα and its target genes PH and VLCAD only in cyp2e1+/+ mice (Fig. 6). Also, TRI treatment significantly increased the expression of NFκB subunit p52 protein. TRI did not influence p50 mRNA, but increased p50 protein. However, induction of p65 and IκBα protein was not seen (data not shown). Although TNFR1 and TNFR2 mRNAs were not increased significantly after TRI exposure, TNFR1 and TNFR2 protein were inducted only in cyp2e1+/+ mice.
Fig. 6.
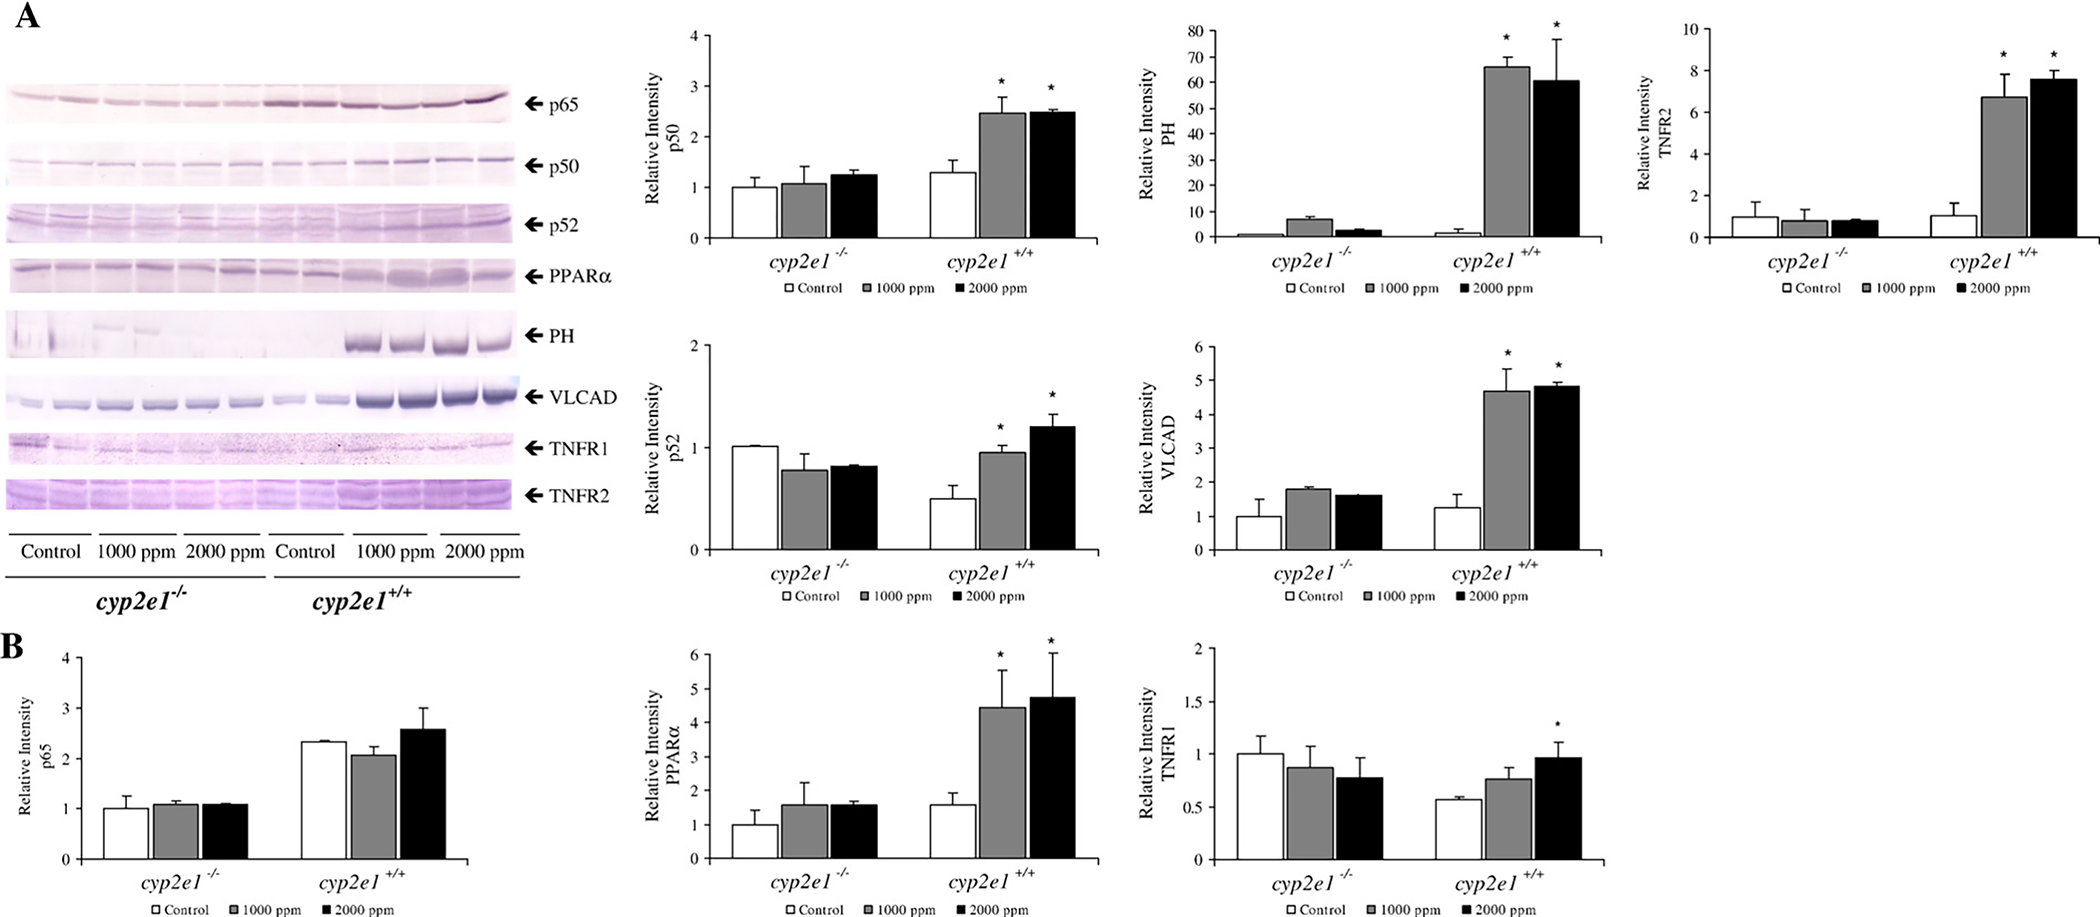
PPARα and NFκB protein expression in livers from cyp2e1+/+ and cyp2e1−/− mice after TRI exposure. (A) Western blot analyses of PPARα, PH, VLCAD, p65, p50, p52, TNFR1, and TNFR2 protein. Each band was quantified by densitometric analyses. (B). Histogram presents means ± SD for 4–5 mice per group, and mean from each control group was assigned value of 1.0. *Significantly different (p<0.05) from 0 ppm group (control).
Discussion
In the present study, the mechanism of TRI-induced hepatotoxicity was investigated and the following findings were revealed: 1) CYP2E1 is a major P450 involved in the in vivo metabolism of TRI and is associated with TRI-induced hepatotoxicity; 2) p52 may be involved in the signalling pathways of TRI-induced inflammation, i.e., hepatotoxicity; and 3) the TRI metabolite, TCA, may be involved in PPARα-related anti-inflammation pathway. The induction of PPARα and its target genes was only seen in the TRI exposed cyp2e1+/+ mice, in which much TCA was produced.
CYP2E1 is able to metabolize TRI to reactive metabolites, and thus CYP2E1 was suggested to be the major P450 involved in TRI-induced liver injury (Nakajima et al., 1992). The role of CYP2E1 in TRI-induced hepatotoxicity was also investigated using pre-administration of the CYP2E1 inducer, ethanol (Nakajima et al., 1988). In this case, the effect of the administered ethanol on the development of hepatotoxicity could not be excluded, because ethanol is also potentially hepatotoxic. Therefore, the present study was conducted to determine directly the precise role of CYP2E1 in TRI-induced hepatotoxicity by comparing the hepatotoxicity in cyp2e1+/+ and cyp2e1−/− mice. The involvement of CYP2E1 in TRI-induced hepatotoxicity can be shown by increased susceptibility to TRI-induced hepatotoxicity in cyp2e1+/+ mice which express CYP2E1. In cyp2e1−/− mice, although other forms of P450 including CYP1A2, CYP2A1, CYP2C6 and CYP3A1 are expressed (Lee et al., 1996), their metabolic capacity was considerably less than half that of CYP2E1, which might preclude their involvement in TRI-induced hepatotoxicity particularly at low-level exposures such as those found in humans.
TRI treatment increased liver weight and the liver/body ratio only in cyp2e1+/+ mice and these were associated with induction of hepatic peroxisomal enzymes, suggesting that peroxisome proliferation might be involved in the increase as also revealed by induction of PPARα target genes encoding PH, VLCAD, and CYP4A10, which was the most sensitive to TRI exposure. The finding of increased liver/body weight is consistent with a previous study in which TRI exposure via either inhalation or the oral route caused a dose-related increase in the liver/body weight ratio (Kjellstrand et al., 1981). Also, the proliferation of peroxisomes corroborates an earlier study (Nakajima et al., 2000) in which PPARα-mediated genes were induced by oral TRI administration only in the wild-type PPARα+/+ mice, similar to cyp2e1+/+ mice. On the other hand, the changes in liver/body weight ratio were believed to be a sensitive indicator of hepatotoxicity (Barton and Clewell, 2000), which may also explain why the liver/body weight was not increased in cyp2e1−/− mice. In the context of TRI exposure-induced liver injury, it is of interest to note that the current work also showed elevated plasma ALT and AST activity in cyp2e1+/+ mice that might indicate evidence for TRI-induced liver injury. However, the histopathological changes around the centrilobular area showed minimum liver injury and only a slight elevation of ALT and AST even at the 2000-ppm dose, suggesting that TRI is a mild hepatotoxicant.
The present study also focused on analyzing the role of CYP2E1 in TRI-induced hepatotoxicity through bioactivation of TRI to reactive metabolites. The levels of TCE and TCA metabolites in the urine were more than twice as high in cyp2e1+/+ mice than in cyp2e1−/− mice, a finding similar to those reported by Kim and Ghanayem (2006). This is not surprising since CYP2E1 is a low Km CYP for TRI metabolism (Nakajima et al., 1992). Other low-affinity P450s would function at 2000 ppm concentrations. This again supports the involvement of CYP2E1 in TRI-induced hepatotoxicity in mice. The role of P450s other than CYP2E1 in TRI metabolism may not be important in the development of hepatotoxicity.
Levels of metabolites in cyp2e1+/+ mice were more than twice those in cyp2e1−/− mice, and liver damage occurred only in cyp2e1+/+ mice as observed by elevated plasma AST and ALT activity and histopathology changes around the centrilobular area following TRI exposure. In light of this finding, reactive metabolites via CYP2E1-mediated metabolism might be produced around the centrilobular area where CYP2E1 is constitutively expressed in cyp2e1+/+ mice, and could lead to hepatocyte damage through binding of the reactive metabolites to intracellular proteins (Halmes et al., 1997). Indeed, significant correlations were observed between ALT and urinary TCE or TCA levels, a finding also reported by Buben and O’Flaherty (1985). It should be noted, however, that TCE and TCA themselves do not act as toxicants, and some intermediate metabolite(s) of TRI to CH may be an ultimate toxicant of TRI (Nakajima et al., 1988).
NFκB can be induced through two signalling pathways: the canonical/classical one in which NFκB activation is regulated by interaction with IκB proteins, and the non-canonical/alternative pathways in which activation of NFκB requires the p52/relB heterodimer (Hayden and Ghosh, 2004). The classical pathway requires the initiation of p50 and p65 heterodimer in the activation of NFκB in hepatocytes (Li et al., 1996). Activation of NFκB through the classical pathway can be inhibited by PPARα expression via two mechanisms, i.e., by the interaction of PPARα with the homology domain of the p65 subunit of NFκB (Delerive et al., 1999), or by induction of IκBα expression, the major inhibitor of NFκB (Delerive et al., 2000). TRI exposure induced PPARα mRNA and protein only in cyp2e1+/+ mice, suggesting that the PPARα signalling pathway was induced by TRI exposure at all concentrations employed in this study. In cyp2e1+/+ mice, TCA produced from TRI can activate PPARα in liver since the metabolite is a PPARα agonist (Maloney and Waxman, 1999). It was subsequently shown that this activation of PPARα might directly inhibit the expression of NFκB family p65 and p50, because TRI exposure did not induce IκBα gene. Although expression of p50 protein increased in cyp2e1+/+ mice, the relationship between p50 protein and ALT level was not significant (data not shown). In cyp2e1−/− mice, production of TCA was very small, which resulted in no induction of PPARα. Thus, TCA may act as a defence against hepatotoxicity caused by TRI-delivered reactive metabolite(s) via PPARα in cyp2e1+/+ mice. These results may also support why TRI presented relatively weak hepatotoxicity.
On the other hand, TRI exposure induced not only protection against hepatotoxicity via PPARα but also the liver injury caused by the reactive intermediate(s) via p52 signalling in cyp2e1+/+ mice. The level of p52 mRNA in cyp2e1+/+ mice liver was significantly increased in the 2000 ppm-dose group following TRI exposure. Interestingly, a positive correlation was observed between the expression level of p52 mRNA and plasma ALT activity, suggesting that induction of p52 might indeed be involved in TRI-induced hepatotoxicity. Additionally, expression of p52 protein in cyp2e1+/+ mice increased dose-dependently, indicating that the alternative p52 NFκB pathway could lead to TRI-induced liver injury. Although this study showed that levels of inflammatory cytokines, products of NFκB activation, including TNFα and IL-6, in serum were not induced (data not shown), the TNFR1 and TNFR2 protein was increased after TRI treatment in cyp2e1+/+ mice.
In summary, resistance to TRI-induced hepatotoxicity in mice having a targeted disruption of the cyp2e1 gene demonstrates that CYP2E1 is important for initiation of TRI-induced hepatotoxicity. Thus, the principal TRI metabolite and PPARα ligand, TCA, might activate the PPARα signalling pathway, which may well protect against TRI-induced hepatotoxicity. Our study also suggested that the induction of NFκB (p52) may lead to hepatotoxicity via bioactive TRI metabolite(s) via CYP2E1, since TRI inhalation exposure caused liver damage only in the cyp2e1+/+ mice.
Acknowledgments
The authors would like to express their gratitude to the Japan Association for Hygiene of Chlorinated Solvents for their kind gift of trichloroethylene. This study was supported in part by Grants-in-Aid for Scientific Research (18659169, B 15406026, 17659175) from the Japan Society for the Promotion of Science (JSPS).
References
- ASTDR (Agency for Toxic Substances and Disease Registry, Division of Toxicology), 1997. Toxicological profile for trichloroethylene (update). ASTDR, Atlanta, GA. [PubMed] [Google Scholar]
- Aoyama T, Peters JM, Iritani N, Nakajima T, Furihata K, Hashimoto T, Gonzalez FJ, 1998. Altered constitutive expression of fatty acid-metabolizing enzymes in mice lacking the peroxisome proliferator-activated receptor alpha (PPARalpha). J. Biol. Chem. 273 (10), 5678–5684. [DOI] [PubMed] [Google Scholar]
- Barton HA, Clewell HJ, 2000. Evaluating non cancer effects of trichloroethylene: dosimetry, mode of action, and risk assessment. Environ. Health Perspect. 108 (Suppl. 2), 323–334. [DOI] [PMC free article] [PubMed] [Google Scholar]
- Brasil LJ, San-Miguel B, Kretzmann NA, Amaral JL, Zettler CG, Marroni N, Gonzalez-Gallego J, Tunon MJ, 2006. Halothane induces oxidative stress and NF-kappaB activation in rat liver: protective effect of propofol. Toxicology. 227, 53–61. [DOI] [PubMed] [Google Scholar]
- Buben JA, O’Flaherty EJ, 1985. Delineation of the role of metabolism in the hepatotoxicity of trichloroethylene and perchloroethylene: a dose-effect study. Toxicol. Appl. Pharmacol. 78, 105–122. [DOI] [PubMed] [Google Scholar]
- Delerive P, De Bosscher K, Besnard S, Vanden Berghe W, Paters JM, Gonzalez FJ, Fruchart JC, Tedgui A, Haegman G, Staels B, 1999. PPARalpha negatively regulates the vascular inflammatory gene response by negative cross-talk with transcription factors NFκB and AP-1. J. Biol. Chem. 274, 32048–32054. [DOI] [PubMed] [Google Scholar]
- Delerive P, Gervois P, Fruschart JC, Staels B, 2000. Induction of IκBα expression as a mechanism contributing to the anti-inflammatory activities of PPARα activators. J. Biol. Chem. 275, 36703–36707. [DOI] [PubMed] [Google Scholar]
- Forkert PG, Lash LH, Nadeau V, Tardif R, Simmonds A, 2002. Metabolism and toxicity of trichloroethylene in epididymis and testis. Toxicol. Appl. Pharmacol. 182, 244–254. [DOI] [PubMed] [Google Scholar]
- Griffin JM, Gilbert KM, Lamps LW, Pumford NR, 2000. CD4(+) T-cell activation and induction of autoimmune hepatitis following trichloroethylene treatment in MRL+/+ mice. Toxicol. Sci. 57, 345–352. [DOI] [PubMed] [Google Scholar]
- Grote JL, Hurlimann C, Scheringer M, Hunggerbuhler K, 2003. Reduction of occupational exposure in metal degreasing over the last 30 years: influences of innovation and legislation. J. Expo. Sci. Environ. Epidemiol. 13, 325–340. [DOI] [PubMed] [Google Scholar]
- Guengerich FP, Kim DH, Iwasaki M, 1991. Role of human cytochrome P-450 IIE1 in the oxidation of many low molecular weight cancer suspects. Chem. Res. Toxicol. 4 (2), 168–179. [DOI] [PubMed] [Google Scholar]
- Halmes NC, Samokyszyn VM, Pumford NR, 1997. Covalent binding and inhibition of cytochrome P4502E1 by trichloroethylene. Xenobiotica 27, 101–110. [DOI] [PubMed] [Google Scholar]
- Hayden MS, Ghosh S, 2004. Signaling to NFκB. Genes Dev. 18, 2195–2224. [DOI] [PubMed] [Google Scholar]
- Huang HL, Li LY, Chen BJ, Huang JX, Kuang SR, 2002. New problems caused by occupational trichloroethylene exposure. Int. J. Immunopathol. Pharmacol. 15, 30–32. [Google Scholar]
- Huang H, Kamijima M, Wang H, Li S, Yoshikawa T, Lai G, Huang Z, Liu H, Chen J, Takeuchi Y, Nakajima T, Li L, 2006. Human herpesvirus 6 reactivation in trichloroethylene-exposed workers suffering from generalized skin disorders accompanied by hepatic dysfunction. J. Occup. Health 48 (6), 417–423. [DOI] [PubMed] [Google Scholar]
- Ito Y, Yamanoshita O, Asaeda N, Takagawa Y, Lee CH, Aoyama T, Ichihara G, Furuhashi K, Kamijima M, Gonzalez FJ, Nakajima T, 2007. Di(2-ethylhexyl) phthalate induces hepatic tumorigenesis through a peroxisome proliferator-activated receptor a-independent pathway. J. Occup. Health 49, 172–182. [DOI] [PubMed] [Google Scholar]
- Jaeschke H, Gores GJ, Cederbaum AI, Hinson JA, Pessayre D, Lemasters JJ, 2002. Mechanism of hepatotoxicity. Toxicol. Sci. 65, 166–176. [DOI] [PubMed] [Google Scholar]
- Kamijima M, Hisanaga N, Wang H, Nakajima T, 2007. Occupational trichloroethylene exposure as a cause of idiosyncratic generalized skin disorder and accompanying hepatitis similar to drug hypersensitivities. Int. Arch. Occup. Environ. Health 80, 357–370. [DOI] [PubMed] [Google Scholar]
- Kaneko T, Saegusa M, Tasaka K, Sato A, 2000. Immunotoxicity of trichloroethylene: a study with MRL-lpr/lpr mice. J. Appl. Toxicol. 20, 471–475. [DOI] [PubMed] [Google Scholar]
- Kim D, Ghanayem BI, 2006. Comparative metabolism and disposition of trichloroethylene in cyp2e1−/− mice and wild-type mice. Drug Metab. Dispos. 34, 2020–2027. [DOI] [PubMed] [Google Scholar]
- Kjellstrand P, Kanje M, Mansson L, Bjerkemo M, Mortensen I, Lanke J, Holmquist B, 1981. Trichloroethylene: effects on body and organ weights in mice, rats and gerbils. Toxicology 21, 105–115. [DOI] [PubMed] [Google Scholar]
- Lash LH, Fisher JW, Lipscomb JC, Parker JC, 2000. Metabolism of trichloroethylene. Environ. Health Perspec. 108 (Suppl 2), 177–200. [DOI] [PMC free article] [PubMed] [Google Scholar]
- Laskin DL, Laskin JD, 2001. Role of macrophage and inflammatory mediators in chemically induced toxicity. Toxicology. 160, 111–118. [DOI] [PubMed] [Google Scholar]
- Lee SS, Buters JT, Pineau T, Fernandez-Salguero P, Gonzalez FJ, 1996. Role of CYP2E1 in the hepatotoxicity of acetaminophen. J. Biol. Chem. 271, 12063–12067. [DOI] [PubMed] [Google Scholar]
- Li Y, Leung LK, Spear BT, Glauert HP, 1996. Activation of hepatic NF-kappaB by phenobarbital in rats. Biochem. Biophys. Res. Commun. 229 (3), 982–989. [DOI] [PubMed] [Google Scholar]
- Maloney EK, Waxman DJ, 1999. trans-Activation of PPARalpha and PPARgamma by structurally diverse environmental chemicals. Toxicol. Appl. Pharmacol. 161, 209–218. [DOI] [PubMed] [Google Scholar]
- Mensing T, Welge P, Voss B, Fels LM, Fricke HH, Bruning T, Wilhelm M, 2002. Renal toxicity after chronic inhalation exposure of rats to trichloroethylene. Toxicol. Lett. 128, 243–247. [DOI] [PubMed] [Google Scholar]
- Nagaya T, Ishikawa N, Hata H, Otobe T, 1993. Subclinical and reversible hepatic effects of occupational exposure to trichlorethylene. Int. Arch. Occup. Environ. Health 64, 561–563. [DOI] [PubMed] [Google Scholar]
- Nakajima T, 1997. Cytochrome isoforms and the metabolism of volatile hydrocarbons of low relative molecular mass. J. Occup. Health 39, 83–91. [Google Scholar]
- Nakajima T, Sato A, Koyama Y, Murayama N, Takeda J, Kusama S, 1980. A case of acute trichloroethylene poisoning. Jap. J. Ind. Health 22, 496–497 (in Japanese). [DOI] [PubMed] [Google Scholar]
- Nakajima T, Okino T, Okuyama S, Kaneko T, 1988. Ethanol-induced enhancement of trichloroethylene metabolism and hepatotoxicity: difference from the effect of phenobarbital. Toxicol. Appl. Pharmacol. 94, 227–237. [DOI] [PubMed] [Google Scholar]
- Nakajima T, Wang RS, Muruyama N, Sato A, 1990. Three forms of trichloroethylene-metabolizing enzymes in rat liver induced by ethanol, phenobarbital, and 3-methylcholanthrene. Toxicol. Appl. Pharmacol. 102, 546–552. [DOI] [PubMed] [Google Scholar]
- Nakajima T, Wang RS, Elovaara E, Park SS, Gelboin HV, Vainio H, 1992. A comparative study on the contribution of cytochrome P450 isozymes to metabolism of benzene, toluene and trichloroethylene in rat liver. Biochem. Pharmacol. 43, 251–257. [DOI] [PubMed] [Google Scholar]
- Nakajima T, Kamijo Y, Usuda N, Liang Y, Fukushima Y, Kametani K, Gonzalez FJ, Aoyama T, 2000. Sex-dependent regulation of hepatic peroxisome proliferation in mice by trichloroethylene via peroxisome proliferator-activated receptor alpha (PPARα). Carcinogenesis 21, 677–682. [DOI] [PubMed] [Google Scholar]
- Nakajima T, Wang RS, Ito Y, Aoyama T, Kamijima M, 2005. A review of hazardous chemical toxicity studies utilizing genetically-modified animals-their applications for risk assessment. Ind. Health 43, 615–622. [DOI] [PubMed] [Google Scholar]
- NTP (National Toxicology Program), 1990. Carcinogenesis stues of trichloroethylene (without epichlorohydrin) in F344/N rats and BC63F1 mice (gavages study). NTP Technical Report, vol. 243. National Toxicology Program, Research Triangle Park, NC. CAS No. 79–01-06. [PubMed] [Google Scholar]
- Radican L, Wartenberg D, Rhoads GG, Schneider D, Wedeen R, Stewart P, Blair A, 2006. A retrospective occupational cohort study of end-stage renal disease in aircraft workers exposed to trichloroethylene and other hydrocarbons. J. Occup. Environ. Med. 48, 1–12. [DOI] [PMC free article] [PubMed] [Google Scholar]
- Song JZ, Ho JW, 2003. Simultaneous detection of trichloroethylene alcohol and acetate inraturine by gas chromatography-mass spectrometry. J. Chromatogr. B 789, 303–309. [DOI] [PubMed] [Google Scholar]
- Soni MG, Mangipudy RS, Mumtaz MM, Mehendale HM, 1998. Tissue repair response as a function of dose during trichloroethylene hepatotoxicity. Toxicol. Sci. 42, 158–165. [DOI] [PubMed] [Google Scholar]
- Wong FW, Chan WY, Lee SS, 1998. Resistance to carbon tetrachloride-induced hepatotoxicity in mice which lack CYP2E1 expression. Toxicol. Appl. Pharmacol. 153, 109–118. [DOI] [PubMed] [Google Scholar]