

Abstract
PRKCI is frequently overexpressed in multiple human cancers, and PKCι expression is often prognostic for poor patient survival, indicating that elevated PKCι broadly plays an oncogenic role in the cancer phenotype. PKCι drives multiple oncogenic signaling pathways in human cancer cells involved in transformed growth, and transgenic mouse models have revealed that PKCι is a critical oncogenic driver in both lung and ovarian cancers. We now report that recurrent 3q26 copy number gain (CNG) is the predominant genetic driver of PRKCI mRNA expression in all major human cancer types exhibiting such CNGs. In addition to PRKCI, CNG at 3q26 leads to coordinate CNGs of ECT2 and SOX2, two additional 3q26 genes that collaborate with PRKCI to drive oncogenic signaling and tumor initiation in lung squamous cell carcinoma. Interestingly however, whereas 3q26 CNG is a strong driver of PRKCI mRNA expression across all tumor types examined, it has differential effects on ECT2 and SOX2 mRNA expression. In some tumors, particularly those with squamous histology, all three 3q26 oncogenes are coordinately overexpressed as a consequence of 3q26 CNG, whereas in other cancers only PRKCI and ECT2 mRNA are coordinately overexpressed. This distinct pattern of expression of 3q26 genes corresponds to differences in genomic signatures reflective of activation of specific PKCι oncogenic signaling pathways. In addition to highly prevalent CNG, we also observe that some tumor types exhibit monoallelic loss of PRKCI. Interestingly, many tumors harboring monoallelic loss of PRKCI express significantly lower PRKCI mRNA and exhibit evidence of WNT/β-catenin signaling pathway activation, which we previously characterized as a major oncogenic pathway in a newly described, PKCι-independent molecular subtype of lung adenocarcinoma. Finally, we show that CNG-driven activation of PKCι oncogenic signaling predicts poor patient survival in many major cancer types. We conclude that CNG and monoallelic loss are the major determinants of tumor PRKCI mRNA expression across virtually all tumor types, but that tumor-type specific mechanisms determine whether these copy number alterations also drive expression of the collaborating 3q26 oncogenes ECT2 and SOX2, and the oncogenic PKCι signaling pathways these genes activate. Our analysis may be useful in identifying tumor-specific predictive biomarkers and effective PKCι-targeted therapeutic strategies in the multitude of human cancers harboring genetic activation of PRKCI.
Keywords: Protein kinase Cι, 3q26 copy number, Oncogenic signaling pathways, Oncogenic driver, ECT2, SOX2
Introduction
Protein kinase C iota (PKCι) is a member of the atypical subfamily of protein kinase C isoforms (aPKCs). Like all members of the PKC family of serine/threonine kinases, aPKCs consist of a highly conserved carboxy-terminal catalytic domain containing an ATP-binding site and a substrate binding site, and an N-terminal regulatory domain containing a pseudo-substrate motif that interacts with the substrate-binding cleft of the kinase domain to form a “closed”, auto-inhibited structure. Unlike the conventional and novel PKC subfamily members however, the aPKCs, PKCι and PKC zeta (PKCζ), lack both a calcium-binding C2 site and a functional C1 diacylglycerol-binding site in the regulatory domain (reviewed in (Isakov, 2018; Poli et al., 2014)). As a result, the aPKCs are not activated by calcium, diacylglycerol or the tumor-promoting phorbol esters.
The regulatory domain of aPKCs contains a unique Phox-Bem1 (PB1) protein-protein interaction module not found in other PKC isoforms. This highly conserved domain mediates binding of the aPKCs to other PB1 domain-containing proteins, and serves to recruit aPKCs into signaling complexes containing direct substrates and downstream effectors of aPKC function in both normal and transformed cells (reviewed in (Parker et al., 2014)). One of the best characterized functions of aPKCs is driven by PB1-mediated interaction with the polarity protein PAR6. The aPKCs interact with PAR6, and its binding partner, PAR3, to form the “PAR complex” that functions to establish apical-basal polarity and regulate asymmetric cell division, cell fate determination and cell differentiation (Chen and Zhang, 2013; Lin et al., 2000; Vorhagen and Niessen, 2014). Epithelial cell polarity is considered to be a tumor-suppressive cellular process, and cancer initiation is associated with disruption of cellular polarity, often driven by oncogene-mediated hijacking of the cellular polarity machinery and/or dysregulation of expression E-cadherin or components of the polarity complex (Parker et al., 2014; Tanos and Rodriguez-Boulan, 2008). aPKCs have also been shown to promote cell survival via activation of anti-apoptotic signaling and play a required role in Ras-mediated actin cytoskeleton reorganization (Grunicke et al., 2003; Hellbert et al., 2000).
PKCι and PKCζ have high sequence homology and are structurally very similar. As a result, many early studies of aPKC expression and activity did not accurately distinguish between the two isoforms, thereby introducing confusion as to whether PKCι and/or PKCζ played distinct roles in normal tissue development, cellular homeostasis, and cancer. Cloning of the individual aPKC genes allowed the selective overexpression and inhibition of expression of each isoform individually to establish isotype-selective function (Ono et al., 1989; Selbie et al., 1993). Furthermore, generation of transgenic mouse models that selectively alter the expression or function of an individual aPKC has made it possible to assess the requirement of PKCι and PKCζ for overall viability, as well as tissue-specific development, function and susceptibility to cancer initiation (Leitges et al., 2001; Soloff et al., 2004). Importantly, these genetic models revealed that PKCι is the only PKC isoform whose whole body knock out is embryonic lethal in mice, demonstrating a non-redundant and specific role for PKCι in embryogenesis and development, separate and distinct from all other PKC isoforms including PKCζ (Soloff et al., 2004).
We originally characterized PRKCI as an oncogene in non-small cell lung cancer (NSCLC) based on its widespread overexpression in NSCLC, the observation that high PKCι protein expression in NSCLC is associated with increased risk of cancer-specific death, and the identification of specific PKCι signaling axes that are required for transformed growth of human NSCLC cells (Regala et al., 2005b). Furthermore, the mouse homolog of PRKCI, Prkci, is required for Kras-mediated lung adenocarcinoma (LUAD) tumorigenesis in mice (Regala et al., 2009). Mechanistically, we have identified two key PKCι substrates that activate distinct oncogenic PKCι signaling important for LUAD transformation. PKCι directly phosphorylates the guanine nucleotide exchange factor (GEF) ECT2, to activate its GEF activity towards RAC1 to activate cytoplasmic MEK-ERK signaling, invasion and Kras-driven LUAD tumorigenesis (Justilien and Fields, 2009; Regala et al., 2005a). Subsequent studies revealed that PKCι-mediated ECT2 phosphorylation also activates nuclear RAC1 to drive enhanced rDNA transcription and upregulation of ribosome synthesis, which is required for Kras-driven LUAD tumorigenesis (Justilien et al., 2017a). PKCι also directly phosphorylates the transcription factor, ELF3, to induce NOTCH3 expression in LUAD cells. Activated ELF3-NOTCH3 signaling drives a LUAD tumor-initiating cell phenotype by regulating asymmetric cell division, a cellular process required for cancer initiation and tumor maintenance (Ali et al., 2016).
PRKCI resides on chromosomal region 3q26, one of the most frequently altered chromosomal regions in human cancers (Fields et al., 2016). Copy number gain (CNG) of this chromosomal region, which typically spans chromosome 3q26–29, occurs in >20% of all human cancers, and is generally associated with poor patient prognosis (Davidson and Shanks, 2017; Koeneman et al., 2019), suggesting a direct role for relevant amplified genes within this region in driving carcinogenesis. Of the more than 200 genes that reside in this “3q26 amplicon”, several have been implicated as “drivers” of oncogenic signaling and cancer initiation, including PRKCI (Fields et al., 2016; Qian et al., 2015; Wang, J. et al., 2013; Yang et al., 2008).
Ovarian serous carcinoma (OV) is the most common and deadly form of ovarian cancer, accounting for 70–80% of the 150,000 annual ovarian cancer deaths worldwide (Siegel et al., 2019; Torre et al., 2018). PRKCI is highly expressed in OV, and 3q26 CNG drives elevated PRKCI mRNA expression in OV tumors (Sarkar et al., 2017; Zhang et al., 2006). PKCι protein expression correlates with increased tumor stage and grade of ovarian cancer, and with reduced median survival of ovarian cancer patients (Weichert et al., 2003; Zhang et al., 2006). PKCι regulates ovarian epithelial cell polarity (Eder et al., 2005), is required for ovarian cancer cell transformed growth (Wang, Y. et al., 2013), and plays a critical role in OV proliferation by activating oncogenic YAP1 signaling and promoting maintenance of a tumor-initiating cell phenotype (Wang et al., 2017). PRKCI and its oncogenic signaling partner ECT2 are co-amplified and coordinately overexpressed in high grade OV cells with 3q26 CNGs, and PKCι-ECT2 oncogenic signaling is activated in ovarian cancer tumor-initiating cells (Wang, Y. et al., 2013). A recent study demonstrated that PKCι expression is induced early in human ovarian cancer development (Sarkar et al., 2017). PKCι overexpression, in the context of Trp53 and Pten loss, transforms the fallopian tube epithelium in a mouse model of ovarian tumorigenesis, at least in part, by promoting an immunosuppressive tumor microenvironment signaled via YAP1 activation (Sarkar et al., 2017). Taken together, these studies strongly implicate PKCι as a major oncogenic driver in ovarian cancer.
Recently, we demonstrated that 3q26 CNG, which is present in >90% of lung squamous cell carcinoma (LUSC) tumors, occurs very early in tumorigenesis, is maintained during tumor progression, and drives overexpression of three genes located on the 3q26 amplicon, PRKCI, ECT2 and SOX2 (Liu et al., 2020). Overexpression of PKCι, along with its direct substrates and signaling partners, ECT2 and SOX2, promotes oncogenic LUSC signaling, and in the context of loss of tumor suppressor Trp53, is sufficient to drive LUSC tumorigenenesis (Liu et al., 2020). In LUSC cells, PKCι-mediated phosphorylation of SOX2, a master regulator of stemness, drives a LUSC lineage-restricted transcriptional program that includes activation of Hedgehog signaling (Justilien et al., 2014; Liu et al., 2020). PKCι-mediated phosphorylation of SOX2 is required for maintenance of a stem-like phenotype in LUSC and for lung basal stem cell (LBSC) transformation into LUSC (Justilien et al., 2014; Liu et al., 2020). PKCι-mediated phosphorylation of ECT2, initially characterized in LUAD to promote oncogenic growth and ribosome biogenesis, also drives these oncogenic processes in LUSC, where PKCι-ECT2 signaling is required for LBSC transformation and LUSC initiation (Justilien et al., 2017a; Justilien et al., 2017b; Liu et al., 2020). Gene expression signatures of PKCι-ECT2 and PKCι-SOX2 pathway activity identify the Classical subtype of LUSC as tumors enriched in 3q26 CNG-driven activation of these PKCι oncogenic signaling pathways, and predict distinct therapeutic vulnerabilities in LUSC, demonstrating the clinical relevance of 3q26 CNG (summarized in Figure 1; (Justilien et al., 2017a; Justilien et al., 2014; Liu et al., 2020)).
Figure 1: 3q26 CNG activates PKCι-driven oncogenic signaling pathways in LUSC.
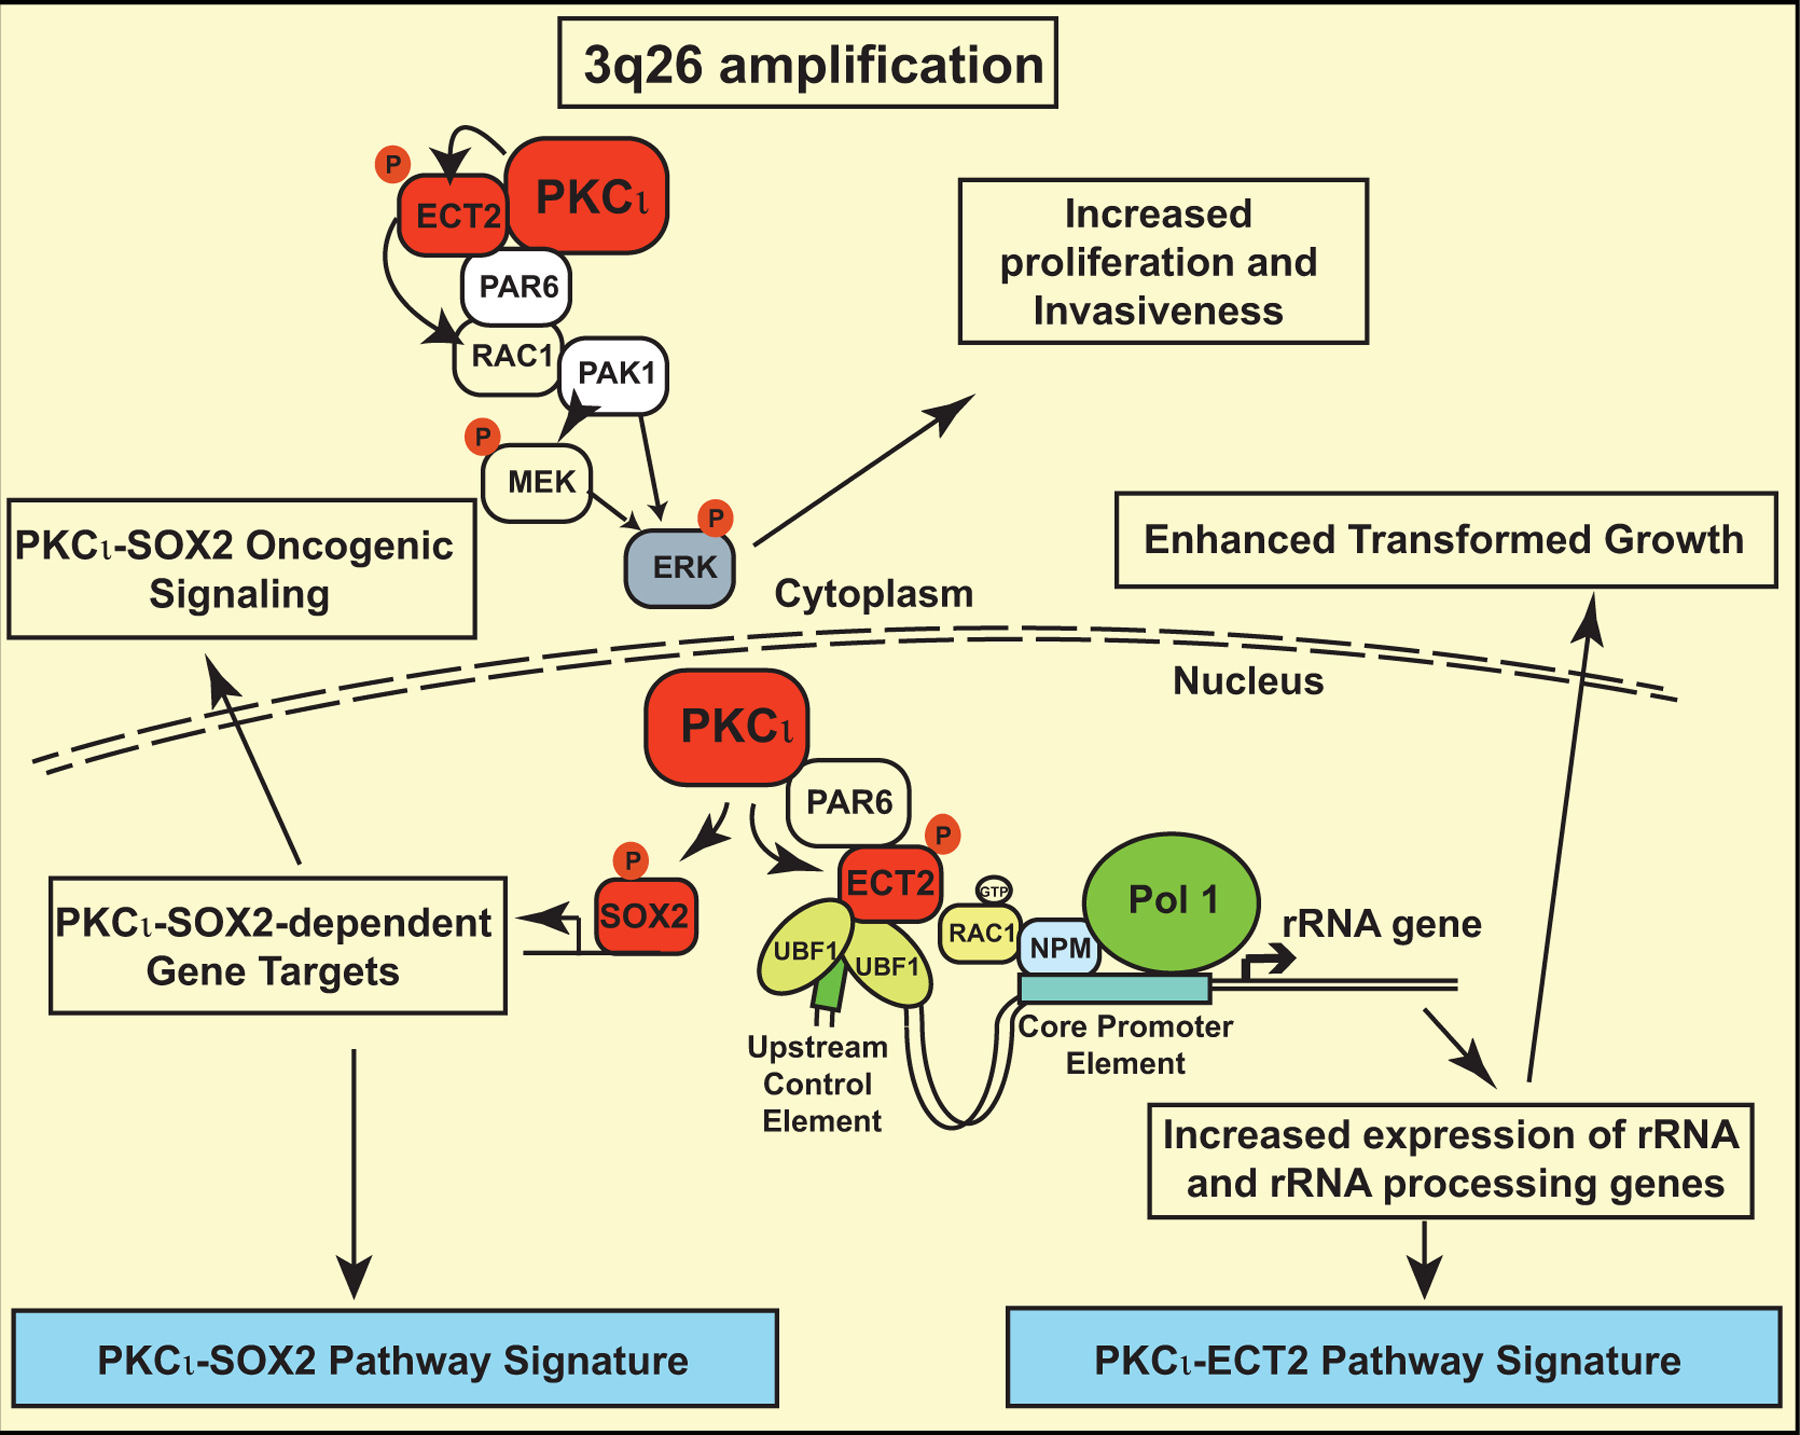
Summary of 3q26 CNG-driven PKCι-ECT2 and PKCι-SOX2 oncogenic signaling pathways and corresponding pathway signatures in LUSC.
PRKCI overexpression has been described in many human cancers (reviewed in (Murray et al., 2011; Reina-Campos et al., 2019)). Somatic PRKCI CNG is a well-documented driver of PRKCI overexpression in LUSC and OV (Fields et al., 2016; Liu et al., 2020; Sarkar et al., 2017; Wang, Y. et al., 2013), however the mechanism(s) driving PRKCI expression in the many other types of cancer in which PRKCI is highly expressed has not been systematically evaluated. In this report, we investigate the role of 3q26 copy number alterations in regulating expression of PRKCI mRNA in 23 major forms of human cancer. We also determine the impact of 3q26 copy number alterations on copy number and expression of ECT2 and SOX2, two known oncogenic collaborators and signaling partners of PRKCI, whose genes reside within the 3q26 amplicon. In addition, we assess the status of PKCι-driven oncogenic signaling pathways activated by 3q26 CNG in LUSC (Liu et al., 2020) in this panel of human cancers, and use pathway analysis to identify signaling pathways upregulated in tumors harboring monoallelic loss of PRKCI and reduced PRKCI mRNA expression. Finally, we assess the ability of 3q26 CNG-driven PKCι pathway activity to predict patient survival in human cancers. Our results demonstrate that tumors harboring 3q26 CNG can be classified into distinct subtypes based on the consequence of CNG on expression of the three collaborating 3q26 oncogenes, PRKCI, ECT2 and SOX2, and activation of resultant oncogenic signaling pathways. This study identifies important potential biomarkers of therapeutic response and predictors of effective PKCι-targeted combination therapies for the treatment of the many cancers harboring 3q26 CNG and activated oncogenic PKCι signaling.
Materials and Methods
Samples and data types
PanCanAtlas datasets with mRNA and gene copy number data were accessed in The Cancer Genome Atlas (TCGA) PanCanAtlas Data Portal. Colon and Rectal Cancer (COADREAD) was divided into two types, Colon Cancer (COAD) and Rectal Cancer (READ). Criteria for inclusion in our study were a minimum of 75 total primary tumors, and the presence of both RNAseq gene expression with FPKM values from the Illumina HiSeq 2000 RNA Sequencing platform, and gene-level copy number alterations estimated by the Genomic Identification of Significant Targets In Cancer (GISTIC) algorithm, using the GISTIC2.0 computational method (Mermel et al., 2011). Thyroid (THCA) and Thymoma (THYM) cancers were excluded from analysis due to the low number of tumors with 3q26 copy number gains. 23 tumor types satisfying our eligibility criteria were included in our analysis.
PRKCI, ECT2 and SOX2 mRNA expression data, in the form of RNAseq gene expression, PRKCI, ECT2 and SOX2 gene copy number data, in the form of GISTIC score, and patient overall survival data for each cancer type, and molecular subtype classification of BRCA tumors, were downloaded (http://www.cbioportal.org/public-portal/). GISTIC2 thresholded the estimated values to −1, 0, +1, +2, which represent monoallelic loss, normal, diploid copies, low-level copy number amplification, or high-level copy number amplification, respectively. To avoid the dilution of statistical power, we combined GISTIC= −1 samples with GISTIC= 0 samples, and GISTIC= +2 samples with GISTIC= +1 samples respectively, when the sample number for any of these GISTIC categories was less than 10. None of the tumor types analyzed contained tumors with GISTIC= −2 for these genes. Details of tumor type, number and distribution by GISTIC score is provided in Supplemental Table 1.
Mutual exclusivity and co-occurrence of PRKCI CNG and ECT2 (or SOX2) CNG
21 out of 23 cancer types had sufficient numbers of tumors with PRKCI CNGs (tumor with GISTIC score = +1 and +2 were combined for this analysis), as shown in Supplemental Table 1. The significance of mutual exclusivity and co-occurrence was evaluated using Fisher exact tests to calculate p values and Benjamini-Hochberg false discovery rate (FDR) correction procedure for pairs of selected genetic alterations to derive q values. Log odds ratio was used as a tendency indicator of mutual exclusivity (Log2 ratio > 0) or co-occurrence (Log2 ratio ≤ 0).
Pathway score analysis
Principal component analysis (PCA) of the expression matrix of PKCι-SOX2 and PKCι-ECT2 signaling pathway gene expression signatures identified in LUSC was used to generate Eigengenes that reflects activity of these signaling pathways (Liu et al., 2020) The Eigengenes were applied to TCGA tumor datasets, using the built-in R prcomp and princomp functions, to generate a PKCι-SOX2 Pathway Score and a PKCι-ECT2 Pathway Score of relative pathway activity in the TCGA dataset tumors.
Pathway analysis of tumors harboring PRKCI Loss (GISTIC = −1) vs Gains (GISTIC = +1 and +2)
The Gene Set Enrichment Analysis (GSEA) software is publicly available from the Broad Institute of MIT and Harvard University (http://software.broadinstitute.org/gsea/index.jsp). 12 out of 23 cancer types had sufficient numbers of tumors (≥10) in both PRKCI monoallelic loss (GISTIC score = −1) and PRKCI gains (combined samples with GISTIC score = +1 and +2) categories for this analysis (see Supplemental Table 1). FPKM-normalized gene counts from these 12 cancer types were uploaded to GSEA software for hallmark analysis (version h.all.v7.1). Analysis of differentially enriched Hallmarks in PRKCI loss vs PRKCI gain samples was performed separately in each of the 12 cancer types. GSEA was performed using the gene permutation option and gene sets smaller than 15 or larger than 500 were excluded. GSEA hallmarks with an FDR of less than 0.25 (FDR<0.25) were considered as significantly enriched.
Survival analysis
To determine if tumor PKCι-ECT2 signaling pathway activity, measured by PKCι-ECT2 Pathway Score, is prognostic for cancer patient survival, cancer types in which PKCι-ECT2 Pathway Score is significantly associated with 3q26 CNG (Groups 1 and 2, Table 2) were evaluated for the association of overall patient survival with PKCι-ECT2 Pathway Score. Patients were stratified into two groups based on an optimized cutoff value of PKCι-ECT2 Pathway Score, calculated using the R survival package (Budczies et al., 2012). The optimal cutoff is defined as the point with the most significant statistical difference in overall survival (log-rank test) using the R functions survfit and coxph.
Table 2:
Association of 3q26 CNG with ECT2 and SOX2 mRNA expression and PKCι-driven signaling
| ECT2 mRNA vs CNG | PKCι-ECT2 Pathway score* vs CNG | SOX2 mRNA vs CNG | PKCι-SOX2 Pathway score * vs CNG | |||||
|---|---|---|---|---|---|---|---|---|
| Tumor type | significant | (R#; P value) | significant | (R#; P value) | significant | (R#; P value) | significant | (R#; P value) |
| Group 1: CNG drives PRKCI, ECT2 and SOX2 expression and signaling (Squamous signaling) | ||||||||
| LUSC | Yes | (0.55; < 2 E-16) | Yes | (0.48; < 2 E-16) | Yes | (0.55; < 2 E-16) | Yes | (0.43; < 2 E-16) |
| HNSC | Yes | (0.53; < 2 E-16) | Yes | (0.41; < 2 E-16) | Yes | (0.38; < 2 E-16) | Yes | (0.34; 4 E-14) |
| ESCA | Yes | (0.44: 1 E-08) | Yes | (0.37; 1 E-06) | Yes | (0.42; 1 E-07) | Yes | (0.43; 2 E-08) |
| CESC | Yes | (0.4; 2 E-11) | Yes | (0.22; 7 E-04) | Yes | (0.3; 1 E-06) | Yes | (0.22; 7 E-04) |
| BRCA | Yes | (0.39; < 2 E-16) | Yes | (0.36; < 2 E-16) | Yes | (0.11; 1 E-03) | Yes | (0.08; 0.04) |
| Group 2: CNG drives PRKCI, ECT2 (and/or SOX2) expression and PKCι-ECT2 signaling (Non-squamous signaling) | ||||||||
| OV | Yes | (0.5; <2 E-16) | Yes | (0.20; 3 E-03) | Yes | (0.2; 4 E-03) | No | (0.13; 0.07) |
| BLCA | Yes | (0.49; < 2 E-16) | Yes | (0.39; 9 E-15) | Yes | (0.24; 9 E-06) | No | (0.06; 0.5) |
| LUAD | Yes | (0.5; < 2 E-16) | Yes | (0.37; 1 E-13) | Yes | (0.17; 4 E-03) | No | (2E-03; 1.0) |
| UCS | Yes | (0.51; 6 E-12) | Yes | (0.41; 2 E-07) | Yes | (0.2; 4 E-03) | No | (0.017; 1.0) |
| ACC | Yes | (0.51; 3 E-05) | Yes | (0.48; 7 E-05) | No | (0.07; 0.6) | No | (0.14; 0.3) |
| LIHC | Yes | (0.26; 4 E-06) | Yes | (0.22; 7 E-05) | No | (0.035; 0.5) | No | (0.056; 0.3) |
| PAAD | Yes | (0.36; 4 E-06) | Yes | (0.26; 9 E-04) | No | (0.13; 0.1) | No | (0.037; 0.7) |
| PRAD | Yes | (0.28; 2 E-09) | Yes | (0.13; 0.01) | No | (0.055; 0.5) | No | (0.071; 0.5) |
| READ | Yes | (0.14; 7 E-03) | Yes | (0.15; 6 E-03) | No | (0.073; 0.2) | No | (0.095; 0.2) |
| STAD | Yes | (0.39; 5 E-14) | Yes | (0.35; 4 E-11) | No | (0.049; 0.6) | No | (0.066; 0.4) |
| SARC | Yes | (0.33; 2 E-06) | Yes | (0.22; 2 E-03) | No | (0.002; 1.0) | Yes | 0.19; 7 E-03) |
| KIRP | Yes | (0.17; 4 E-03) | Yes | (0.11; 0.05) | No | (0.095; 0.1) | Yes | (0.12; 0.04) |
| Group 3: CNG drives PRKCI expression but not PKCι-ECT2 or PKCι-SOX2 signaling | ||||||||
| KIRC | Yes | (0.33; 7 E-13) | No | (0.06; 0.2) | Yes | (0.13; 6 E-03) | No | (0.066; 0.2) |
| TGCT | Yes | (0.32; 2 E-04) | No | (0.14; 0.1) | Yes | (0.25; 4 E-03) | No | (0.13; 0.1) |
| MESO | No | (0.21; 0.06) | No | (0.04; 0.7) | No | (0.07; 0.6) | No | (0.10; 0.3) |
| COAD | No | (0.07; 0.2) | No | (0.10; 0.1) | No | (0.044; 0.5) | No | (0.098; 0.1) |
| Group 4: Only monoallelic copy number loss | ||||||||
| PCPG | NA | NA | NA | NA | NA | NA | NA | NA |
| UVM | NA | NA | NA | NA | NA | NA | NA | NA |
Coefficient of linear regression model
Pathway scores calculated as described in Methods
Statistical Analysis
The details of statistical analysis of experiments can be found in the figure legends. Statistical analysis of differences between two groups of samples was performed using two-tailed Student’s t-tests, with p ≤ 0.05 defined as significant in all analyses. The distribution of PRKCI GISTIC score across BRCA molecular subtypes was performed using Chi-square test. When comparing more than one group, one way analysis of variance (ANOVA) test was used. The correlation analysis of PKCι-SOX2 Pathway Score and PKCι-ECT2 Pathway Score vs PRKCI copy number, and SOX2 (or ECT2) mRNA vs SOX2 (or ECT2) copy number was performed using the Linear regression model. Statistical analysis was performed using the computing environment R.
Results and Discussion
Copy number alteration is a prominent genetic driver of PRKCI mRNA expression in all major cancer types
We and others have demonstrated elevated PRKCI mRNA and/or PKCι protein expression in many types of human cancer. We have also characterized PKCι-dependent, oncogenic signaling pathways that are activated in human cancer cell lines and mouse models of cancer (reviewed in (Parker et al., 2014; Reina-Campos et al., 2019)). In LUSC, PRKCI overexpression is driven by 3q26 CNG, which occurs early in tumorigenesis, and is maintained during tumor progression (Liu et al., 2020). To globally assess the role of 3q26 copy number alterations in the control of PRKCI expression in other major human cancer types, we assessed the prevalence of PRKCI CNGs and losses in 23 tumor types in TCGA PanCancer Atlas Studies database using the GISTIC algorithm score (summarized in Supplemental Table 1). GISTIC scores +2, +1, 0 and −1 were observed for PRKCI across these tumor types, indicating high CNG/amplification, lower level CNGs, normal diploid, or monoallelic loss of PRKCI, respectively (Figure 2A). The most prevalent PRKCI copy number alterations were CNGs (GISTIC +1 or +2), which were observed in 21/23 tumor types. CNGs were present in more than 50% of LUSC, OV, Cervical carcinoma (CESC), Head and Neck squamous cell carcinoma (HNSC), Esophageal (ESCA) and Bladder (BLCA) cancers, and less frequently in many other tumor types (Figure 2A). Interestingly, monoallelic loss of PRKCI was also observed in multiple tumor types. In general, monoallelic loss of PRKCI was less frequently observed than CNGs, although it was detected at a high level, and in the absence of CNG, in two relatively rare tumor types, Pheochromocytoma/Paragangioma (PCPG) and Uveal Melanoma (UVM) (Figure 2A and Supplemental Table 1).
Figure 2: Frequent PRKCI copy number alterations drive PRKCI expression in major cancer types.
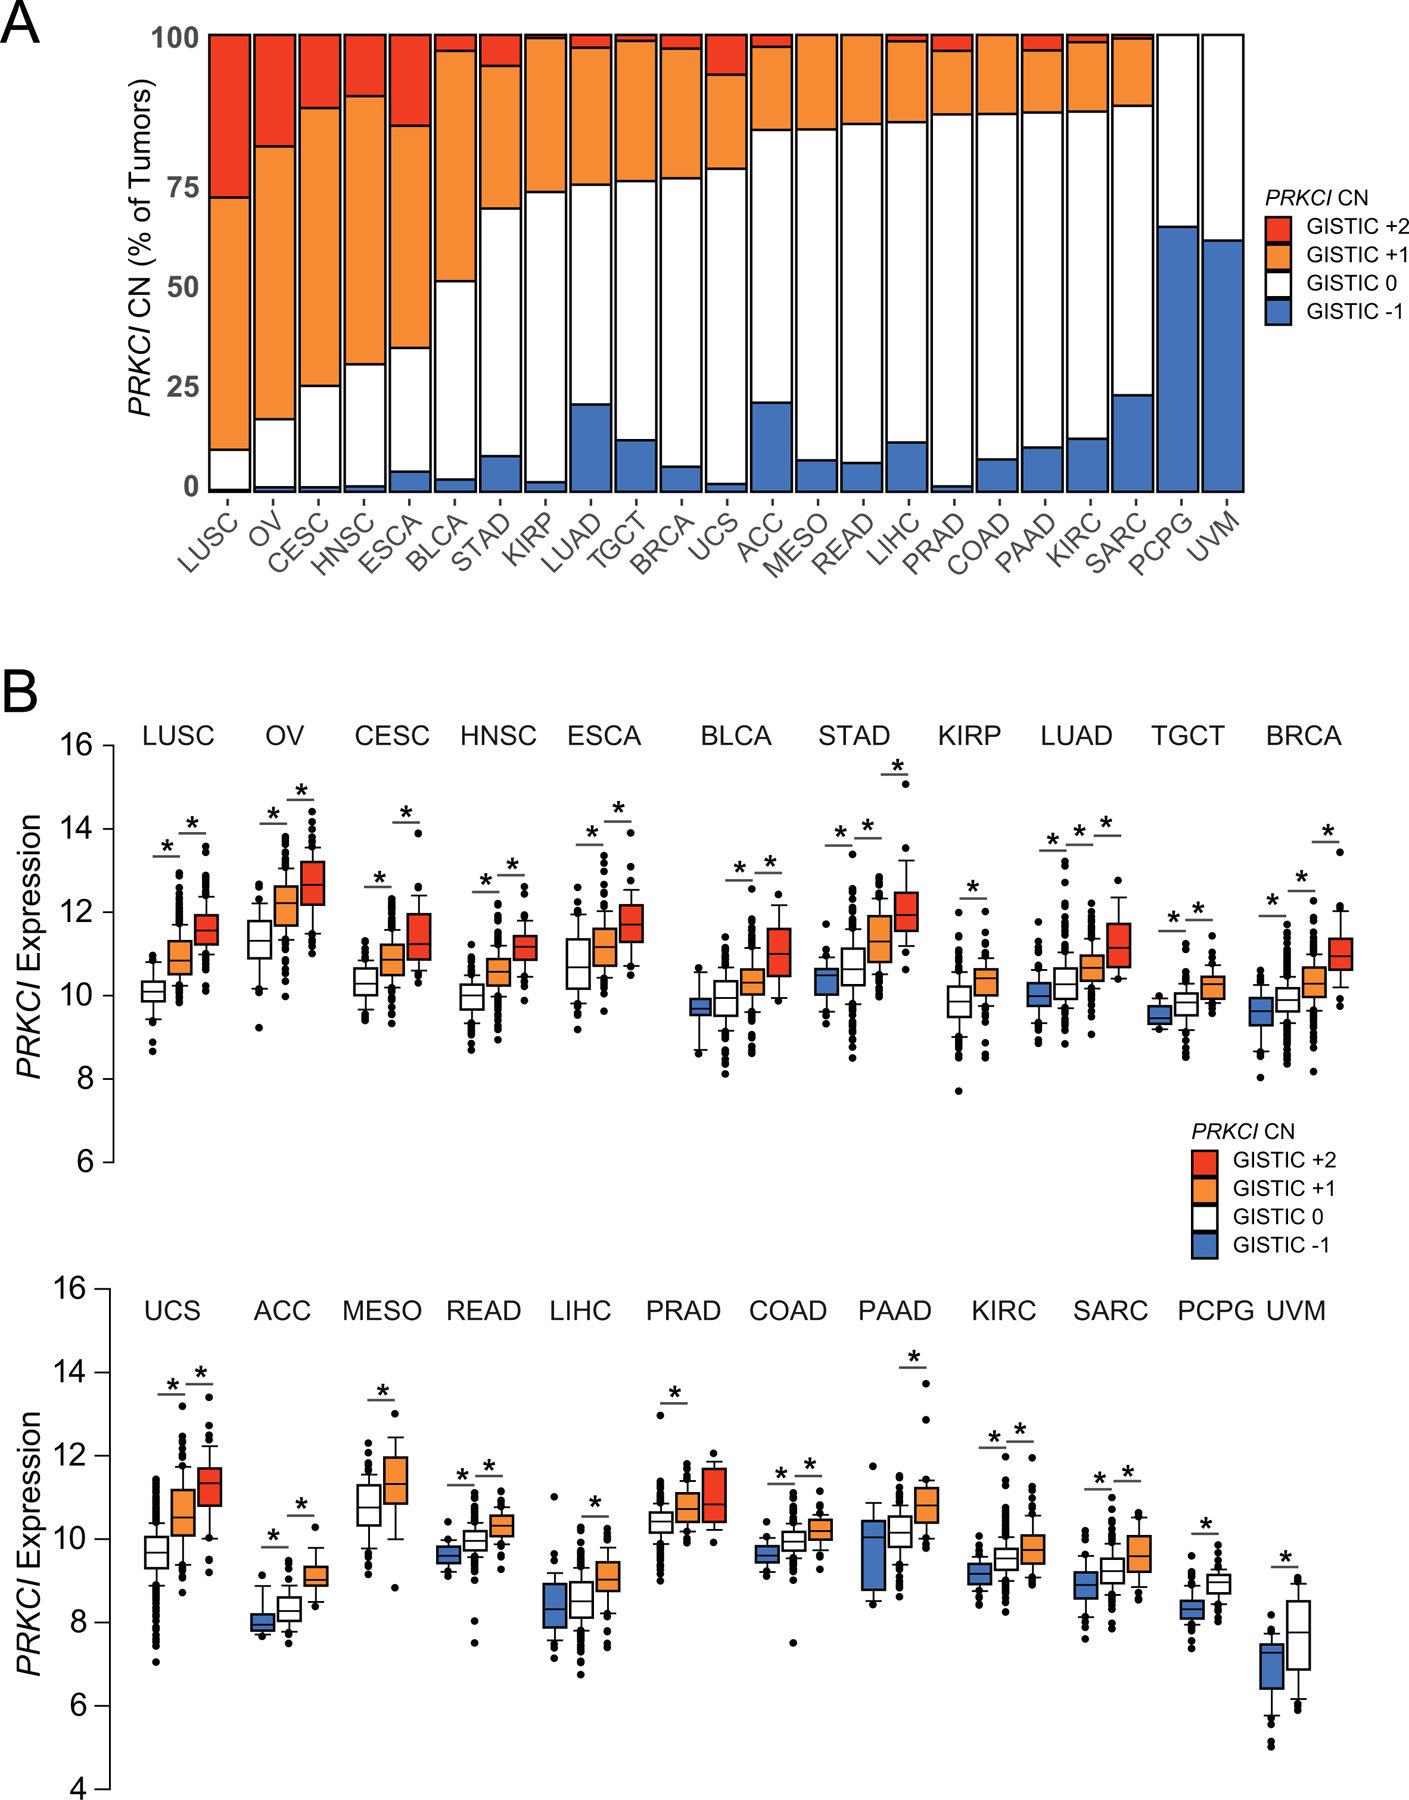
A. Prevalence of PRKCI copy number alterations in major tumor types. GISTIC score −1, 0, +1, +2 plotted for each tumor type.
B. PRKCI mRNA expression plotted by PRKCI GISTIC score (−1, 0, +1, +2) for each tumor type. Data represents median, boxes indicate 25% and 75% confidence intervals; error bars indicate 95% confidence scores. Lines and * above adjacent individual bars indicates a significant (p≤0.05) difference in PRKCI mRNA expression between GISTIC categories. CN=copy number. The number of tumors in each tumor type, and in each GISTIC category is provided in Supplemental Table 1.
We previously demonstrated that PRKCI CNG drives expression of PRKCI mRNA and protein in LUSC (Justilien et al., 2014). To assess whether PRKCI CNG also drives PRKCI mRNA expression in other tumor types, we determined PRKCI mRNA levels in all tumor types as a function of PRKCI copy number (Figure 2B). In all cancer types, tumors harboring PRKCI CNG exhibited elevated PRKCI mRNA expression when compared to tumors without CNG (Figure 2B). This observation is significant given the prevalence of the 3q26 amplicon, which is among the most frequently amplified regions of the genome in human cancers. These data demonstrate that in virtually all cases, PRKCI is a relevant target of 3q26 CNG in human tumors harboring this genetic alteration. Furthermore, in most cancer types, tumors with monoallelic loss of PRKCI expressed significantly lower PRKCI mRNA than those without monoallelic loss (Figure 2B, Table 1). Based on these data we conclude that copy number alteration is a universal mechanism by which human tumors produce both elevated and reduced PRKCI expression.
Table 1:
Regulation of gene expression by monoallelic loss of 3q26
| Tumor types with GISTIC_−1 category | PRKCI mRNA | ECT2 mRNA | SOX2 mRNA |
|---|---|---|---|
|
p value GISTIC −1 vs 0 |
p value GISTIC −1 vs 0 |
p value GISTIC −1 vs 0 |
|
| ACC | 0.02* | 0.2 | 0.7 |
| BLCA | 0.2 | 0.009 (increased) | 0.7 |
| BRCA | 4 E-05 | 0.4 | 0.007 (increased) |
| COAD | 0.0001 | 0.04 | 0.1 |
| KIRC | 3 E-10 | 6 E-05 | 0.9 |
| LIHC | 0.2 | 0.2 | 0.9 |
| LUAD | 3 E-06 | 0.01 | 0.4 |
| PAAD | 0.1 | 0.4 | 0.07 |
| PCPG | 1 E-15 | 9 E-10 | 0.5 |
| READ | 6 E-06 | 0.02 | 0.2 |
| SARC | 2 E-5 | 0.3 | 0.6 |
| STAD | 0.006 | 0.5 | 0.2 |
| TGCT | 0.006 | 0.1 | 0.8 |
| UVM | 0.003 | 0.5 | 0.9 |
Red text indicates mRNA expression significantly lower in GISTIC_−1 than GISTIC_0 tumor group
A 3q26 amplicon drives coordinate copy number alterations in PRKCI, ECT2 and SOX2 in all major cancer types
We previously showed that 3q26 CNG drives overexpression of PRKCI, ECT2 and SOX2 in LUSC (Liu et al., 2020). Extending this analysis, we demonstrate a highly significant positive correlation between the GISTIC scores of PRKCI and both ECT2 (Figure 3A) and SOX2 (Figure 3B), indicating that CNGs and monoallelic loss of these three genes are highly coordinated in LUSC. Analysis of the TCGA datasets of 21 major tumor types with 3q26 CNG, revealed that in all cases, 3q26 CNG drives coordinate CNG of PRKCI, ECT2 and SOX2 (Supplemental Table 2). Likewise, in tumors harboring PRKCI monoallelic loss, we observe coordinate monallelic loss of ECT2 and SOX2 (data not shown). Thus, both CNG and monoallelic loss of PRKCI, ECT2 and SOX2 is a highly coordinated event in virtually all tumor types examined, indicating that it likely occurs through a single genetic event involving a contiguous chromosomal region encompassing all three of these genes.
Figure 3: 3q26 CNG drives coordinate PRKCI, ECT2 and SOX2 copy number alterations in LUSC.
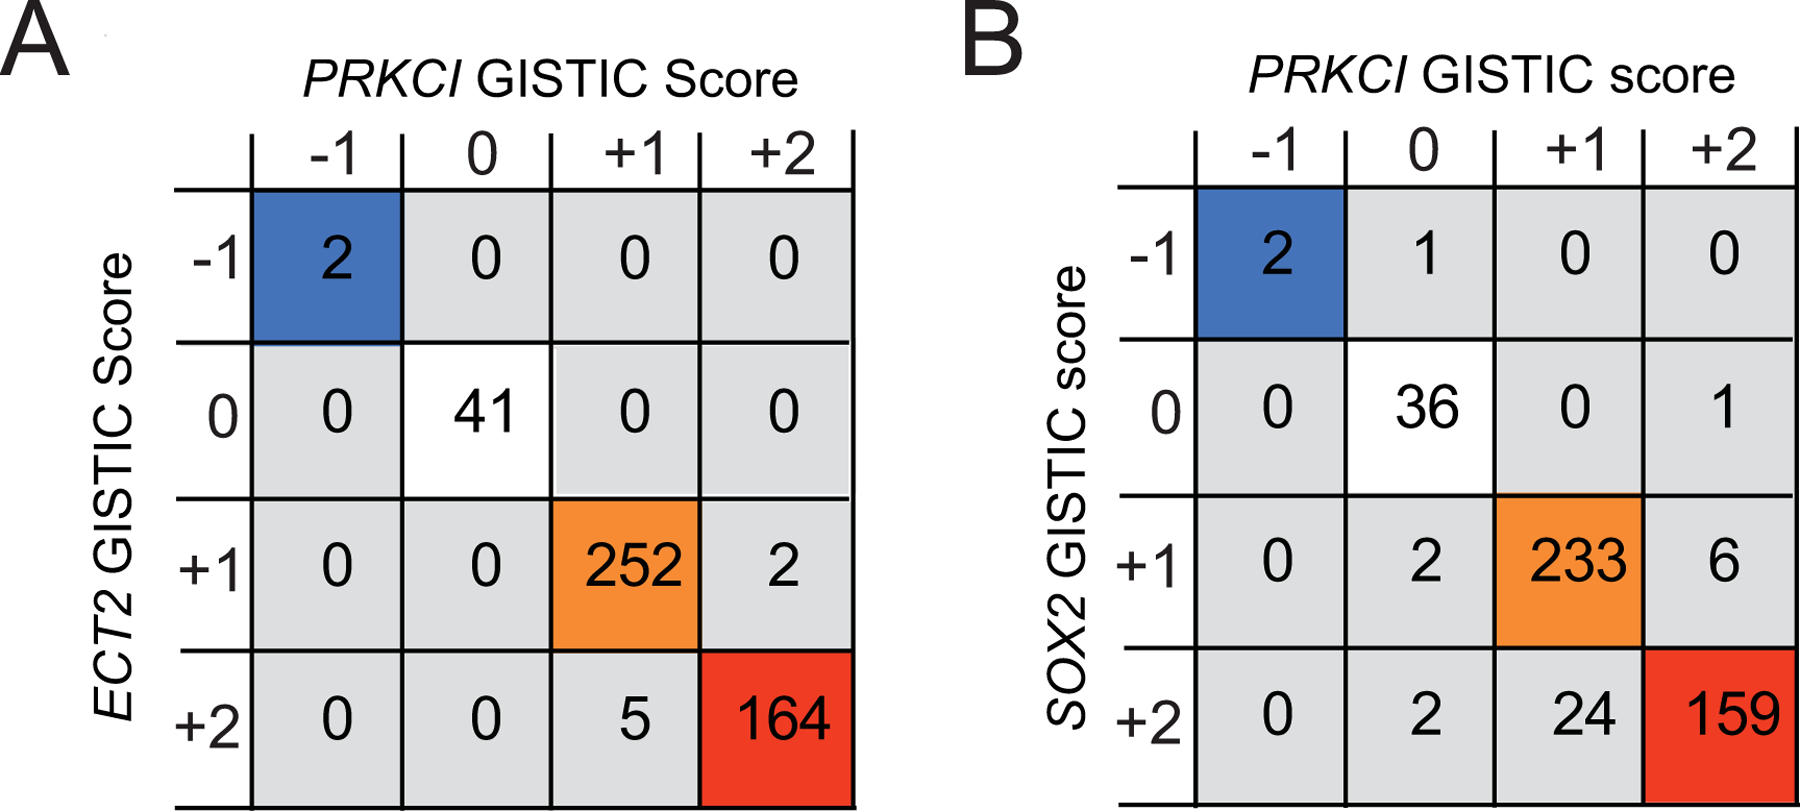
A. Co-occurrence analysis of PRKCI and ECT2 copy number alterations in LUSC. Co-occurring PRKCI and ECT2 allelic loss and copy number gains are indicated by colored boxes. Numbers in boxes indicate number of tumors with corresponding PRKCI and ECT2 GISTIC scores, co-occurrence p<0.001.
B. Co-occurrence analysis of PRKCI and SOX2 copy number alterations in LUSC. Co-occurring PRKCI and SOX2 allelic loss and copy number gains are indicated by colored boxes. p<0.001. Numbers in boxes indicate number of tumors with corresponding PRKCI and SOX2 GISTIC scores, co-occurrence p<0.001.
CNGs differentially drive expression of PRKCI, ECT2 and SOX2 mRNA in different tumor types
3q26 CNG leads not only to coordinate PRKCI, ECT2 and SOX2 CNG (Figure 3), but also to coordinate overexpression of PRKCI, ECT2 and SOX2 mRNA in LUSC tumors (Justilien and Fields, 2009; Justilien et al., 2014). Furthermore, we have demonstrated that the coordinate overexpression of PRKCI, ECT2 and SOX2 leads to activation of oncogenic PKCι-ECT2 and PKCι-SOX2 signaling pathways required for LUSC tumor initiation and maintenance of the transformed phenotype in LUSC harboring 3q26 CNG (Justilien et al., 2017b; Justilien et al., 2014; Liu et al., 2020). We have described a gene expression signature indicative of activated PKCι-ECT2 signaling comprised of 12 ribosomal RNA processing genes whose expression is highly correlated with PRKCI and ECT2 mRNA expression in LUSC (Liu et al., 2020). We have also described a gene expression signature indicative of activated PKCι-SOX2 signaling in LUSC (Liu et al., 2020). This signature is comprised of 9 genes that are direct PKCι-dependent- SOX2 transcriptional targets that we have functionally characterized to play a required role in LUSC transformed growth (Liu et al., 2020). These gene expression signatures can be utilized to generate PKCι-ECT2 and PKCι-SOX2 pathway scores reflecting relative pathway activity for the tumors in TCGA datasets (Figure 1; (Liu et al., 2020)). Therefore, we next assessed whether coordinate CNG of PRKCI, ECT2 and SOX2 leads to elevated expression of ECT2 and SOX2, and activation of PKCι-ECT2 and PKCι-SOX2 signaling in cancer types harboring 3q26 CNGs (Table 2). Interestingly, we observed that 3q26 CNG led to different patterns of PRKCI, ECT2 and SOX2 expression and consequent pathway activation, dependent upon tumor type. First, we observed that ECT2 mRNA is elevated as a consequence of CNG in nearly all tumor types (significantly elevated in 19/21 tumor types; 90.5%) with only two exceptions, Mesothelioma (MESO) and Colon adenocarcinoma (COAD). In contrast, the effect of SOX2 CNG on SOX2 mRNA level was more variable; while some tumor types, like LUSC and HNSC, exhibited a strong correlation between SOX2 CNG and elevated SOX2 mRNA expression, other tumor types, like OV and LUAD, exhibited a significant, but much less robust association between SOX2 CNG and SOX2 mRNA expression (significantly elevated in 11/21 tumor types; 52.4%). Finally, many of the tumor types analyzed, including several with prevalent 3q26 CNG, like Liver (LIHC) and Stomach (STAD) cancers, showed no correlation between SOX2 CNG and mRNA expression. These data indicate that other tumor-specific mechanisms, in addition to SOX2 CNG, may regulate SOX2 expression in these tumor types (Table 2).
CNGs differentially drive PKCι-ECT2 signaling and PKCι-SOX2 signaling in different tumor types
We next assessed whether 3q26 CNG activates the PKCι signaling mechanisms described in LUSC, in other tumor types (Liu et al., 2020). For this purpose, PKCι-ECT2 and PKCι-SOX2 pathway scores were calculated for all tumor types with 3q26 CNGs. The results of this analysis revealed differential activation of PKCι-ECT2 and PKCι-SOX2 pathways across tumor types (experimental details are described in Methods and (Liu et al., 2020). The differential effects of 3q26 CNG on PRKCI, ECT2 and SOX2 mRNA expression, and PKCι-ECT2 and PKCι-SOX2 pathway scores, allow classification of human cancers into four major groups (Table 2).
Group 1 tumors exhibit the pattern we originally reported in LUSC; namely 3q26 CNG leads to coordinate CNGs and overexpression of PRKCI, ECT2 and SOX2, with significant elevation of both PKCι-ECT2 and PKCι-SOX2 pathway scores (5/23, 21.7% of tumors; Table 2). Interestingly, Group 1 tumors include all forms of squamous tumors analyzed, including squamous carcinomas of the Lung, Cervix, Esophagus and Head and Neck. Somewhat surprisingly, Breast invasive carcinoma (BRCA) is also classified as Group 1 based on these criteria, despite the fact that squamous BRCA tumors are extremely rare (Badge et al., 2014). Interestingly, 3q26 CNG is differentially detected in the different subtypes of BRCA described by gene expression (Cancer Genome Atlas, 2012), and is significantly associated with tumor aggressiveness and distant metastasis of the immunohistochemically-defined, Triple negative breast cancer (TNBC) BRCA subtype, which shows significant overlap with the aggressive, Basal BRCA subtype (Milioli et al., 2017; Qian et al., 2017). PKCι has been implicated in growth and metastasis of TNBC, and a 110 gene signature of PKCι signaling in breast cancer is predictive of invasive progression of patient breast cancer and poor clinical outcome (Paul et al., 2014; Rosse et al., 2014). We report that CNG drives elevated PRKCI mRNA expression in BRCA tumors (Figure 2B), and 3q26 CNGs are significantly more prevalent in Basal BRCA tumors compared to the other BRCA subtypes (Figure 4A). We therefore asked if PRKCI mRNA expression and PKCι-ECT2 and PKCι-SOX2 pathways were differentially activated in BRCA subtypes (Figure 4). PRKCI is more highly expressed in the Basal BRCA subtype than other BRCA subtypes (Figure 4B). In addition, both PKCι-ECT2 and PKCι-SOX2 pathway scores were non-randomly distributed across BRCA subtypes, with the Basal subtype exhibiting significantly higher PKCι-ECT2 (Figure 4C) and PKCι-SOX2 (Figure 4D) pathway score than all other subtypes. These data suggest that 3q26 CNG is a useful biomarker of this clinically challenging subset of BRCA, and that oncogenic PKCι-ECT2 and PKCι-SOX2 signaling pathways play a critical role in the aggressive nature of Basal BRCA. These data further suggest that inhibitors of oncogenic PKCι signaling may be a novel intervention strategy for improved treatment of these highly aggressive, therapeutically resistant tumors.
Figure 4: Distribution of 3q26 copy number alterations, PRKCI mRNA expression and PKCι oncogenic signaling pathway activity in Breast cancer subtypes.
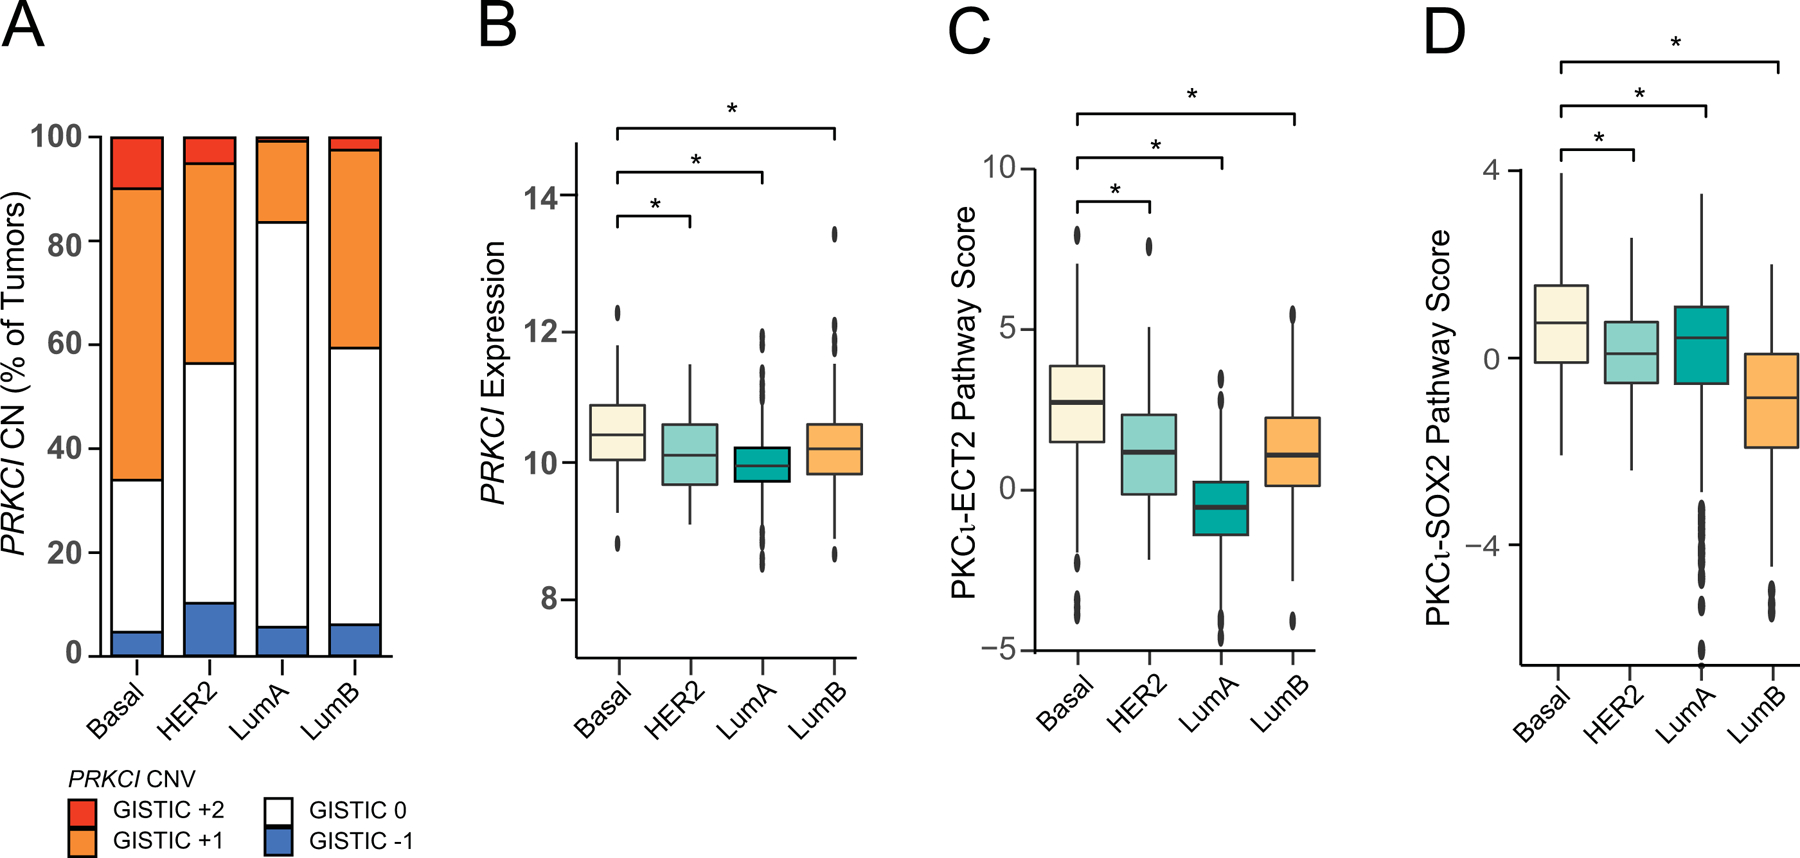
A. Distribution of tumors by PRKCI GISTIC score −1, 0, +1, +2 plotted for each BRCA subtype. CN=copy number. CNG (GISTIC +1, +2) enriched in Basal subtype, p<2× 10⁻¹⁶.
B. Distribution of PRKCI mRNA expression across BRCA subtypes. Basal vs HER2 p=6 ×10⁻⁴; Basal vs LumA p<2× 10⁻¹⁶; Basal vs LumB p=3 ×10⁻⁴.
C. Distribution of PKCι-ECT2 pathway activity across BRCA subtypes. PKCι-ECT2 Pathway score (see Methods for details) is plotted for each breast cancer subtype. Basal vs HER2 p=9 × 10⁻⁷; Basal vs LumA p<2×10⁻¹⁶; Basal vs LumB p=1 × 10⁻¹¹.
D. Distribution of PKCι-SOX2 pathway activity across BRCA subtypes. PKCι-SOX2 Pathway score (see Methods for details) is plotted for each breast cancer subtype. Data represents median, boxes indicate 25% and 75% confidence intervals; error bars indicate 95% confidence scores. Basal vs HER2 p=2×10⁻⁴; Basal vs LumA p=1×10⁻⁴; Basal vs LumB p<2× 10⁻¹⁶.
Basal, n=172; HER2, n=78; LumA, n=499; LumB, n=197.
Group 2 tumors are characterized by CNG-driven PRKCI and ECT2 mRNA expression (12/23, 52.2% of tumors; Table 2). As a consequence, Group 2 tumors with CNG exhibit significantly elevated PKCι-ECT2 pathway score (Table 2). Group 2 tumors can be further divided into 2 subtypes. In Group 2A tumors, including OV, BLCA, LUAD, and Uterine (UCS) cancers, SOX2 expression, but not PKCι-SOX2 pathway score, is significantly increased in tumors with 3q26 CNGs. The observation that OV tumors with 3q26 CNG exhibit significantly elevated PRKCI, ECT2 and SOX2 expression, and PKCι-Ect2 pathway score, but not PKCι-SOX2 pathway score, compared to OV tumors without CNG, is consistent with our previous report that the PKCι-SOX2-Hedgehog signaling pathway is not activated in human OV cell lines (Wang et al., 2017). Since the PKCι-SOX2 signaling pathway was defined in LUSC, and contributes to the squamous lineage of LUSC, this raises the interesting possibility that the coordinate overexpression of PRKCI and SOX2 observed in Group 2A tumors (and Group 3A tumors, discussed below) may drive activation of a distinct non-squamous, oncogenic PKCι-SOX2 signaling program in these cancer types.
Group 2B tumors do not exhibit elevated SOX2 mRNA expression or PKCι-SOX2 pathway score (see exceptions below) associated with 3q26 CNG. Group 2B tumors include Adrenocortical carcinoma (ACC), LIHC, Pancreatic adenocarcinoma (PAAD), Prostate adenocarcinoma (PRAD), Rectal adenocarcinoma (READ) and STAD cancers, as well as Sarcoma (SARC) and Kidney renal papillary cell carcinoma (KIRP), in which, uniquely, increased PKCι-SOX2 pathway score, but not SOX2 expression, is associated with CNG. The observation that there is no correlation between the level of SOX2 mRNA expression and SOX2 copy number in many of the tumor types analyzed, including several with a high percent of tumors with 3q26 CNGs (like STAD and KIRP), is novel, and suggests that additional epigenetic or transcriptional factors may regulate SOX2 mRNA expression in these tumor types (Table 2).
In Group 3 tumors, expression of PRKCI is driven by CNG, but neither combination of ECT2 expression and PKCι-ECT2 pathway score, nor SOX2 expression and PKCι-SOX2 pathway score, are significantly increased in tumors with 3q26 CNGs (4/23, 17.4% of tumor types; Table 2). Group 3A tumors exhibit CNG-driven ECT2 expression (Kidney Renal clear cell Cell Carcinoma (KIRC) and Testicular Germ Cell tumors (TGCT)), while Group 3B tumor types do not exhibit CNG-driven ECT2 or SOX2 expression (MESO and COAD, Table 2). In most of these Group 3 cancers, it remains unclear what role 3q26 CNGs, and CNG-driven PRKCI expression play in development and maintenance of the cancer phenotype. However we and others have shown that PRKCI mRNA and protein are overexpressed in human colon cancer when compared to associated normal colon tissue (Calcagno et al., 2008; Reina-Campos et al., 2019), and Prkci has been implicated as a driver of tumor progression in multiple mouse mouse models of intestinal tumorigenesis (Murray et al., 2004; Murray et al., 2009), suggesting CNG-driven PRKCI expression may be an oncogenic driver in this tumor type, as well. Our current data suggest that unique oncogenic PKCι pathways remain to be identified that may be operative in these tumors.
Monoallelic loss of 3q26 reduces PRKCI expression and activates PKCι-independent signaling
Finally, Group 4 tumors (PCPG and UVM) exhibit no CNGs, but do exhibit monoallelic loss of 3q26, a genomic alteration signature typically associated with a tumor suppressor, rather than an oncogenic driver (Figure 2A, 2/23; 8.7% of tumors; Table 2). Interestingly however, in UVM, loss of PRKCI copy number is not due to a focal deletion of chromosomal region 3q26, but rather involves either partial deletion of chromosome 3 or loss of the entire chromosome 3 (Kilic et al., 2005; Rodrigues et al., 2020). Chromosome 3 monosomy has previously been shown to predict poor disease-free survival of UVM patients, and the tumor suppressor BAP1 has been identified as the relevant target of this chromosome 3 loss (Rodrigues et al., 2020).
The observation that monoallelic loss at 3q26 is detected in many of the tumor types analyzed (Figure 2A) and corresponds to a significant decrease in PRKCI mRNA in 11 of 14 tumor types evaluated (Figure 2B and Table 1), led us to assess whether reduced gene copy number of ECT2 and SOX2 (GISTIC score −1) also resulted in a significant decrease in expression of their gene products. Interestingly, ECT2 loss significantly reduced ECT2 mRNA expression in only 4 of 14 tumor types assessed, and SOX2 mRNA was not significantly reduced by monoallelic loss in any of the tumor types evaluated (GISTIC score −1 vs 0; Table 1). Taken together, these data reveal that PRKCI expression is uniquely downregulated by monoallelic loss at 3q26, suggesting that activation of non-PKCι-dependent signaling pathways may occur in these subsets of tumors.
We recently identified a distinct subset of human LUAD characterized by a lack of dependence on PKCι signaling and an increased dependence on WNT/β-catenin signaling (Yin et al., 2019). Interestingly, WNT/β-catenin and RAS-ERK signaling pathways have been shown to cooperatively promote cancer stem cell activation in multiple tumor models, and crosstalk between these oncogenic pathways plays a critical role in tumorigenesis of colorectal and other cancers (reviewed in (Lee et al., 2018)). We have described a required role for PKCι-RAC1-MEK-ERK signaling downstream of oncogenic KRAS in multiple cancer types (Murray et al., 2004; Regala et al., 2009; Scotti et al., 2010). Our recent findings demonstrating an inverse relationship between PKCι and WNT signaling (Yin et al., 2019), suggests that the oncogenic effects of KRAS can be mediated either by WNT signaling-mediated RAS activation and stabilization, or by overexpression of the RAS downstream mediator, PKCι. To assess whether WNT/β-catenin signaling is activated in the subset of tumors expressing low PRKCI (GISTIC −1) in other cancer types, differential gene expression analysis and GSEA pathway analysis was performed on tumor types with 3q26 CNG and monoallelic loss subpopulations. In 9 of the 12 tumor types evaluated, the PRKCI-low (GISTIC score −1) subset of tumors exhibited enrichment of a WNT/β-catenin pathway score compared to the PRKCI-high (GISTIC score +1,+2) subset, with 5 of these tumor types exhibiting significant enrichment (FDR<0.25; Figure 5). This result indicates that WNT/β-catenin signaling represents an alternative, PKCι-independent phenotype in many tumor types that may signify a unique therapeutic vulnerability to WNT/β-catenin pathway inhibitors in multiple cancer types harboring monoallelic loss of PRKCI, just as we described in LUAD (Yin et al., 2019).
Figure 5: Multiple tumor types exhibit enrichment of WNT/β-catenin pathway signature associated with 3q26 monoallelic loss.
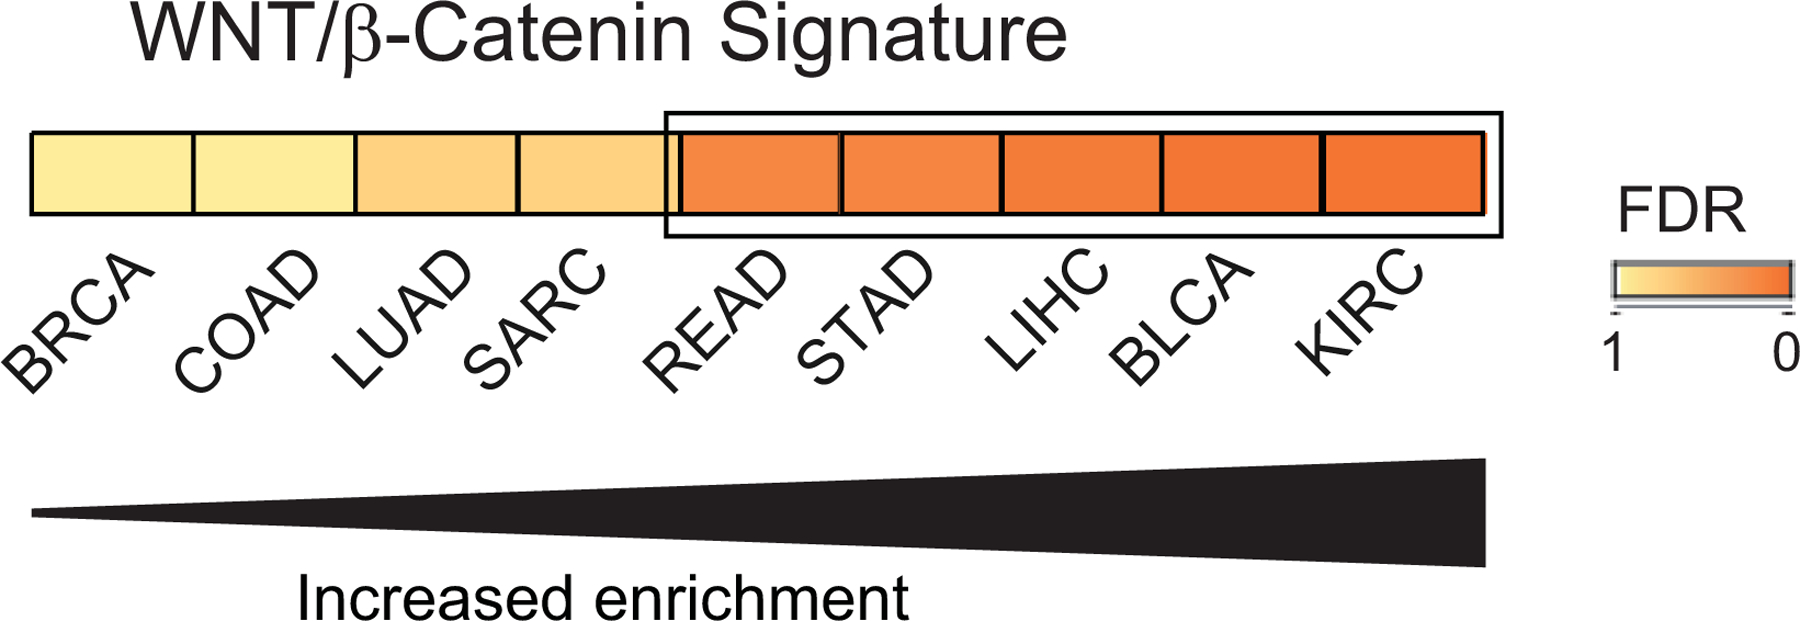
Twelve tumor types were analyzed for WNT/β-catenin pathway activation as described in Methods. Nine tumor types showed enrichment of the WNT/β-catenin pathway signature in tumors with 3q26 monoallelic loss compared to tumors with 3q26 gains; with 5 tumor types (boxed) showing significant enrichment (FDR≤0.25)
Genomic alteration, functional characterization and clinical correlations support an oncogenic role for PRKCI in many tumor types.
It has been hypothesized that PRKCI may function as a tumor suppressor in certain contexts, perhaps via its role in maintaining epithelial polarity, by functionally preventing epithelial mesenchymal transition, or via PKCι-mediated immunosuppression. For instance, genetic loss of PRKCI in the intestinal epithelium contributes to inflammatory conditions that promote tumor initiation (Calcagno et al., 2011; Nakanishi et al., 2016). However, there is little evidence that PRKCI functions as a tumor suppressor in major human tumor types (reviewed in (Reina-Campos et al., 2019)). If PRKCI were a bonafide tumor suppressor, one would predict that 3q26 loss would be more frequently observed, and that deep deletion (GISTIC score −2, indicating loss of both alleles), of at least of key tumor suppressive gene(s) within the 3q26 amplicon, would be observed. Interrogation of the TCGA dataset revealed that deep loss of PRKCI does not occur in any tumor type. Furthermore, if PRKCI were a tumor suppressor, copy number loss would likely be associated with poor patient outcome. However, our analysis revealed that monoallelic loss of 3q26 is associated with poor survival in only one of the 14 tumor types harboring significant 3q26 loss, UVM. UVM is one of the two tumor types exhibiting only 3q26 loss and no CNG ((Kilic et al., 2005), data not shown). However, as mentioned above, UVM exhibits frequent loss of the entire chromosome 3 not just 3q26, and BAP1 has been identified as the relevant tumor suppressor target in this tumor type (Kilic et al., 2005; Rodrigues et al., 2020). On the other hand, the high prevalence of PRKCI CNGs, which is associated with elevated PRKCI expression and activation of oncogenic PKCι signaling axes in many major tumor types supports a tumor-promotive, rather than tumor-suppressive role for PRKCI in human cancers.
It has been further hypothesized that missense mutations in PRKCI may be loss of function, and thereby serve to inhibit a tumor suppressive function of PRKCI. However, analysis of the TCGA data demonstrate that missense mutations or truncations in PRKCI are extremely rare. Furthermore, the majority of these rare mutations are randomly distributed throughout the molecule rather than clustered within a specific functional “hot spot” and are not associated with loss of heterozygosity as would be expected of mutations that inactivate a tumor suppressor (Reina-Campos et al., 2019). In this regard, the only recurrent somatic mutation in PRKCI observed in human tumors, though still quite rare, PRKCI R480S/C/H, confers a change in PKCι substrate specificity rather than a loss in kinase activity (Linch et al., 2013). Thus, to date there has been no functional data to indicate that any of the extremely rare PRKCI mutations found in human tumors inhibit or impair PRKCI function in vitro or in the context of the tumors in which they reside. In the absence of such critical functional characterization, and in light of the random distribution, rarity and lack of loss of heterozygosity associated with these mutations, it seems likely these are passenger mutations of little consequence to the tumors that harbor them. In stark contrast, PRKCI has been validated as an oncogene in many tumor types, and high PKCι protein expression predicts poor survival in pancreatic (Scotti et al., 2010), lung (Regala et al., 2005b), ovarian (Eder et al., 2005) and prostate cancers (Ishiguro et al., 2011). We extended this analysis by assessing the prognostic value of 3q26 CNG-driven PKCι oncogenic signaling in human tumors. For this analysis, we utilized a PKCι-ECT2 pathway score as an indicator of PKCι activity, since this gene expression signature is significantly elevated in tumors with 3q26 CNG, in 17 of the 21 tumor types analyzed. We found that elevated PKCι-ECT2 pathway score was significantly associated with poor overall survival in 11 of these 17 tumor types (Figure 6). These data support an oncogenic driver role for PKCι-ECT2 signaling in these tumor types and predict that these tumors may be uniquely sensitive to therapeutics targeting this signaling pathway, just as we previously characterized in lung cancer (Justilien et al., 2017a; Justilien et al., 2017b).
Figure 6: 3q26 CNG-associated PKCι-ECT2 pathway activity predicts poor patient survival.
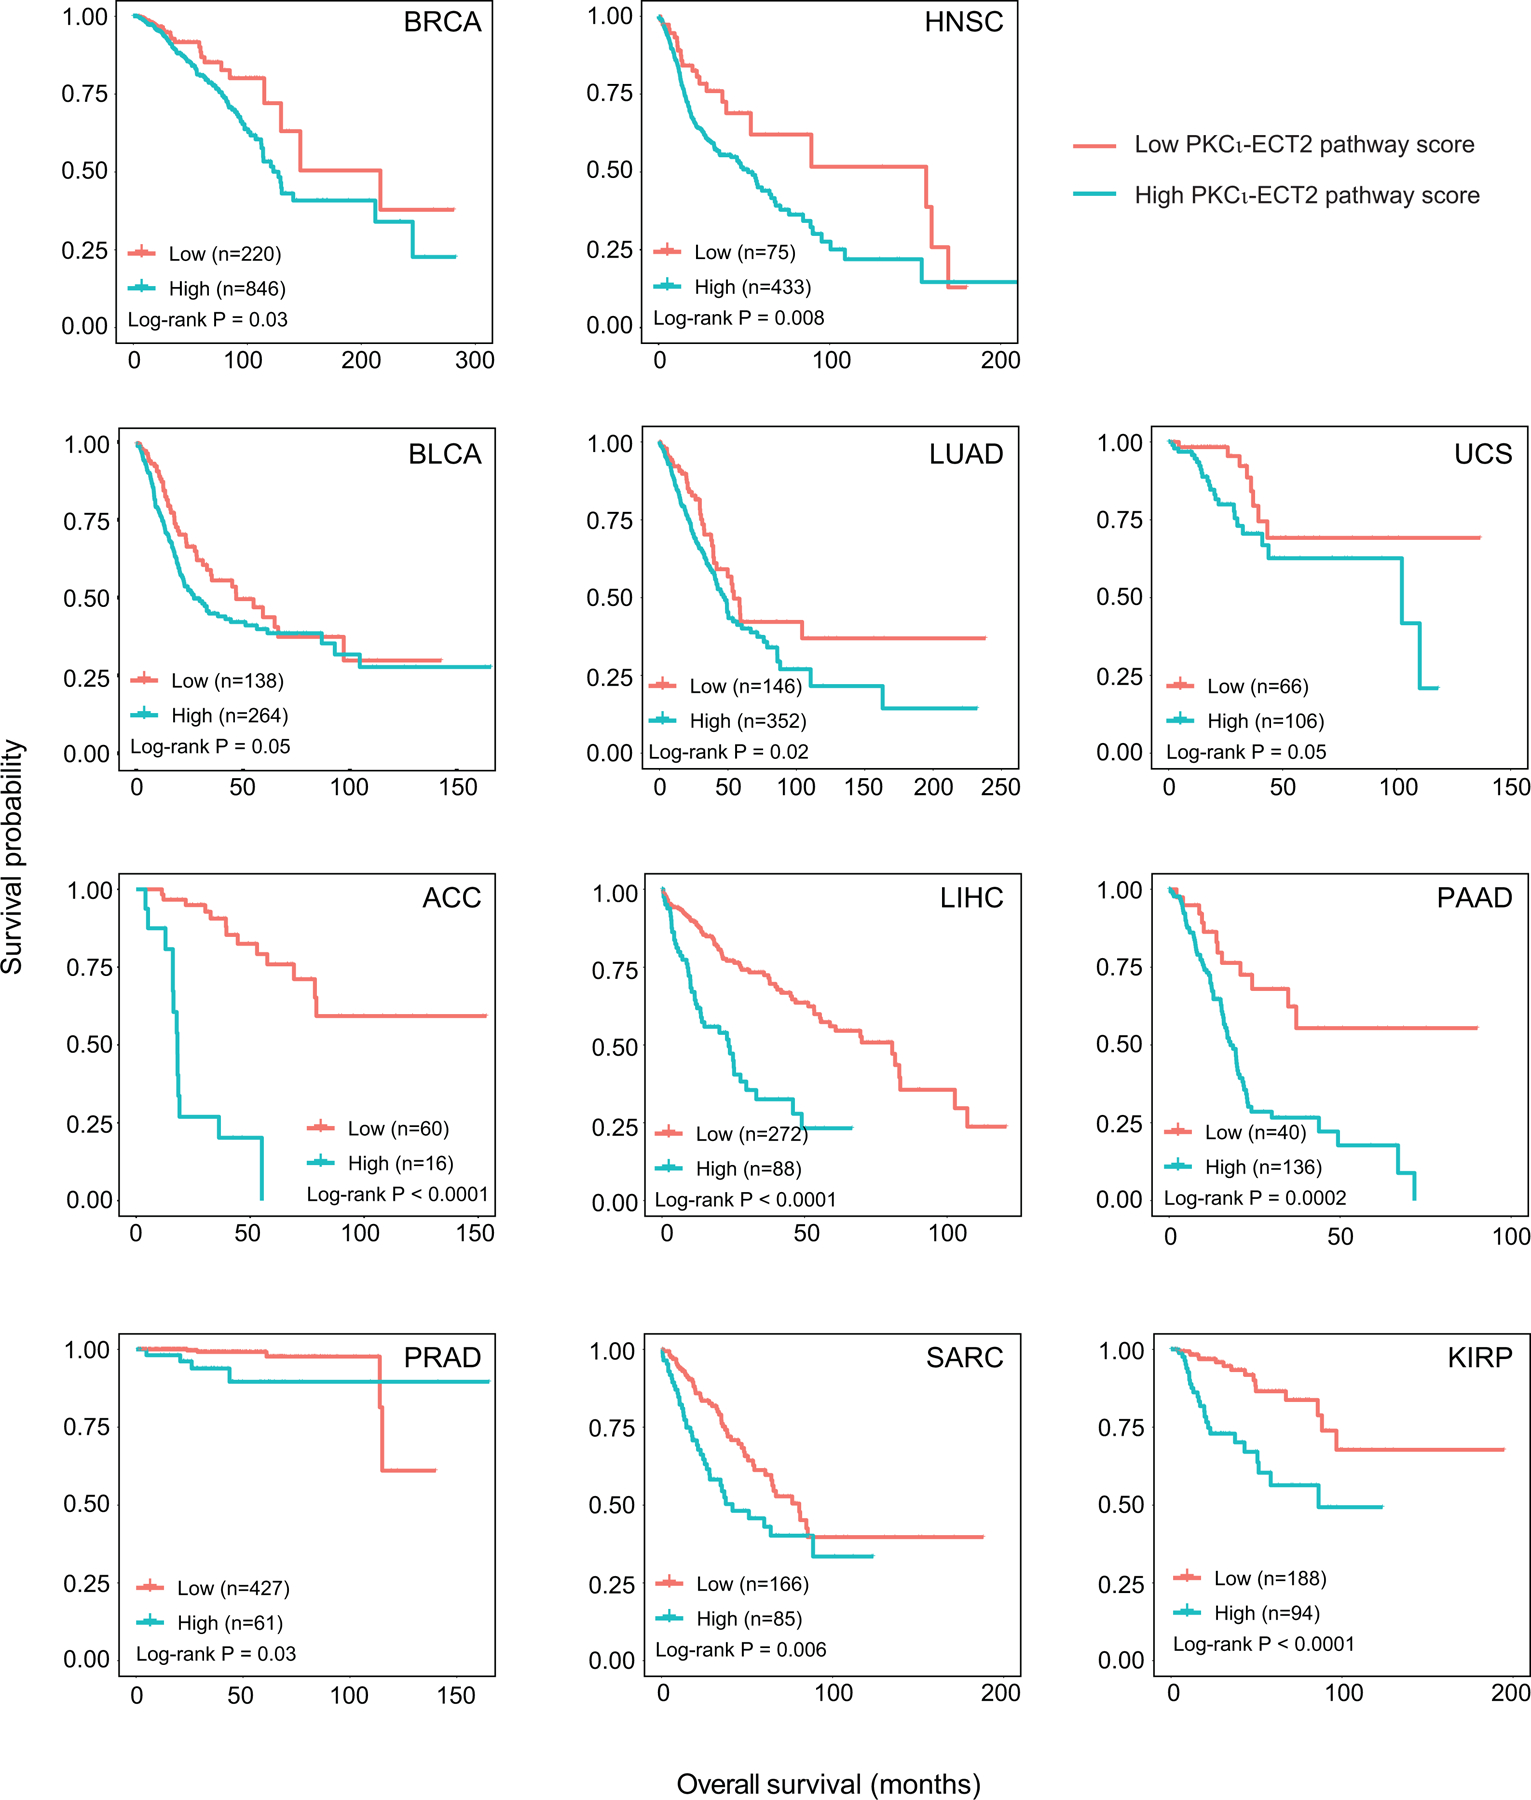
Kaplan-Meier survival plots of patients grouped by PKCι-ECT2 Pathway score for each tumor type. Group size indicated by (n= ); p values for the two-sided log rank test are shown.
Conclusion
Chromosomal region 3q26 is one of the most frequent targets for copy number alteration in human cancers. In this report, we analyze the impact of 3q26 copy number alterations on expression of three 3q26 oncogenes, oncogenic PKCι signaling, and patient prognosis. Our analysis reveals that 3q26 CNG is a major driver of PRKCI expression in essentially all tumor types analyzed, even those with a relatively low frequency of CNG. The fact that PRKCI mRNA expression so closely tracks with PRKCI copy number, coupled with the fact that this genomic alteration is an early and sustained alteration in multiple tumor types such as lung and ovarian cancer, strongly supports the role of elevated PKCι as an oncogenic driver in multiple tumor types (Liu et al., 2020; Sarkar et al., 2017; Yin et al., 2020). Our findings indicate that CNG analysis combined with PKCι pathway score analysis may allow identification of effective new therapeutic intervention strategies to target PKCι-driven oncogenic signaling pathways (Justilien et al., 2017a; Justilien et al., 2014; Yin et al., 2020) in many major cancer types, including the therapeutically-resistant Basal BRCA subtype. The PKCι oncogenic signaling analysis in this study utilized gene expression signatures of activated PKCι-ECT2 and PKCι-SOX2 oncogenic pathways identified in LUSC; our results indicate that in some cancers, 3q26 gene copy alterations may drive activation of other, as yet uncharacterized, tumor type-specific PKCι-ECT2 and PKCι-SOX2 signaling pathways. This possibility remains to be investigated.
Interestingly, this study also reveals that monoallelic loss of PRKCI significantly reduces PRKCI mRNA expression in many human cancers, and that PRKCI loss is associated with an increase in activated WNT/β-catenin signaling in many of these cancers. Taken together, these data support the premise that 3q26 CNG can be an effective biomarker to predict responsiveness to PKCι-targeted therapy.
Supplementary Material
Acknowledgements
We acknowledge members of our laboratories for their scientific input to this manuscript. We thank Dr. Xue Wang for assistance in downloading TCGA datasets. This work was supported by grants from the National Institutes of Health/National Cancer Institute (R01 CA081436-21 and R01 CA206267-03 to APF; R01 CA140290-05 to NRM; R03 CA235189 to VJ). APF is the Monica Flynn Jacoby Professor of Cancer Research, an endowment fund that provides partial support for the investigator’s research program. VJ was supported in part by a Mayo Clinic Center for Biomedical Discovery Career Development Award and an American Cancer Society Research Scholar Award (RGS-18-201-01). YL is a recipient of the Edward C. Kendall Fellowship in Biochemistry from the Mayo Clinic Graduate School. The funding sources had no involvement in the study design, collection, analysis and interpretation of data, nor writing or decision to submit article for publication.
Abbreviations
- ANOVA
analysis of variance
- aPKC
atypical PKC
- CNG
copy number gains
- FDR
false discovery rate
- GEF
guanine nucleotide exchange factor
- GISTIC
Genomic Identification of Significant Targets In Cancer
- GSEA
Gene Set Enrichment Analysis
- LBSC
lung basal stem cell
- PB1
Phox-Bem1
- PRKCI
PKCι (gene/mRNA, protein), Protein kinase C iota
- PKCζ
protein kinase C zeta
- TNBC
triple negative breast cancer
All TCGA study datasets are abbreviated using TCGA study abbreviations.
Footnotes
Declaration of competing interest
The authors have no conflicts of interest to declare.
References
- Ali SA, Justilien V, Jamieson L, Murray NR, Fields AP, 2016. Protein Kinase Ciota Drives a NOTCH3-dependent Stem-like Phenotype in Mutant KRAS Lung Adenocarcinoma. Cancer Cell 29(3), 367–378. [DOI] [PMC free article] [PubMed] [Google Scholar]
- Badge SA, Gangane NM, Shivkumar VB, Sharma SM, 2014. Primary squamous cell carcinoma of the breast. Int J Appl Basic Med Res 4(1), 53–55. [DOI] [PMC free article] [PubMed] [Google Scholar]
- Budczies J, Klauschen F, Sinn BV, Gyorffy B, Schmitt WD, Darb-Esfahani S, Denkert C, 2012. Cutoff Finder: a comprehensive and straightforward Web application enabling rapid biomarker cutoff optimization. PLoS One 7(12), e51862. [DOI] [PMC free article] [PubMed] [Google Scholar]
- Calcagno SR, Li S, Colon M, Kreinest PA, Thompson EA, Fields AP, Murray NR, 2008. Oncogenic K-ras promotes early carcinogenesis in the mouse proximal colon. Int J Cancer 122(11), 2462–2470. [DOI] [PMC free article] [PubMed] [Google Scholar]
- Calcagno SR, Li S, Shahid MW, Wallace MB, Leitges M, Fields AP, Murray NR, 2011. Protein kinase C iota in the intestinal epithelium protects against dextran sodium sulfate-induced colitis. Inflamm Bowel Dis 17(8), 1685–1697. [DOI] [PMC free article] [PubMed] [Google Scholar]
- Cancer Genome Atlas, N., 2012. Comprehensive molecular portraits of human breast tumours. Nature 490(7418), 61–70. [DOI] [PMC free article] [PubMed] [Google Scholar]
- Chen J, Zhang M, 2013. The Par3/Par6/aPKC complex and epithelial cell polarity. Experimental Cell Research 319(10), 1357–1364. [DOI] [PubMed] [Google Scholar]
- Davidson MA, Shanks EJ, 2017. 3q26–29 Amplification in head and neck squamous cell carcinoma: a review of established and prospective oncogenes. FEBS J 284(17), 2705–2731. [DOI] [PubMed] [Google Scholar]
- Eder AM, Sui X, Rosen DG, Nolden LK, Cheng KW, Lahad JP, Kango-Singh M, Lu KH, Warneke CL, Atkinson EN, Bedrosian I, Keyomarsi K, Kuo WL, Gray JW, Yin JC, Liu J, Halder G, Mills GB, 2005. Atypical PKCiota contributes to poor prognosis through loss of apical-basal polarity and cyclin E overexpression in ovarian cancer. Proc Natl Acad Sci U S A 102(35), 12519–12524. [DOI] [PMC free article] [PubMed] [Google Scholar]
- Fields AP, Justilien V, Murray NR, 2016. The chromosome 3q26 OncCassette: A multigenic driver of human cancer. Adv Biol Regul 60, 47–63. [DOI] [PMC free article] [PubMed] [Google Scholar]
- Grunicke HH, Spitaler M, Mwanjewe J, Schwaiger W, Jenny M, Ueberall F, 2003. Regulation of cell survival by atypical protein kinase C isozymes. Adv Enzyme Regul 43, 213–228. [DOI] [PubMed] [Google Scholar]
- Hellbert K, Kampfer S, Maly K, Hochholdinger F, Mwanjewe J, Baier G, Uberall F, Grunicke HH, 2000. Implication of atypical protein kinase C isozymes lambda and zeta in Ras mediated reorganization of the actin cytoskeleton and cyclin D1-induction. Adv Enzyme Regul 40, 49–62. [DOI] [PubMed] [Google Scholar]
- Isakov N, 2018. Protein kinase C (PKC) isoforms in cancer, tumor promotion and tumor suppression. Semin Cancer Biol 48, 36–52. [DOI] [PubMed] [Google Scholar]
- Ishiguro H, Akimoto K, Nagashima Y, Kagawa E, Sasaki T, Sano JY, Takagawa R, Fujinami K, Sasaki K, Aoki I, Ohno S, Kubota Y, Uemura H, 2011. Coexpression of aPKClambda/iota and IL-6 in prostate cancer tissue correlates with biochemical recurrence. Cancer Sci 102(8), 1576–1581. [DOI] [PubMed] [Google Scholar]
- Justilien V, Ali SA, Jamieson L, Yin N, Cox AD, Der CJ, Murray NR, Fields AP, 2017a. Ect2-Dependent rRNA Synthesis Is Required for KRAS-TRP53-Driven Lung Adenocarcinoma. Cancer Cell 31(2), 256–269. [DOI] [PMC free article] [PubMed] [Google Scholar]
- Justilien V, Fields AP, 2009. Ect2 links the PKCiota-Par6alpha complex to Rac1 activation and cellular transformation. Oncogene 28(41), 3597–3607. [DOI] [PMC free article] [PubMed] [Google Scholar]
- Justilien V, Lewis KC, Murray NR, Fields AP, 2017b. Oncogenic Ect2 signaling regulates rRNA synthesis in NSCLC. Small GTPases, 1–7. [DOI] [PMC free article] [PubMed]
- Justilien V, Walsh MP, Ali SA, Thompson EA, Murray NR, Fields AP, 2014. The PRKCI and SOX2 oncogenes are coamplified and cooperate to activate Hedgehog signaling in lung squamous cell carcinoma. Cancer Cell 25(2), 139–151. [DOI] [PMC free article] [PubMed] [Google Scholar]
- Kilic E, Naus NC, van Gils W, Klaver CC, van Til ME, Verbiest MM, Stijnen T, Mooy CM, Paridaens D, Beverloo HB, Luyten GP, de Klein A, 2005. Concurrent loss of chromosome arm 1p and chromosome 3 predicts a decreased disease-free survival in uveal melanoma patients. Invest Ophthalmol Vis Sci 46(7), 2253–2257. [DOI] [PubMed] [Google Scholar]
- Koeneman MM, Ovestad IT, Janssen EAM, Ummelen M, Kruitwagen R, Hopman AH, Kruse AJ, 2019. Gain of Chromosomal Region 3q26 as a Prognostic Biomarker for High-Grade Cervical Intraepithelial Neoplasia: Literature Overview and Pilot Study. Pathol Oncol Res 25(2), 549–557. [DOI] [PMC free article] [PubMed] [Google Scholar]
- Lee SK, Hwang JH, Choi KY, 2018. Interaction of the Wnt/beta-catenin and RAS-ERK pathways involving co-stabilization of both beta-catenin and RAS plays important roles in the colorectal tumorigenesis. Adv Biol Regul 68, 46–54. [DOI] [PubMed] [Google Scholar]
- Leitges M, Sanz L, Martin P, Duran A, Braun U, Garcia JF, Camacho F, Diaz-Meco MT, Rennert PD, Moscat J, 2001. Targeted disruption of the zetaPKC gene results in the impairment of the NF-kappaB pathway. Mol Cell 8(4), 771–780. [DOI] [PubMed] [Google Scholar]
- Lin D, Edwards AS, Fawcett JP, Mbamalu G, Scott JD, Pawson T, 2000. A mammalian PAR-3-PAR-6 complex implicated in Cdc42/Rac1 and aPKC signalling and cell polarity. Nat Cell Biol 2(8), 540–547. [DOI] [PubMed] [Google Scholar]
- Linch M, Sanz-Garcia M, Soriano E, Zhang Y, Riou P, Rosse C, Cameron A, Knowles P, Purkiss A, Kjaer S, McDonald NQ, Parker PJ, 2013. A Cancer-Associated Mutation in Atypical Protein Kinase Cι Occurs in a Substrate-Specific Recruitment Motif. Scince Signalling In Press. [DOI] [PubMed]
- Liu Y, Yin N, Wang X, Khoor A, Sambandam V, Ghosh AB, Fields ZA, Murray NR, Justilien V, Fields AP, 2020. Chromosome 3q26 Gain Is an Early Event Driving Coordinated Overexpression of the PRKCI, SOX2, and ECT2 Oncogenes in Lung Squamous Cell Carcinoma. Cell Rep 30(3), 771–782 e776. [DOI] [PMC free article] [PubMed] [Google Scholar]
- Mermel CH, Schumacher SE, Hill B, Meyerson ML, Beroukhim R, Getz G, 2011. GISTIC2.0 facilitates sensitive and confident localization of the targets of focal somatic copy-number alteration in human cancers. Genome Biol 12(4), R41. [DOI] [PMC free article] [PubMed] [Google Scholar]
- Milioli HH, Tishchenko I, Riveros C, Berretta R, Moscato P, 2017. Basal-like breast cancer: molecular profiles, clinical features and survival outcomes. BMC Med Genomics 10(1), 19. [DOI] [PMC free article] [PubMed] [Google Scholar]
- Murray NR, Jamieson L, Yu W, Zhang J, Gokmen-Polar Y, Anastasiadis PZ, Gatalica Z, Thompson EA, Fields AP, 2004. Protein Kinase C iota is Required for Ras Transformation aand Colon Carcinogenesis in vivo. Journal of Cell Biology 164(6), 797–802. [DOI] [PMC free article] [PubMed] [Google Scholar]
- Murray NR, Kalari KR, Fields AP, 2011. Protein kinase Ciota expression and oncogenic signaling mechanisms in cancer. J Cell Physiol 226(4), 879–887. [DOI] [PMC free article] [PubMed] [Google Scholar]
- Murray NR, Weems J, Braun U, Leitges M, Fields AP, 2009. Protein kinase C betaII and PKCiota/lambda: collaborating partners in colon cancer promotion and progression. Cancer Res 69(2), 656–662. [DOI] [PMC free article] [PubMed] [Google Scholar]
- Nakanishi Y, Reina-Campos M, Nakanishi N, Llado V, Elmen L, Peterson S, Campos A, De SK, Leitges M, Ikeuchi H, Pellecchia M, Blumberg RS, Diaz-Meco MT, Moscat J, 2016. Control of Paneth Cell Fate, Intestinal Inflammation, and Tumorigenesis by PKClambda/iota. Cell Rep 16(12), 3297–3310. [DOI] [PMC free article] [PubMed] [Google Scholar]
- Ono Y, Fujii T, Ogita K, Kikkawa U, Igarashi K, Nishizuka Y, 1989. Protein kinase C zeta subspecies from rat brain: its structure, expression, and properties. Proc Natl Acad Sci U S A 86(9), 3099–3103. [DOI] [PMC free article] [PubMed] [Google Scholar]
- Parker PJ, Justilien V, Riou P, Linch M, Fields AP, 2014. Atypical Protein Kinase Ciota as a human oncogene and therapeutic target. Biochem Pharmacol 88(1), 1–11. [DOI] [PMC free article] [PubMed] [Google Scholar]
- Paul A, Gunewardena S, Stecklein SR, Saha B, Parelkar N, Danley M, Rajendran G, Home P, Ray S, Jokar I, Vielhauer GA, Jensen RA, Tawfik O, Paul S, 2014. PKClambda/iota signaling promotes triple-negative breast cancer growth and metastasis. Cell Death Differ 21(9), 1469–1481. [DOI] [PMC free article] [PubMed] [Google Scholar]
- Poli A, Mongiorgi S, Cocco L, Follo MY, 2014. Protein kinase C involvement in cell cycle modulation. Biochem Soc Trans 42(5), 1471–1476. [DOI] [PubMed] [Google Scholar]
- Qian J, Chen H, Ji X, Eisenberg R, Chakravarthy AB, Mayer IA, Massion PP, 2017. A 3q gene signature associated with triple negative breast cancer organ specific metastasis and response to neoadjuvant chemotherapy. Sci Rep 7, 45828. [DOI] [PMC free article] [PubMed] [Google Scholar]
- Qian J, Hassanein M, Hoeksema MD, Harris BK, Zou Y, Chen H, Lu P, Eisenberg R, Wang J, Espinosa A, Ji X, Harris FT, Rahman SM, Massion PP, 2015. The RNA binding protein FXR1 is a new driver in the 3q26–29 amplicon and predicts poor prognosis in human cancers. Proc Natl Acad Sci U S A 112(11), 3469–3474. [DOI] [PMC free article] [PubMed] [Google Scholar]
- Regala RP, Davis RK, Kunz A, Khoor A, Leitges M, Fields AP, 2009. Atypical protein kinase C{iota} is required for bronchioalveolar stem cell expansion and lung tumorigenesis. Cancer Res 69(19), 7603–7611. [DOI] [PMC free article] [PubMed] [Google Scholar]
- Regala RP, Weems C, Jamieson L, Copland JA, Thompson EA, Fields AP, 2005a. Atypical protein kinase Ciota plays a critical role in human lung cancer cell growth and tumorigenicity. J Biol Chem 280(35), 31109–31115. [DOI] [PubMed] [Google Scholar]
- Regala RP, Weems C, Jamieson L, Khoor A, Edell ES, Lohse CM, Fields AP, 2005b. Atypical protein kinase C iota is an oncogene in human non-small cell lung cancer. Cancer Res 65(19), 8905–8911. [DOI] [PubMed] [Google Scholar]
- Reina-Campos M, Diaz-Meco MT, Moscat J, 2019. The Dual Roles of the Atypical Protein Kinase Cs in Cancer. Cancer Cell 36(3), 218–235. [DOI] [PMC free article] [PubMed] [Google Scholar]
- Rodrigues M, Ait Rais K, Salviat F, Algret N, Simaga F, Barnhill R, Gardrat S, Servois V, Mariani P, Piperno-Neumann S, Roman-Roman S, Delattre O, Cassoux N, Savignoni A, Stern MH, Pierron G, 2020. Association of Partial Chromosome 3 Deletion in Uveal Melanomas With Metastasis-Free Survival. JAMA Ophthalmol 138(2), 182–188. [DOI] [PMC free article] [PubMed] [Google Scholar]
- Rosse C, Lodillinsky C, Fuhrmann L, Nourieh M, Monteiro P, Irondelle M, Lagoutte E, Vacher S, Waharte F, Paul-Gilloteaux P, Romao M, Sengmanivong L, Linch M, van Lint J, Raposo G, Vincent-Salomon A, Bieche I, Parker PJ, Chavrier P, 2014. Control of MT1-MMP transport by atypical PKC during breast-cancer progression. Proc Natl Acad Sci U S A 111(18), E1872–1879. [DOI] [PMC free article] [PubMed] [Google Scholar]
- Sarkar S, Bristow CA, Dey P, Rai K, Perets R, Ramirez-Cardenas A, Malasi S, Huang-Hobbs E, Haemmerle M, Wu SY, McGuire M, Protopopov A, Jiang S, Liu JF, Hirsch MS, Chang Q, Lazar AJ, Sood AK, Drapkin R, DePinho R, Draetta G, Chin L, 2017. PRKCI promotes immune suppression in ovarian cancer. Genes Dev 31(11), 1109–1121. [DOI] [PMC free article] [PubMed] [Google Scholar]
- Scotti ML, Bamlet WR, Smyrk TC, Fields AP, Murray NR, 2010. Protein kinase Ciota is required for pancreatic cancer cell transformed growth and tumorigenesis. Cancer Res 70(5), 2064–2074. [DOI] [PMC free article] [PubMed] [Google Scholar]
- Selbie LA, Schmitz-Peiffer C, Sheng Y, Biden TJ, 1993. Molecular cloning and characterization of PKC iota, an atypical isoform of protein kinase C derived from insulin-secreting cells. J Biol Chem 268(32), 24296–24302. [PubMed] [Google Scholar]
- Siegel RL, Miller KD, Jemal A, 2019. Cancer statistics, 2019. CA Cancer J Clin 69(1), 7–34. [DOI] [PubMed] [Google Scholar]
- Soloff RS, Katayama C, Lin MY, Feramisco JR, Hedrick SM, 2004. Targeted deletion of protein kinase C lambda reveals a distribution of functions between the two atypical protein kinase C isoforms. J Immunol 173(5), 3250–3260. [DOI] [PubMed] [Google Scholar]
- Tanos B, Rodriguez-Boulan E, 2008. The epithelial polarity program: machineries involved and their hijacking by cancer. Oncogene 27(55), 6939–6957. [DOI] [PubMed] [Google Scholar]
- Torre LA, Trabert B, DeSantis CE, Miller KD, Samimi G, Runowicz CD, Gaudet MM, Jemal A, Siegel RL, 2018. Ovarian cancer statistics, 2018. CA Cancer J Clin 68(4), 284–296. [DOI] [PMC free article] [PubMed] [Google Scholar]
- Vorhagen S, Niessen CM, 2014. Mammalian aPKC/Par polarity complex mediated regulation of epithelial division orientation and cell fate. Exp Cell Res 328(2), 296–302. [DOI] [PubMed] [Google Scholar]
- Wang J, Qian J, Hoeksema MD, Zou Y, Espinosa AV, Rahman SM, Zhang B, Massion PP, 2013. Integrative genomics analysis identifies candidate drivers at 3q26–29 amplicon in squamous cell carcinoma of the lung. Clin Cancer Res 19(20), 5580–5590. [DOI] [PMC free article] [PubMed] [Google Scholar]
- Wang Y, Hill KS, Fields AP, 2013. PKCiota maintains a tumor-initiating cell phenotype that is required for ovarian tumorigenesis. Mol Cancer Res 11(12), 1624–1635. [DOI] [PMC free article] [PubMed] [Google Scholar]
- Wang Y, Justilien V, Brennan KI, Jamieson L, Murray NR, Fields AP, 2017. PKCiota regulates nuclear YAP1 localization and ovarian cancer tumorigenesis. Oncogene 36(4), 534–545. [DOI] [PMC free article] [PubMed] [Google Scholar]
- Weichert W, Gekeler V, Denkert C, Dietel M, Hauptmann S, 2003. Protein kinase C isoform expression in ovarian carcinoma correlates with indicators of poor prognosis. Int J Oncol 23(3), 633–639. [PubMed] [Google Scholar]
- Yang YL, Chu JY, Luo ML, Wu YP, Zhang Y, Feng YB, Shi ZZ, Xu X, Han YL, Cai Y, Dong JT, Zhan QM, Wu M, Wang MR, 2008. Amplification of PRKCI, located in 3q26, is associated with lymph node metastasis in esophageal squamous cell carcinoma. Genes Chromosomes Cancer 47(2), 127–136. [DOI] [PubMed] [Google Scholar]
- Yin N, Liu Y, Khoor A, Wang X, Thompson EA, Leitges M, Justilien V, Weems C, Murray NR, Fields AP, 2019. Protein Kinase Ciota and Wnt/beta-Catenin Signaling: Alternative Pathways to Kras/Trp53-Driven Lung Adenocarcinoma. Cancer Cell 36(2), 156–167 e157. [DOI] [PMC free article] [PubMed] [Google Scholar]
- Yin N, Liu Y, Murray NR, Fields AP, 2020. Oncogenic protein kinase Ciota signaling mechanisms in lung cancer: Implications for improved therapeutic strategies. Adv Biol Regul 75, 100656. [DOI] [PubMed] [Google Scholar]
- Zhang L, Huang J, Yang N, Liang S, Barchetti A, Giannakakis A, Cadungog MG, O’Brien-Jenkins A, Massobrio M, Roby KF, Katsaros D, Gimotty P, Butzow R, Weber BL, Coukos G, 2006. Integrative genomic analysis of protein kinase C (PKC) family identifies PKCiota as a biomarker and potential oncogene in ovarian carcinoma. Cancer Res 66(9), 4627–4635. [DOI] [PubMed] [Google Scholar]
Associated Data
This section collects any data citations, data availability statements, or supplementary materials included in this article.