

Abstract
BACKGROUND
Although the current obesity epidemic has been well-documented in children and adults, less is known about long-term risks for adult obesity for a given child at his or her present age and weight. We developed a simulation model to estimate the risk of adult obesity at age 35 for the current population of children in the United States.
METHODS
We pooled height and weight data from five nationally-representative longitudinal studies totaling 176,720 observations from 41,567 children and adults. We simulated growth trajectories across the life course and adjusted for secular trends. We created 1000 virtual populations of 1 million children ages 0–19, representative of the 2016 United States population, and projected their height-weight trajectories to age 35.
RESULTS
Assuming current trends, the majority (57.3% [95% UI 55.2–60.0%]) of today’s children will be obese at age 35, and roughly half of that cumulative incidence will occur during childhood. Our simulations indicate that the relative risk of adult obesity increases with age and BMI category, from 1.17 (95% uncertainty interval (UI) 1.09–1.29) for overweight 2-year-olds to 3.10 (95% UI 2.43–3.65) for 19-year-olds with severe obesity. For children with severe obesity, the chance they would no longer be obese at age 35 fell from 21.0% (95% UI 7.3%−47.3%) at age 2 to 6.1% (95% UI 2.1%−9.9%) at age 19.
CONCLUSIONS
Based on our models, childhood obesity and overweight continue to be a major health problem in the United States. Early development of obesity predicts future obesity, especially for children with severe obesity.
Obesity prevalence in the United States has declined recently among children aged 2–5 years, and stabilized among those 6–11 years of age, but continues to rise among adolescents and adults.1,2 Although the obesity epidemic has been well-characterized at a population-level, less is known about the individual-level risk of adult obesity for a given child’s current weight and age. Cohort studies indicate that excess weight during childhood is a predictor of future obesity,3–13 with high correlations with BMI (kg/m2) over time.14–16
While a number of epidemiologic cohort studies provide insight into growth trajectories, they often do not follow children into adulthood. For example, the sample-weighted average follow-up period among sixteen international cohorts was 12 years,3–13,15–18 and was only 7 years among US studies.3–10 While obesity has health effects in children,19–22 obesity-related morbidity and mortality generally affect adults (e.g. ages 35 years and older).23,24 Longitudinal data linking BMI trajectories to health risks in adulthood are needed to characterize the long-term consequences of childhood obesity more precisely.25–27
Although a few studies do follow children into mid-adulthood, such studies are necessarily based on cohorts that were initiated decades ago.5,16,18 Given the changes in obesity prevalence and environmental influences,28,29 it is not clear how applicable the results are for today’s children. For example, a comparison of two British cohorts born 12 years apart found significant differences in BMI trajectories,18 raising questions about using past cohort studies to predict risks for today’s youth. While previous studies have used statistical methods to forecast population-level obesity prevalence in the United States,30–34 they did not incorporate individual-level longitudinal data.
To address such concerns, we developed a method to simulate individual-level height and weight trajectories over the life course while accounting for secular trends. For the present analysis, we simulated such trajectories from childhood to age 35, at which point the health risks of obesity are well-established, in order to analyze how children’s current weight impacts their risk of adult obesity.
METHODS
DATA SOURCES
We pooled five nationally-representative United States data sets containing repeated measures of individual-level height and weight-- the National Longitudinal Survey of Youth (NLSY), National Longitudinal Study of Adolescent to Adult Health (Add Health), Early Childhood Longitudinal Study-Kindergarten (ECLS-K), Panel Survey on Income Dynamics (PSID), and NHANES I Epidemiologic Follow-up Study (NHEFS). After removing participants who had fewer than two recorded observations, the pooled dataset contained 41,567 participants comprising 176,720 observations-- a mean of 4.3 observations per person (SD 1.6). Participants with two or more observations were on average younger, and more likely to be female and white. See Data Sources in the Supplementary Appendix, Section 1.1 for details and exclusion criteria.
TRAJECTORY SIMULATION
Using these data, we developed a simulation model to predict growth trajectories based on individual-level weight and height information (Supplementary Appendix, Section 1.2). Childhood trajectories were interpolated based on CDC growth curves (Supplementary Appendix, Section 1.3), and we adjusted for secular trends in weight using NHANES data from 1976–2014 (Supplementary Appendix, Section 2). Parameters used to adjust for these trends were obtained via a model-fitting procedure that aligned trends in our simulated BMI categories with recent observed trends, using data from the Census, American Community Survey (ACS), Behavioral Risk Factor Surveillance System (BRFSS), National Survey of Children’s Health (NSCH), and NHANES (Supplementary Appendix, Section 3). We estimated trends for 4 BMI categories-- under/normal weight, overweight, moderate obesity, and severe obesity. Once these steps were complete, we then used this simulation model to predict the risk of obesity.
OBESITY PREDICTION AND VALIDATION
To predict the risk of obesity at age 35 years, we created virtual populations of 1 million children 0–19 years of age using statistical matching techniques previously described to create nationally-representative, open populations beginning in 2016.35,36 We estimated the conditional probability of obesity at age 35 based on BMI status at each age in childhood, and calculated the associated relative risks. We also calculated the risks of future obesity at 5-year intervals for each age-sex-BMI group. We repeated this process with 1,000 independently generated populations, each time randomly sampling a set of good-fitting secular trend parameters.
This approach allowed us to incorporate the individual-level (first order) uncertainty that arises from the simulation of trajectories, and also to incorporate uncertainty about the parameters (second order) we used to adjust for secular trends.37 Because the effect of first order uncertainty on aggregate estimates decreases as sample size increases, most of the uncertainty in our estimates reflects the second order issues just described. We report the mean and the 95% uncertainty intervals (i.e., the 2.5 and 97.5 percentiles). We also did a sensitivity analysis for secular trends by performing 100 iterations of the model, assuming there were actually no secular trends. By not incorporating uncertainty about the various parameters in our sensitivity analysis we were also able to estimate the relative contribution of individual-level uncertainty to our prediction intervals.
To evaluate the convergent validity (the extent to which different models that address the same problem calculate similar results) of our approach,38 we compared the simulated prevalence of obesity at age 35 to logistic regression predictions based on NHANES 1999–2014 for ages 34–36.
We also performed extensive cross-validation analyses in which we predicted values for participants in our dataset.39 We removed the data of each participant from our source trajectories and then predicted their height and weight at future ages for which they had actual observations. Since each person could not contribute any data to his or her own prediction, this allowed us to evaluate the accuracy of our algorithm by comparing our predictions to the observed data. We conducted cross-validation analyses for persons whose last age was between 34–36 years of age and calculated the coverage probability of our estimates – that is, we calculated the probability that the actual values for this cohort fell within our predicted uncertainty intervals. In addition we ran prospective cross-validation analyses for younger cohorts starting from ages 2 to 29 and calculated the number of times our predictions fell within the bootstrapped 95% confidence intervals (Supplementary Appendix, Section 4).
Our model was coded in Java as part of the Childhood Obesity Intervention Cost-Effectiveness Study (CHOICES).40,41 Statistical analyses were performed in R. BMI categories were calculated following CDC standards, with severe obesity defined as BMI ≥ 35 for adults,42 and greater than or equal to 120% of the 95th percentile for children.43 Data and R code are available from the authors upon request.
RESULTS
Our simulated projections of BMI categories from 2010 to 2030 corresponded well to trends observed in NHANES and captured differences by age, sex, and race-ethnicity (Fig.1; Supplementary Appendix, Section 3.4 which contains projections by subgroups). Our simulated trajectories also yielded correlations of BMI from childhood to age 35 similar to those in previous studies, ranging from around 0.2 at age 2, rising to 0.5 by age 10 and >0.6 by age 15. Five-year and ten-year BMI correlations ranged from around 0.4 at age 2 to >0.8 by age 15 (Supplementary Appendix, Section 3.5). Our cross-validation analyses yielded coverage estimates of 100% for predicted obesity prevalence and mean BMI at ages 34–36, and 94% of our obesity predictions for younger ages fell within the 95% confidence intervals of the actual values (Supplementary Appendix, Section 4).
Figure 1: Predicted Prevalence of BMI Categories to 2030 for Children (A) and Adults (B).
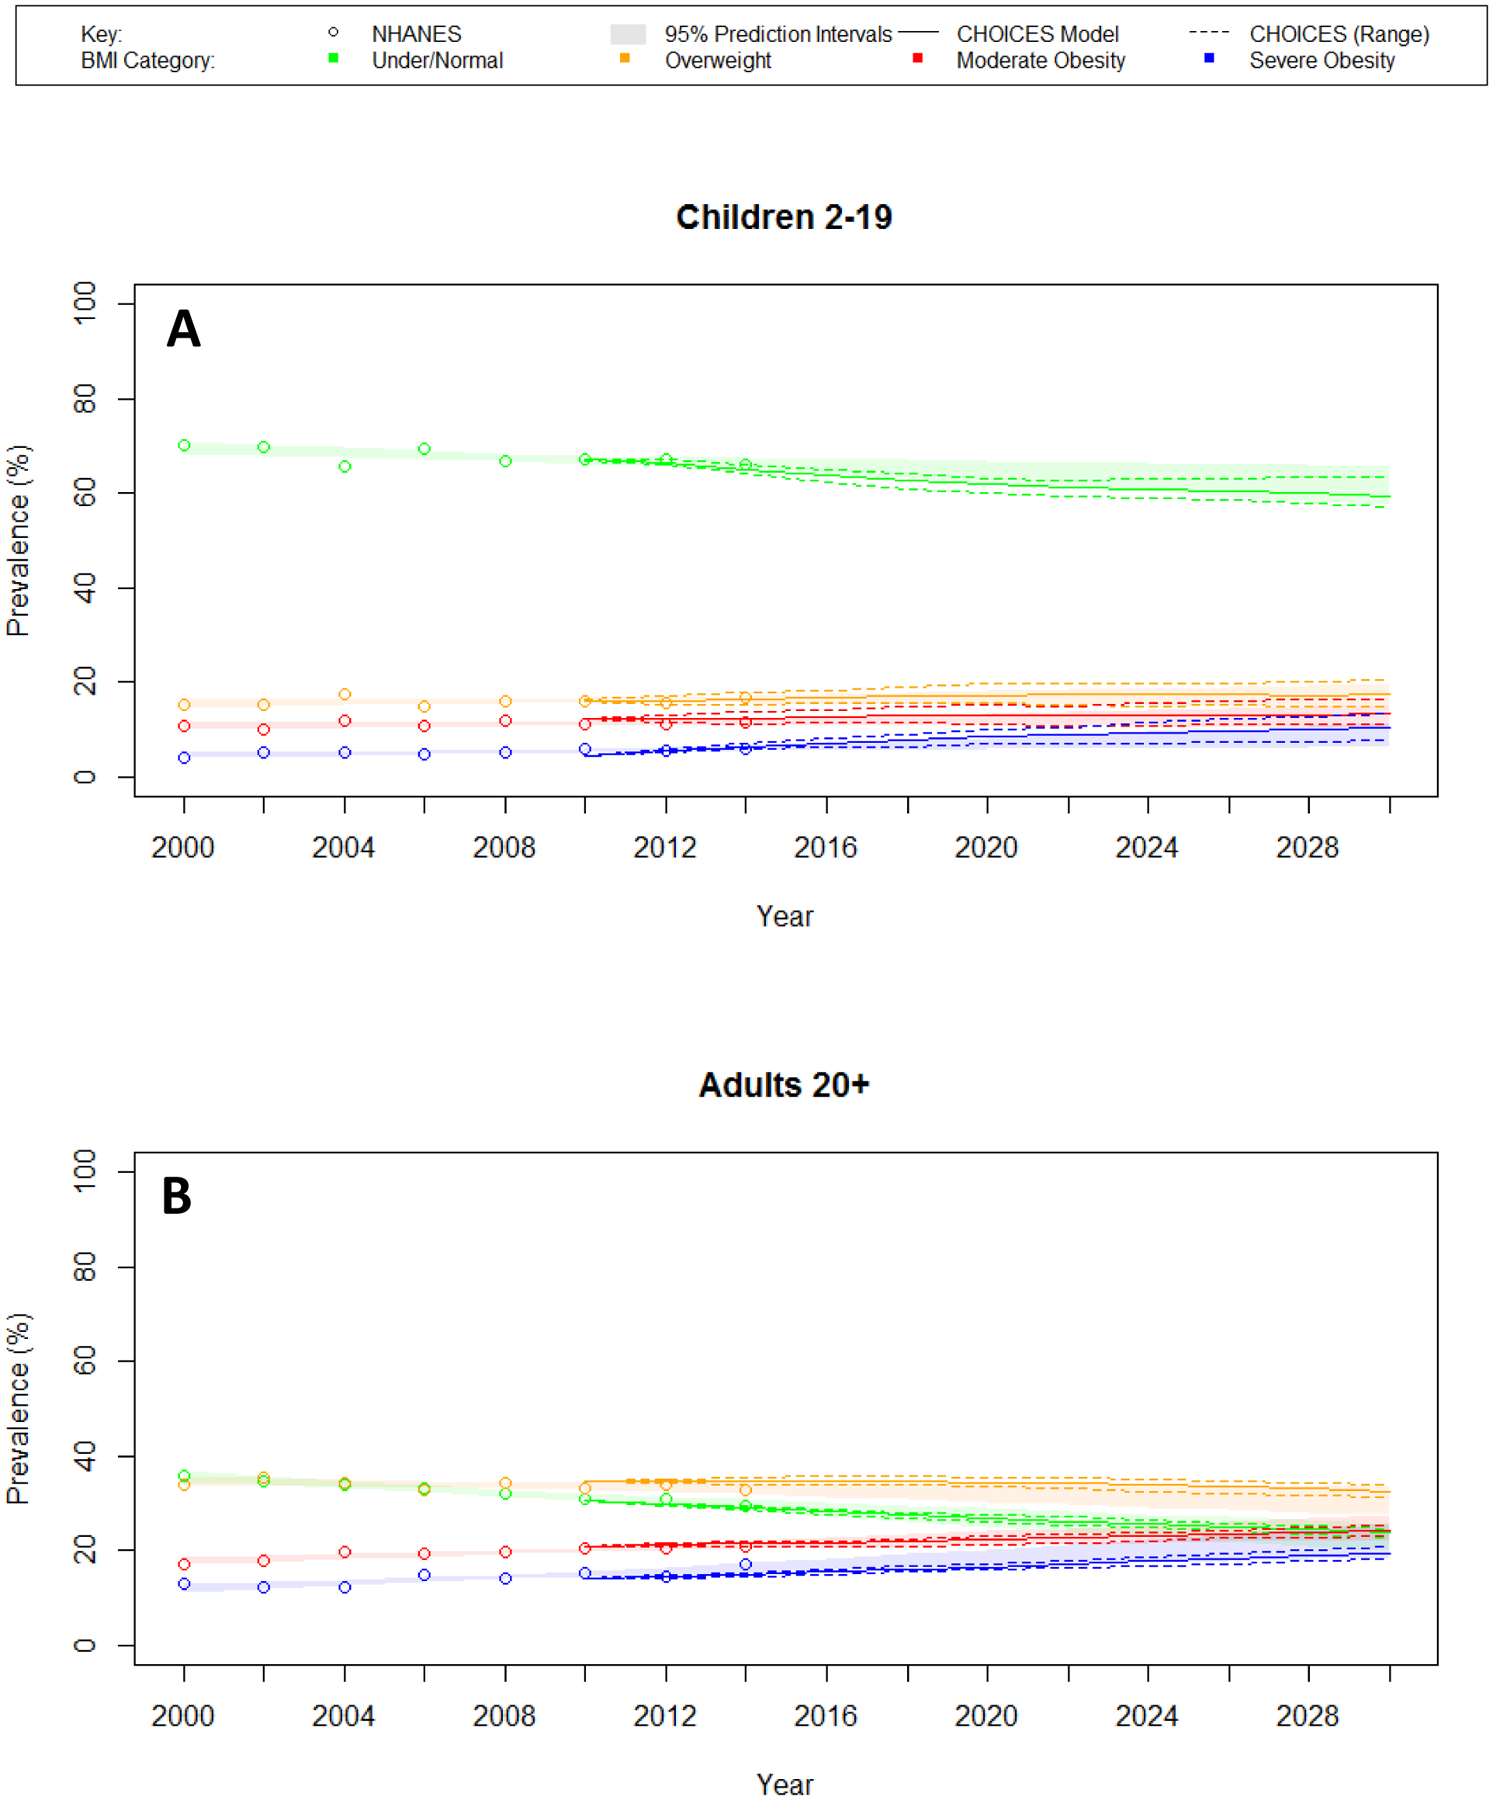
The predicted prevalence of BMI categories from the CHOICES model compared with logistic regression predictions based on NHANES 1999–2014. Severe obesity: BMI ≥ 120% of 95th percentile (ages 2–17), BMI ≥ 35 (ages 18+)
Our projections for children ages 2–19 reveal that, assuming current trends in BMI and obesity, the majority of today’s youth (57.3% [95% UI 55.2–60.0%]) will be obese at age 35 (Fig. 2A, see Supplementary Appendix, Section 5.1 for obesity predictions by subgroups). For a cohort of current 2-year-olds (Fig. 2B; see Supplementary Appendix, Section 5.2 for predictions by subgroups), we found that the cumulative incidence of obesity increases until adolescence, at which point it stabilizes, with about half of the cumulative incidence reached by this point. The prevalence then continues to increase after adolescence. Similar patterns were observed by race-ethnicity, but with significant disparities in obesity prevalence already present by age 2 (Fig. 3).
Figure 2: Predicted Obesity at Age 35: Prevalence by Year and Cumulative Incidence.
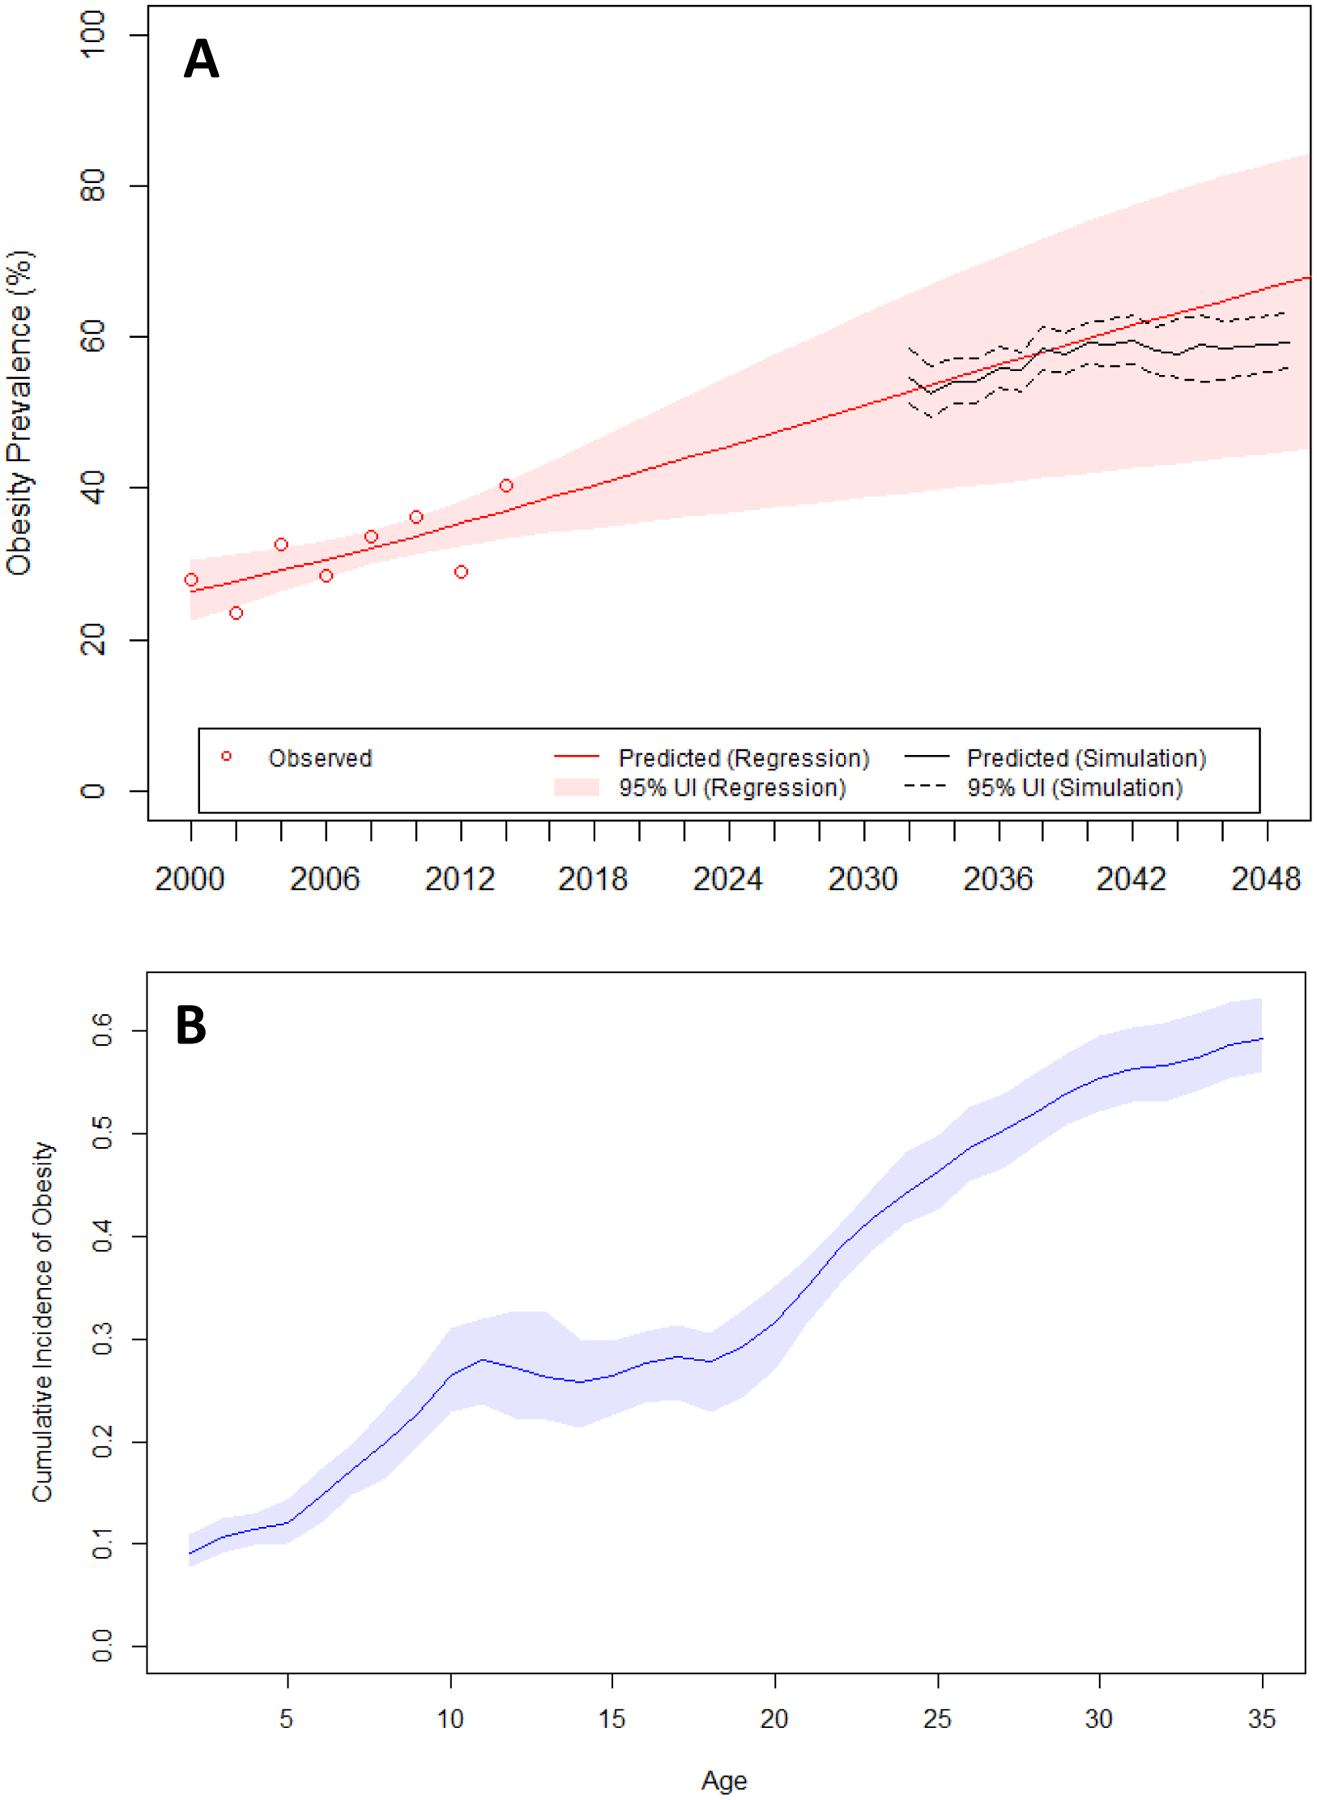
A. The predicted prevalence of obesity at age 35 from the simulation model compared to logistic regression predictions from NHANES 1999–2014 for ages 34–36. B. The projected cumulative incidence of obesity for 2-year-olds in 2016.
Figure 3: Cumulative Incidence of Obesity by Race/Ethnicity.
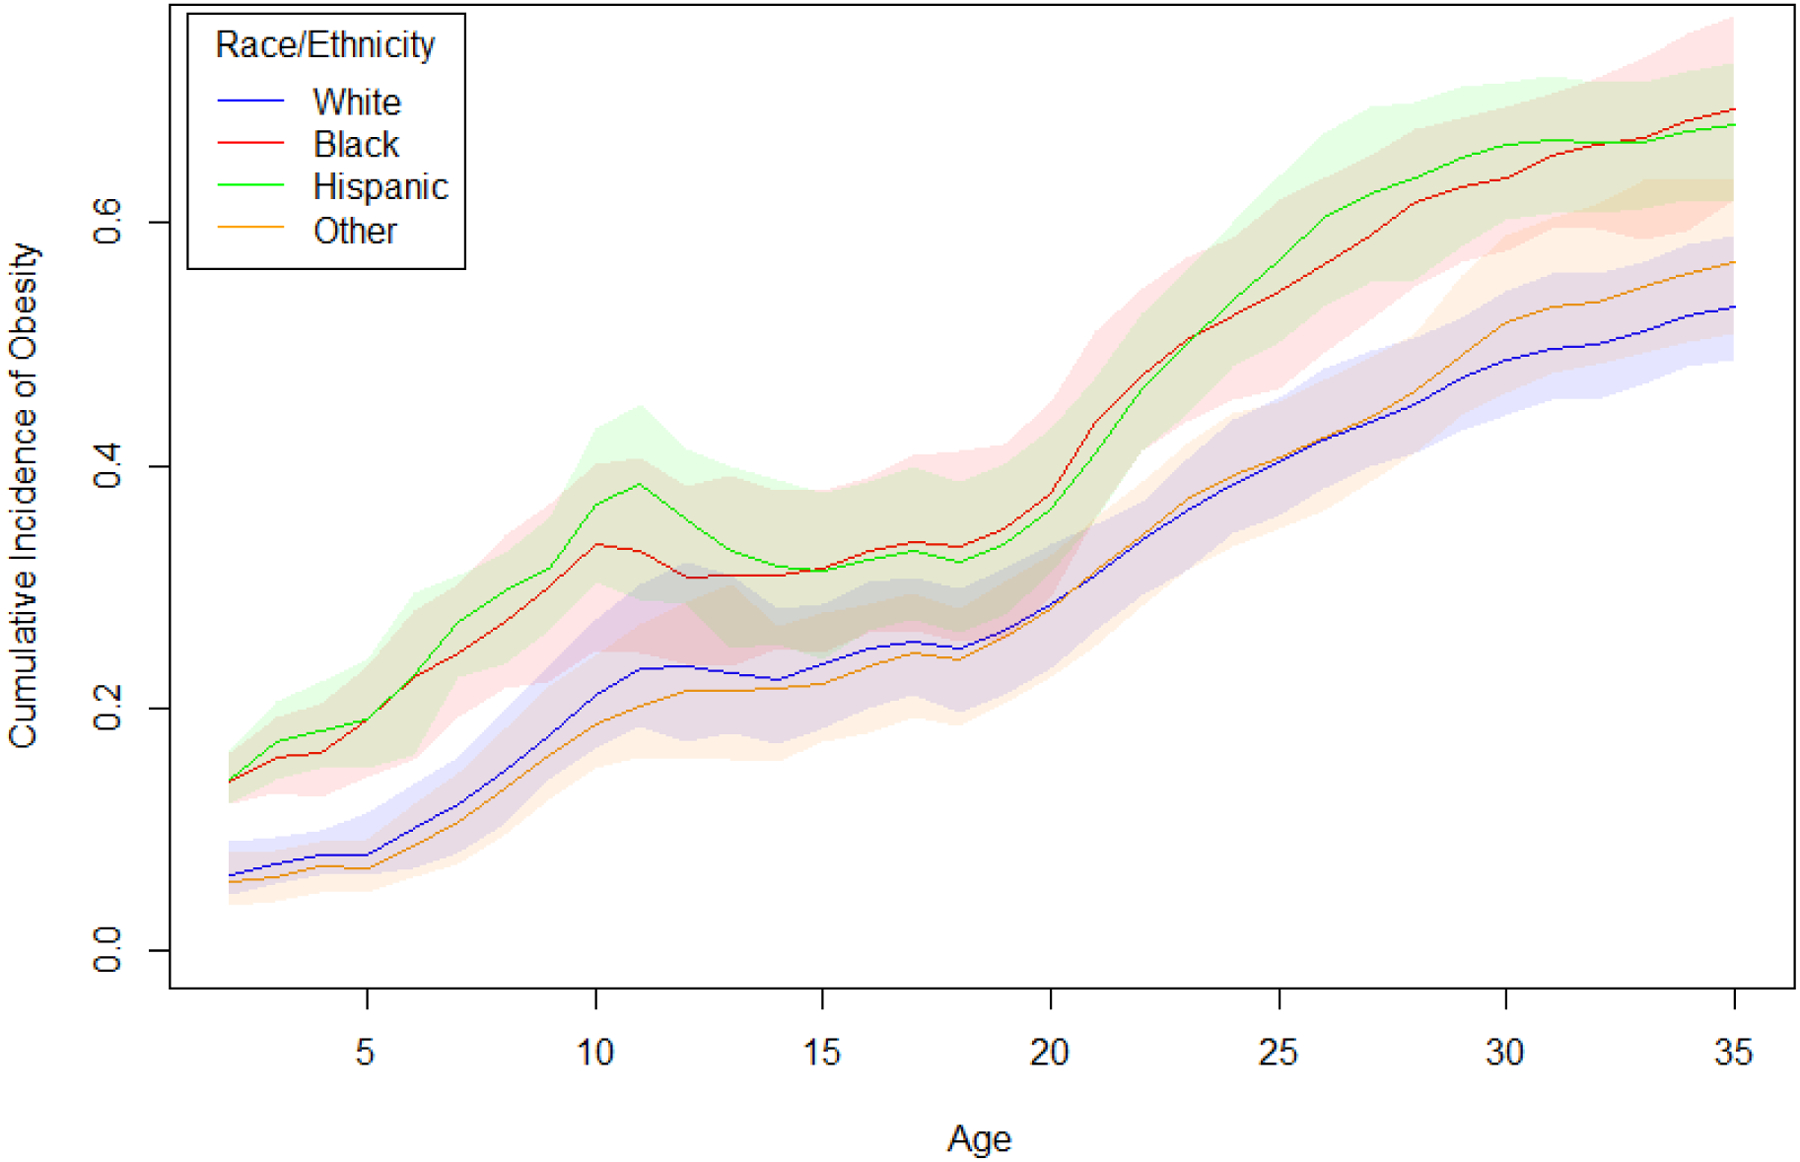
Shaded areas represent 95% uncertainty intervals. This plot shows the projected cumulative incidence of obesity for 2-year-olds in 2016 by race-ethnicity, and indicates that significant disparities are already established at very young ages.
Among children with obesity, we found that the probability of still having obesity at age 35 increases with age, from 74.9% (95% UI 67.3%−81.5%) at age 2 to 88.2% (95% UI 84.6%−92.3%) at age 19 years (Fig. 4A). For children without obesity, the probability of obesity at age 35 decreases with age, from 57.8% (95% UI 54.5%−62.1%) at age 2 to 44.4% (95% UI 40.4%−49.7%) at age 19. The relative risks of adult obesity for children with obesity compared to normal/underweight children increased with age, from 1.30 (95% UI 1.17–1.45) at age 2 to 1.99 (95% UI 1.80–2.17) at age 19 (Supplementary Appendix, Section 5.3). We found a consistent risk gradient by BMI category at all ages (Fig. 4B); the relative risks ranged from 1.17 (95% UI 1.09–1.29) for overweight children at age 2 to 3.10 (95% UI 2.43–3.65) for 19-year-olds with severe obesity (Supplementary Appendix, Section 5.3).
Figure 4: Predicted Probability of Obesity at Age 35 by Current Age and BMI Category.
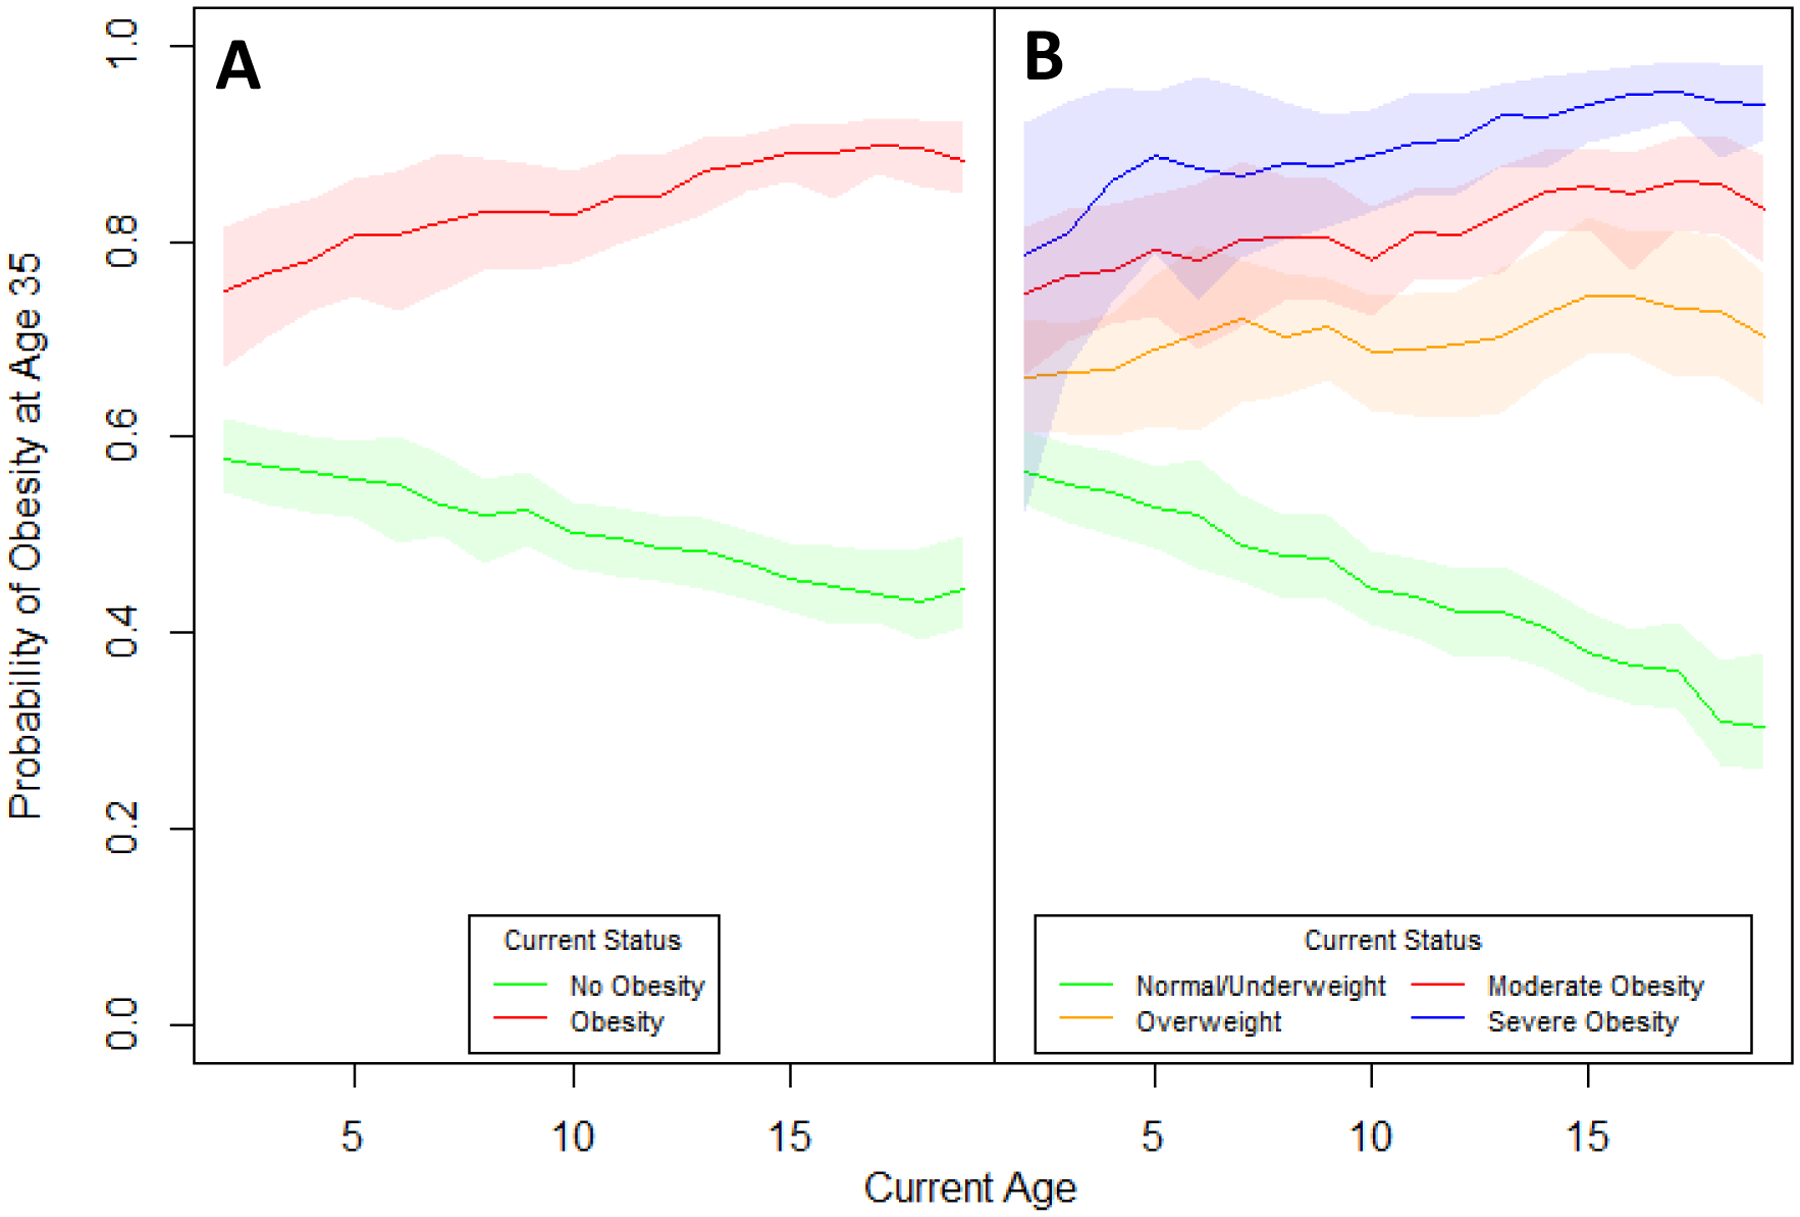
Shaded areas represent 95% uncertainty intervals. Panel A shows the probability of obesity at age 35 conditional on childhood obesity status. Panel B shows the probability of obesity at age 35 conditional on childhood BMI category.
While these projections indicate that children with obesity are likely to be obese as adults, we also found that the majority of 35-year-olds with obesity were not obese as children (Supplementary Appendix, Section 5.4). As an indicator for adult obesity, childhood obesity has high specificity (93.1%) but low sensitivity (29.3%) on average (Supplementary Appendix, Section 5.5). However, the high prevalence of obesity in the population results in a higher positive predictive value (85.1%) and lower negative predictive value (49.5%).
Children with severe obesity are at especially high risk for adult obesity – their chances of not being obese at age 35 go from 21.0% (95% UI 7.3%−47.3%) at age 2 to 6.1% (95% UI 2.1%−9.9%) at age 19 (Supplementary Appendix, Section 5.6). For boys, the chance drops to 3.5% (95% UI 0.9%−8.5%) at age 19 years and to 8.2% (95% UI 2.4%−14.5%) in girls. Obesity risk tables at 5-year intervals are provided for each age, sex, and BMI group in the Supplementary Appendix, Section 6.
SENSITIVITY ANALYSIS
When we assumed no secular trends in weight gain, the predicted prevalence of obesity at age 35 for today’s children was slightly lower-- 48.91% (95% UI 48.79–49.06%), with age-related trends and BMI risk gradients similar to our main results. See the Supplementary Appendix, Section 7 for details.
DISCUSSION
Although a broad range of public health and clinical efforts appear to have stabilized early childhood obesity rates,1 our present study estimates that for youth who were ages 2–19 years in 2016, over half will be obese by age 35. However, the majority of these youth are not currently obese; about half of the total cumulative incidence of obesity begins in childhood, and adult-onset obesity by age 35 accounts for the rest.
Given their increased risk of adult obesity, it seems clear that children who are obese should be targeted for intervention. Children with severe obesity, a condition that now affects 4.5 million (6%) children in the United States,1 are at particularly high risk. At age 2, children with severe obesity have only a 1 in 5 chance of not having obesity at age 35; by age 5 that chance is halved-- 1 in 10. The persistence of elevated risk is striking-- a 2-year-old child with obesity is more likely to be obese at age 35 years than an overweight 19-year-old. Our present findings thus highlight the importance of promoting a healthy weight throughout childhood and adulthood. A narrow focus on solely preventing childhood obesity will not avert potential future health damage that may be induced by the ongoing obesity epidemic.27 In our sensitivity analyses, even assuming no continuing secular trends in weight gain, we predicted that almost half of today’s youth will be obese by age 35. There is evidence that cost-effective approaches with broad population reach could have substantial impacts for the present generation of youth.40,41
A strength of the present study is that we utilized a rigorous approach to simulate demographic and public health surveillance data together with nationally-representative growth trajectories over the life course while simultaneously adjusting for secular trends. Our approach provides estimates not possible with simpler methods, generating projections of population-level obesity consistent with current trends while maintaining individual-level heterogeneity in growth. Our cross-validation analyses demonstrated that our algorithm is able to predict obesity prevalence at various ages with a high degree of accuracy.
While our approach may facilitate more accurate predictions of future obesity risk for a given child as compared to prior studies, our results generally yielded insights consistent with previous studies, such as the persistence of childhood obesity over time,3,5–7,9 especially for children with severe obesity.44 Our simulated trajectories also yielded age-related BMI correlations and test characteristics (sensitivity and specificity) similar to previous studies.3,11,14–16,26 However, our calculated relative risks of obesity are smaller compared to past studies, since we accounted for secular trends of increasing obesity risk in the reference group of currently normal/underweight children. We also found significant racial-ethnic disparities in obesity prevalence already present by age 2, an insight consistent with previous findings.45
Our study has certain limitations, however. The main assumption and potential limitation underlying our method of predicting growth patterns is that on average, persons with similar trajectories in height and weight for a given period of their lives will also grow similarly in future periods. The assumption that secular trends will continue, and the assumptions underlying our estimation of these trends, may also have influenced our results. However, in our analyses, the age-related trends in relative risk were robust to sensitivity analyses in which no secular trends were applied.
Our reference group also included children who are underweight, which is known to be problematic when estimating risks of mortality or morbidity due to confounding associated with low weight.24 However, we speculate that it is unlikely that the inclusion of underweight participants in our study presents similar issues for comparisons of future obesity risks, though it may underestimate the risks for our combined group of under/normal weight children. Lastly, because overweight and obesity are defined by the CDC starting only at age 2, we could not examine the impact of excess weight in infancy on adult obesity.
In conclusion, our present study estimates that only those children with a healthy weight have less than a 50% chance of developing obesity by age 35 years. For children with severe obesity, the risk of adult obesity is particularly high.
Supplementary Material
Acknowledgments
This work was supported in part by grants from The JPB Foundation, the Robert Wood Johnson Foundation (Grant No. 66284), the Donald and Sue Pritzker Nutrition and Fitness Initiative, and the Centers for Disease Control and Prevention (Grant No. U48/DP00064-00S1), including the Nutrition and Obesity Policy Research and Evaluation Network. This work is solely the responsibility of the authors and does not represent the official views of the Centers for Disease Control and Prevention or any of the other funders.
References
- 1.Ogden CL, Carroll MD, Lawman HG, et al. Trends in obesity prevalence among children and adolescents in the United States, 1988–1994 through 2013–2014. JAMA 2016;315(21):2292–9. [DOI] [PMC free article] [PubMed] [Google Scholar]
- 2.Flegal KM, Kruszon-Moran D, Carroll MD, Fryar CD, Ogden CL. Trends in obesity among adults in the United States, 2005 to 2014. JAMA 2016;315(21):2284–2291. [DOI] [PMC free article] [PubMed] [Google Scholar]
- 3.Cunningham SA, Kramer MR, Venkat Narayan KM. Incidence of childhood obesity in the United States. N Engl J Med 2014;370:403–11. [DOI] [PMC free article] [PubMed] [Google Scholar]
- 4.Gordon-Larsen P, Adair LS, Nelson MC, Popkin BM. Five-year obesity incidence in the transition period between adolescence and adulthood: the National Longitudinal Study of Adolescent Health. Am J Clin Nutr 2004;80(3): 569–75. [DOI] [PubMed] [Google Scholar]
- 5.Janssen I, Katzmarzyk PT, Srinivasan SR, et al. Utility of childhood BMI in the prediction of adulthood disease: comparison of national and international references. Obes Res 2005;13:1106–15. [DOI] [PubMed] [Google Scholar]
- 6.Nader PR, O’Brien M, Houts R, et al. Identifying risk for obesity in early childhood. Pediatrics 2006;188(3):e594–601. [DOI] [PubMed] [Google Scholar]
- 7.Stovitz SD, Hannan PJ, Lytle LA, Demerath EW, Pereira MA, Himes JH. Child height and the risk of young-adult obesity. Am J Prev Med 2010;38(1):74–7. [DOI] [PMC free article] [PubMed] [Google Scholar]
- 8.Thompson DR, Obarzanek E, Franko DL et al. Childhood overweight and cardiovascular disease risk factors: the National Heart, Lung, and Blood Institute Growth and Health Study. J Pediatr 2007;150(1):18–25. [DOI] [PMC free article] [PubMed] [Google Scholar]
- 9.Tran MK, Krueger PM, McCormick E, Davidson A, Main DS. Body mass transitions through childhood and early adolescence: a multistate life table approach. Am J Epidemiol 2016;183(7):643–649. [DOI] [PMC free article] [PubMed] [Google Scholar]
- 10.Wang LY, Chyen D, Lee S, Lowry R. The association between body mass index in adolescence and obesity in adulthood. J Adolesc Health 2008;42(5):512–8. [DOI] [PubMed] [Google Scholar]
- 11.Evensen E, Wilsgaard T, Furberg AS, Skeie G. Tracking of overweight and obesity from early childhood to adolescence in a population-based cohort – the Tromsø Study, Fit Futures. BMC Pediatrics 2016;16:64. [DOI] [PMC free article] [PubMed] [Google Scholar]
- 12.Kim KR, Kim MK, Shin YJ, Choi BY. Relationship between the change in overweight status from childhood to adolescence and metabolic syndrome phenotypes: a 9-year retrospective study. Eur J Clin Nutr 2008;62(6):748–53. [DOI] [PubMed] [Google Scholar]
- 13.Venn AJ, Thomson RJ, Schmidt MD, et al. Overweight and obesity from childhood to adulthood: a follow-up of participants in the 1985 Australian Schools Health and Fitness Survey. Med J Aust 2007;186:458–60. [DOI] [PubMed] [Google Scholar]
- 14.Deshmukh-Taskar P, Nicklas TA, Morales M, Yang SJ, Zakeri I, Berenson GS. Tracking of overweight status from childhood to young adulthood: the Bogalusa Heart Study. Eur J Clin Nutr 2006;60(1):48–57. [DOI] [PubMed] [Google Scholar]
- 15.Magarey AM, Daniels LA, Boulton TJ, Cockington RA. Predicting obesity in early adulthood from childhood and parental obesity. Int J Obes Relat Metab Disord 2003;27:505–13. [DOI] [PubMed] [Google Scholar]
- 16.Juhola J, Magnussen CG, Viikari JSA, et al. Tracking of serum lipid levels, blood pressure, and body mass index from childhood to adulthood: the cardiovascular risk in Young Finns Study. J Pediatr 2011;159:584–90. [DOI] [PubMed] [Google Scholar]
- 17.Ekelund U, Ong K, Linné Y, et al. Upward weight percentile crossing in infancy and early childhood independently predicts fat mass in young adults: the Stockholm Weight Development Study (SWEDES). Am J Clin Nutr 2006;83(2):324–30. [DOI] [PubMed] [Google Scholar]
- 18.Li L, Hardy R, Kuh D, Lo Conte R, Power C. Child-to-adult body mass index and height trajectories: a comparison of 2 British birth cohorts. Am J Epidemiol 2008;168(9):1008–15. [DOI] [PMC free article] [PubMed] [Google Scholar]
- 19.Dietz WH. Health consequences of obesity in youth: childhood predictors of adult disease. Pediatrics 1998;101:518–25. [PubMed] [Google Scholar]
- 20.Diagnosis Rao G., epidemiology, and management of hypertension in children. Pediatrics 2016;138(2). [DOI] [PubMed] [Google Scholar]
- 21.Temple JL, Cordero P, Li J, Nguyen V, Oben JA. A guide to non-alcoholic fatty liver disease in childhood and adolescence. Int J Mol Sci 2016;17(6). [DOI] [PMC free article] [PubMed] [Google Scholar]
- 22.Thompson N, Mansfield B, Stringer M, Stewart B, Potter J, Fernengel K. An evidence-based resource for the management of comorbidities associated with childhood overweight and obesity. J Am Assoc Nurse Pract 2016. doi: 10.1002/2327-6924.12369. [DOI] [PubMed] [Google Scholar]
- 23.GBD 2013 Risk Factors Collaborators, Forouzanfar MH, Alexander L, et al. Global, regional, and national comparative risk assessment of 79 behavioural, environmental and occupational, and metabolic risks or clusters of risks in 188 countries, 1990–2013: a systematic analysis for the Global Burden of Disease Study 2013. Lancet 2015;386(10010):2287–323. [DOI] [PMC free article] [PubMed] [Google Scholar]
- 24.Global BMI Mortality Collaboration. Body-mass index and all-cause mortality: individual-participant-data meta-analysis of 239 prospective studies in four continents. Lancet 2016;S0140–6736(16)30175–1. [DOI] [PMC free article] [PubMed] [Google Scholar]
- 25.Cheung PC, Cunningham SA, Naryan KM, Kramer MR. Childhood obesity incidence in the United States: a systematic review. Child Obes 2016;12(1):1–11. [DOI] [PMC free article] [PubMed] [Google Scholar]
- 26.Goldhaber-Fiebert JD, Rubinfeld RE, Bhattacharya J, Robinson TN, Wise PH. The utility of childhood and adolescent obesity assessment in relation to adult health. Med Decis Making 2013;33(2):163–75. [DOI] [PMC free article] [PubMed] [Google Scholar]
- 27.Trasande L How much should we invest in preventing childhood obesity? Health Aff (Millwood) 2010;29(3):372–8. [DOI] [PubMed] [Google Scholar]
- 28.Swinburn BA, Sacks G, Hall KD, et al. The global obesity pandemic: shaped by global drivers and local environments. Lancet. 2011;378(9793):804–14. [DOI] [PubMed] [Google Scholar]
- 29.Institute of Medicine. 2012. Accelerating Progress in Obesity Prevention: Solving the Weight of the Nation. Washington, DC: The National Academies Press. [DOI] [PMC free article] [PubMed] [Google Scholar]
- 30.Wang YC, Colditz GA, Kuntz KM. Forecasting the obesity epidemic in the aging U.S. population. Obesity (Silver Spring) 2007;15:2855–65. [DOI] [PubMed] [Google Scholar]
- 31.Wang Y, Beydoun MA, Liang L, Cabellero B, Kumanyika SK. Will All Americans become overweight or obese? Estimating the progression and cost of the US obesity epidemic. Obesity (Silver Spring) 2008;16(10):2323–30. [DOI] [PubMed] [Google Scholar]
- 32.Wang YC, McPherson K, Marsh T, Gortmaker SL, Brown M. Health and economic burden of the projected obesity trends in the USA and the UK. Lancet 2011;378(9793):815–25. [DOI] [PubMed] [Google Scholar]
- 33.Finkelstein EA, Khavjou OA, Thompson H, Trogdon JG, Pan L, Sherry B, Dietz W. Obesity and severe obesity forecasts through 2030. AM J Prev Med 2012;42(6):563–70. [DOI] [PubMed] [Google Scholar]
- 34.Wang YC, Orleans CT, Gortmaker SL. Reaching the healthy people goals for reducing childhood obesity: closing the energy gap. Am J Prev Med 2012;42(5):437–44. [DOI] [PubMed] [Google Scholar]
- 35.Ward ZJ, Long MW, Resch SC, et al. Redrawing the US obesity landscape: bias-corrected estimates of state-specific adult obesity prevalence. PLoS ONE 2016;11(3):e0150735. [DOI] [PMC free article] [PubMed] [Google Scholar]
- 36.Long MW, Ward ZJ, Resch SC, et al. State-level estimates of childhood obesity prevalence in the United States corrected for report bias. Int J Obes (Lond) 2016;40(10):1523–1528. [DOI] [PMC free article] [PubMed] [Google Scholar]
- 37.Briggs AH, Weinstein MC, Fenwick EA. Model parameter estimation and uncertainty analysis: a report of the ISPOR-SMDM Modeling Good Research Practices Task Force Working Group-6. Med Decis Making 2012;32(5):722–32. [DOI] [PubMed] [Google Scholar]
- 38.Eddy DM, Hollingworth W, Caro JJ, Tsevat J, McDonald KM, Wong JB. Model transparency and validation: a report of the ISPOR-SMDM Modeling Good Research Practices Task Force-7. Med Decis Making 2012;32(5):733–43. [DOI] [PubMed] [Google Scholar]
- 39.Efron B, Gong G. A Leisurely Look at the Bootstrap, the Jackknife, and Cross-Validation. Am Stat 1983;37(1):36–48. [Google Scholar]
- 40.Gortmaker SL, Wang YC, Long MW, et al. Three interventions that reduce childhood obesity are projected to save more than they cost to implement. Health Aff (Millwood) 2015;34(11):1932–9. [DOI] [PMC free article] [PubMed] [Google Scholar]
- 41.Cradock AL, Barrett JL, Kenney EL, et al. Using cost-effectiveness analysis to prioritize policy and programmatic approaches to physical activity promotion and obesity prevention in childhood. Prev Med 2016;S0091–7435(16)30339–5. [DOI] [PMC free article] [PubMed] [Google Scholar]
- 42.Wang YC, Pamplin J, Long MW, Ward ZJ, Gortmaker SL, Andreyeva T. Severe obesity in adults cost state Medicaid programs nearly $8 billion in 2013. Health Aff (Millwood) 2015;34(11):1923–1931. [DOI] [PubMed] [Google Scholar]
- 43.Wang YC, Gortmaker SL, Taveras EM. Trends and racial/ethnic disparities in severe obesity among US children and adolescents, 1976–2006. Int J Pediatr Obes 2011;6(1):12–20. [DOI] [PubMed] [Google Scholar]
- 44.Freedman DS, Mei Z, Srinivasan SR, Berenson GS, Dietz WH. Cardiovascular risk factors and excess adiposity among overweight children and adolescents: the Bogalusa Heart Study. J Pediatr 2007;150(1):12–17. [DOI] [PubMed] [Google Scholar]
- 45.Taveras EM, Gillman MW, Kleinman KP, Rich-Edwards JW, Rifas-Shiman SL. Reducing racial/ethnic disparities in childhood obesity: the role of early life risk factors. JAMA Pediatr 2013;167(8):731–8. [DOI] [PMC free article] [PubMed] [Google Scholar]
Associated Data
This section collects any data citations, data availability statements, or supplementary materials included in this article.