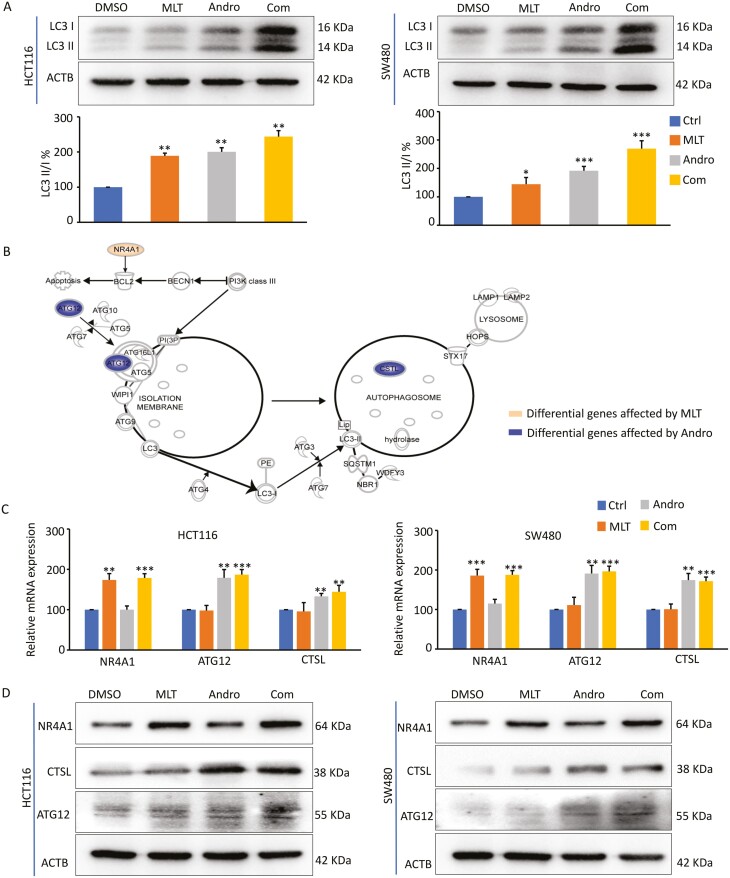
Figure 4.
Andro sensitizes MLT-induced anticancer effects by promoting autophagy in CRC cells. (A) Representative images of LC3B expression in the extracts of CRC cells in each treatment group by western blot analysis. The ratios of LC3-II to LC3-I based on the quantification of the bands in the immunoblot were shown in the lower panel. (B) Pattern diagram representing the significantly DEGs in the autophagy pathway after MLT and ANDRO treatment, respectively, by IPA analysis. (C) Bar graph showing relative mRNA expression of NR4A1, ATG12 and CTSL in each treatment group by qPCR analysis. (D) Representative images of NR4A1, ATG12 and CTSL expression in the extracts of CRC cells in each treatment group by western blot analysis. Statistical significance: ∗P < 0.05, ∗∗P < 0.01, ∗∗∗P < 0.001.

