

ABSTRACT
MLKL (mixed lineage kinase domain like pseudokinase) is a well-known core component of necrosome that executes necroptotic cell death upon phosphorylation by RIPK3 (receptor interacting serine/threonine kinase 3). Recent studies also implicate a role of MLKL in endosomal trafficking, which is not always dependent on RIPK3. Using mouse Neuro-2a and L929 as well as human HEK293 and HT29 cells, we show here that MLKL is phosphorylated in response to serum and amino acid deprivation from the culture medium, in a manner that depends on CAMK2/CaMKII (calcium/calmodulin dependent protein kinase II) but not RIPK3. The starvation-induced increase in MLKL phosphorylation was accompanied by decreases in levels of lipidated MAP1LC3B/LC3B (microtubule associated protein 1 light chain 3 beta; LC3-II) and SQSTM1/p62 (sequestosome 1), markers of autophagosomes. These changes were prevented by disrupting either MLKL or CAMK2 by pharmacology and genetic manipulations. Moreover, disrupting MLKL or CAMK2 also inhibited the incorporation of LC3-II into autolysosomes, demonstrating a role of the CAMK2-MLKL pathway in facilitating autophagic flux during short-term starvation, in contrast to necroptosis which suppressed autophagic flux. Furthermore, unlike the necroptotic pathway, the starvation-evoked CAMK2-mediated MLKL phosphorylation protected cells from starvation-induced death. We propose that upon nutrient deprivation, MLKL is activated by CAMK2, which in turn facilitates membrane scission needed for autophagosome maturation, allowing the proper fusion of the autophagosome with lysosome and the subsequent substance degradation. This novel function is independent of RIPK3 and is not involved in necroptosis, implicating new roles for this pseudokinase in cell survival, signaling and metabolism.
Abbreviations: CAMK2/CaMKII: calcium/calmodulin dependent protein kinase II; DIABLO/SMAC: direct inhibitor of apoptosis-binding protein with low pI/second mitochondria-derived activator of caspase; ECS: extracellular solution; ESCRT: endosomal sorting complexes required for transport; FBS: fetal bovine serum; GSK3B: glycogen synthase kinase 3 beta; HBSS: Hanks’ balanced salt solution; KO: knockout; LC3-II: lipidated microtubule associated protein 1 light chain 3 beta; LDH: lactate dehydrogenase; MLKL: mixed lineage kinase domain like pseudokinase; MTOR: mechanistic target of rapamycin kinase; MTORC1: MTOR complex 1; N2a: Neuro-2a neuroblastoma; Nec-1: necrostatin-1; NSA: necrosulfonamide; PBS: phosphate-buffered saline; PI: propidium iodide; PK-hLC3: pHluorin-mKate2-human LC3; RIPK1: receptor interacting serine/threonine kinase 1; RIPK3: receptor interacting serine/threonine kinase 3; ROS: reactive oxygen species; RPS6KB1/S6K: ribosomal protein S6 kinase B1; shRNA: short hairpin RNA; siRNA: small interference RNA; SQSTM1/p62: sequestosome 1; TBS: Tris-buffered saline; TNF/TNF-α: tumor necrosis factor; TSZ, treatment with TNF + DIABLO mimetics + z-VAD-FMK.
KEYWORDS: Autophagosome, Ca2+/calmodulin-dependent kinase II, lysosome, macroautophagy, necroptosis, nutrient deprivation, RIPK3
Introduction
MLKL (mixed lineage kinase domain like pseudokinase) is a well-known effector of necroptosis, a pro-inflammatory and caspase-independent form of cell death that occurs when apoptosis is inhibited [1,2]. Experimentally, necroptosis is typically triggered by the combined treatment of cells with TNF/TNF-α (tumor necrosis factor), a small-molecule DIABLO/SMAC (diablo IAP-binding mitochondrial protein)-mimetics (such as AZD 5582 dihydrochloride), and a caspase inhibitor (z-VAD-FMK), which are collectively referred to as TSZ. The TSZ treatment induces the activation of RIPK1 (receptor interacting serine/threonine kinase 1) and the formation of a protein complex, also known as the necrosome, that contains at the minimum, RIPK1, RIPK3 (receptor interacting serine/threonine kinase 3) and MLKL. Through a cascade of phosphorylation reactions, MLKL becomes activated, leading to its translocation to the plasma membrane and disruption of the membrane integrity that causes necrotic cell death [3–6]. RIPK3 binds to the kinase-like domain of MLKL and phosphorylates MLKL at Thr357 and Ser358 (for human) or Ser345 and S347 (for mouse) [1–3,7,8]. Because of this critical role and the specificity of its phosphorylation by RIPK3, MLKL phosphorylation/activation has been considered as the hallmark of necroptosis [1].
However, a number of studies have indicated that prior to translocation to the plasma membrane, the activated MLKL may also translocate to subcellular compartments, including mitochondria, exosomes, endosomes and lysosomes, where MLKL exerts roles in aerobic respiration leading to reactive oxygen species (ROS) formation, extracellular vesicle biogenesis, cytokine production, endocytosis and autophagy [9–12]. Moreover, activated MLKL was found to bind to endosomal sorting complexes required for transport (ESCRT), especially ESCRT-III [10,13]. These observations raise a possibility that MLKL may function in the endolysosomal systems, such as processes along the endocytic and/or autophagic pathways, rather than being only restricted to necroptosis. The finding that MLKL facilitated endosomal protein trafficking and degradation in both RIPK3-dependent and independent manners [10] suggest that distinct mechanisms may be exploited to activate MLKL for its endolysosomal function from that for necroptosis, and MLKL may be activated independently of RIPK3. Elucidating the mechanism underlying the alternative activation and function of MLKL will significantly broaden our knowledge on MLKL function and help uncover new strategies to combat disease.
Here we show that nutrient deprivation causes MLKL phosphorylation in a manner that depends on CAMK2/CaMKII (calcium/calmodulin dependent protein kinase II). CAMK2 is well-known as a downstream effector of cytosolic Ca2+ signaling in various situations, including autophagy [14–17], a process thought to be mainly pro-survival in order to maintain cellular energy levels and generate building blocks through recycling of cellular waste during starvation. Under necroptotic conditions, the translocation of MLKL to intracellular membranes is thought to suppress autophagy by inhibiting autophagic flux [11]. However, our data suggest that without the necroptosis stimuli, the CAMK2-dependent phosphorylation of MLKL facilitates autophagic flux and protein degradation, demonstrating a previously unrecognized positive role of MLKL in cell survival under starved conditions, contrary to its well-known involvement in necroptotic cell death.
Results
Starvation induces MLKL phosphorylation independently of RIPK3
Many cancer cells lack the expression of RIPK3 and are therefore protected from necroptosis [18]. However, they still express MLKL. Using an anti-mouse RIPK3 antibody, we detected expression of RIPK3 in L929 cells, a mouse fibroblast cell line frequently used in necroptosis studies [19,20], but not in Neuro-2a or N2a cells, a mouse neuroblastoma cell line (Figure 1A). The levels of MLKL protein were, however, comparable between the two cell lines, as shown by western blotting using an anti-mouse MLKL antibody (Figure 1A). Using a monoclonal antibody that recognizes the phosphorylated mouse MLKL at position Ser345, we assessed the activity levels of MLKL in these cells under fed and starved conditions. N2a cells were either maintained in the normal culture medium containing fetal bovine serum (FBS), amino acids and glucose or subjected to 1-h starvation by replacing the normal culture medium with an extracellular solution (ECS) that contained 10 mM glucose, but no FBS or amino acids. To our surprise, despite the lack of RIPK3, the only known serine/threonine kinase of MLKL, the serum and amino acid starvation markedly increased the phospho-MLKL (p-MLKL) levels in N2a cells (Figure 1B-D). After returning the cells to the normal culture medium (refeed), the p-MLKL levels recovered to the basal within 5 h. With continued starvation, we saw that p-MLKL levels in N2a cells peaked at 1–3 h and then declined at the 6th and 12th h before returning to the baseline at the 24th h (Fig. S1A and S1B). These results suggest that starvation induces a transient activation of MLKL.
Figure 1.
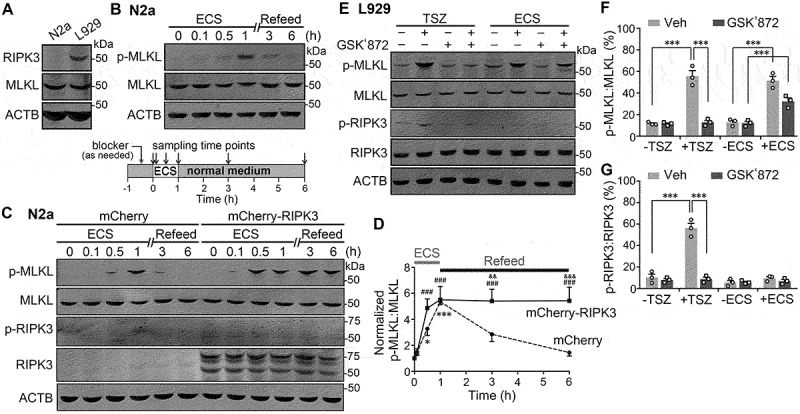
Starvation causes MLKL phosphorylation independently of RIPK3. (A) Western blots showing endogenous expression of RIPK3 and MLKL in N2a and L929 cells, with ACTB used as the loading control. Cell lysates from N2a and L929 cells were used. (B) Western blots for levels of phospho-MLKL (p-MLKL) and total MLKL in N2a cells treated with extracellular solution (ECS), representing serum and amino acid deprivation, for 0, 0.1, 0.5 and 1 h. After the 1-h starvation, the cells were returned to the regular culture medium (Refeed) for 2 and 5 h, indicated as 3 and 6 total hours, respectively, counting from the beginning of the ECS treatment (see inset below blots for protocol). (C) Similar to (B) but N2a cells were transiently transfected with either mCherry (control) or mCherry-RIPK3. The phospho-RIPK3 (p-RIPK3) and total RIPK3 levels were also assessed by western blotting. Note the cleavage products of mCherry-RIPK3 are about the size of untagged RIPK3 (~55 kD) and detected in all samples from mCherry-RIPK3-transfected cells but not those from mCherry-transfected cells. p-RIPK3 was very weakly detected in mCherry-RIPK3-transfected cells but not mCherry-transfected ones. (D) Time courses of normalized p-MLKL:MLKL ratios during starvation (ECS) and nutrient refeed in N2a cells that expressed mCherry (dashed lines) or mCherry-RIPK3 (solid lines). Data are presented as means ± SEM from n = 3 independent experiments. * P < 0.05, *** P < 0.001 vs. time zero for mCherry-transfected, ### P < 0.001 vs. time zero for mCherry-RIPK3 transfected, && P < 0.01, &&& P < 0.001 vs. mCherry-transfected at the corresponding time points, by two-way ANOVA followed by Bonferroni’s multiple comparisons test. (E) Western blots for levels of p-MLKL, MLKL, p-RIPK3, and total RIPK3 in L929 cells untreated (-) or treated (+) with either necroptosis inducers, TNF, SMAC mimetic, and z-VAD-FMK (TSZ) for 6 h, or ECS for 3 h. For some samples, GSK’872 (3 µM), a RIPK3 inhibitor, was added 0.5 h before and present during the treatment. (F and G) p-MLKL:MLKL (F) and p-RIPK3:RIPK3 (G) ratios for conditions shown in (E). Individual data points and means ± SEM of n = 3 experiments are shown. Veh, vehicle control for GSK’872. *** P < 0.001.
Given that MLKL is generally considered as the substrate of RIPK3, we transfected mCherry-RIPK3 into N2a cells to see if MLKL phosphorylation could be enhanced or altered by supplementing with RIPK3 under basal conditions and during the course of starvation and refeeding. Interestingly, compared to control cells that expressed mCherry, cells expressing mCherry-RIPK3 did not exhibit alterations in basal p-MLKL levels, but displayed a faster increase in MLKL phosphorylation in response to starvation and a much slower decline of the p-MLKL after nutrient replenishment(Figure1C and 1D).Thus, p-MLKL levels in mCherry-RIPK3-expressing cells approached the peak within 0.5 h of starvation and remained highly elevated even at 5 h after returning the cells to the normal culture medium(Figure1C and 1D).During the entire treatment periods, the activity of the exogenously expressed RIPK3, as assessed using an anti-mouse phospho-RIPK3 (Thr231/Ser232) antibody (p-RIPK3), maintained at low but nevertheless detectable levels (Figure 1C). These data indicate that while starvation induces MLKL phosphorylation independently of RIPK3, the presence of RIPK3 can accelerate this process and sustain the phosphorylation even hours after nutrients become available again.
To test if starvation also causes MLKL phosphorylation in cells that endogenously express RIPK3, we used L929 cells. As a positive control of necroptosis-induced MLKL activation, we also treated the L929 cells with a cocktail of TNF, the SMAC-mimetic and the caspase inhibitor, z-VAD-FMK, (TSZ) to induce conventional necroptosis in parallel with the starvation (ECS) treatment. p-MLKL levels were dramatically increased in L929 cells not only after 6 h exposure to TSZ but also following 1–6 h of incubation in ECS, with the peak increase detected at the 3rd hour (Figure 1E,1F, S1D, and S1E). Interestingly, whereas the TSZ-induced MLKL phosphorylation was completely suppressed by the RIPK3 inhibitor, GSK’872 (3 µM), the ECS-elicited increase in MLKL phosphorylation was only partially inhibited (Figure 1E and 1F).Supporting the idea that RIPK3 is responsible for phosphorylating MLKL in necroptosis, the p-RIPK3 levels were strongly increased after the TSZ treatment. However, the ECS treatment did not result in a detectable increase in RIPK3 phosphorylation (Figure 1E and 1G), despite the comparable increases in MLKL phosphorylation between the two treatment conditions (Figure 1F). Supporting the lack of involvement of necroptotic pathway in the starvation-induced MLKL phosphorylation, an L929 cell line with the knockout (KO) of either RIPK1 or RIPK3 gene (ripk1 KO or ripk3 KO) [21–24] exhibited a similar time course of p-MLKL level changes in response to the ECS treatment over a 24-h period as the wild type L929 cells (Fig. S1G and S1H).
Because of the reported difference in the activation mechanisms of MLKL between mice and humans [6,25], we also tested whether starvation causes MLKL phosphorylation in human cells. HT29 is a human colon cancer cell line frequently used in necroptosis studies [23,26], while HEK293 cells are transformed human embryonic kidney cells reported not to endogenously express RIPK3 [18,26]. Using an anti-human RIPK3 antibody, we detected the RIPK3 band by western blotting in HT29 but not HEK293 cells (Fig. S1I). Similar to the mouse cells, the human cells also exhibited transient starvation-induced increases in MLKL phosphorylation, as detected by an anti-human p-MLKL (S358, equivalent to S345 of mouse MLKL) antibody, which returned to the baseline at the ~12th hour of the ECS treatment. For HEK293 cells, the p-MLKL level peaked at 1 h of the ECS treatment (Fig. S1J and S1K), while for HT29 cells, the enhanced phosphorylation lasted from 1 to 6 h (Fig. S1M and S1N). Interestingly, in both L929 and HT29 cells, the duration of starvation-induced MLKL phosphorylation lasted longer than in N2a and HEK293 cells, respectively, consistent with the above finding that the presence of RIPK3 extended the period of MLKL phosphorylation (Figure 1C and 1D). In all these cases, however, no obvious change in RIPK3 phosphorylation or protein expression level was observed (Fig. S1D and S1M). Altogether, the above data demonstrate that starvation evokes MLKL phosphorylation in both mouse and human cells in a RIPK3-independent manner. The starvation-induced MLKL phosphorylation is transient, although the duration can be extended in the presence of RIPK3, even after cessation of the starvation.
CAMK2 mediates starvation-induced MLKL phosphorylation
To identify the kinase(s) involved in the starvation-induced MLKL phosphorylation, we first used the sequence around residue S345 of mouse MLKL (ELSKTQNS345ISRTAKS) to search for kinase candidates using the NetPhos 3.1 Server (http://www.cbs.dtu.dk/services/NetPhos/, Technical University of Denmark). Taking into account that MLKL sequences are quite diverse among different species, but the function should be conserved, we compared the search results for equivalent regions of MLKL from multiple vertebrate species to narrow down the number of hits. By further focusing on kinases known to become activated in response to starvation, we selected two candidates, GSK3B/GSK3β (glycogen synthase kinase 3 beta) and CAMK2. GSK3B is considered as a central metabolic regulator in nutrient starvation [27,28], while CAMK2 has been implicated in regulating multiple functions in response to nutrient deprivation [29–32]. However, by including the GSK3B inhibitor, SB216763, in the ECS at three different concentrations (0.1, 1, and 10 µM, with a 30-min pretreatment), which suppressed the increase in p-GSK3B (p-Ser9) levels, we did not detect any change in the starvation-induced MLKL phosphorylation in N2a cells (Figure 2A and 2B). Similar results were obtained with the use of another GSK3B inhibitor, CHIR99021 (Fig. S2A).
Figure 2.
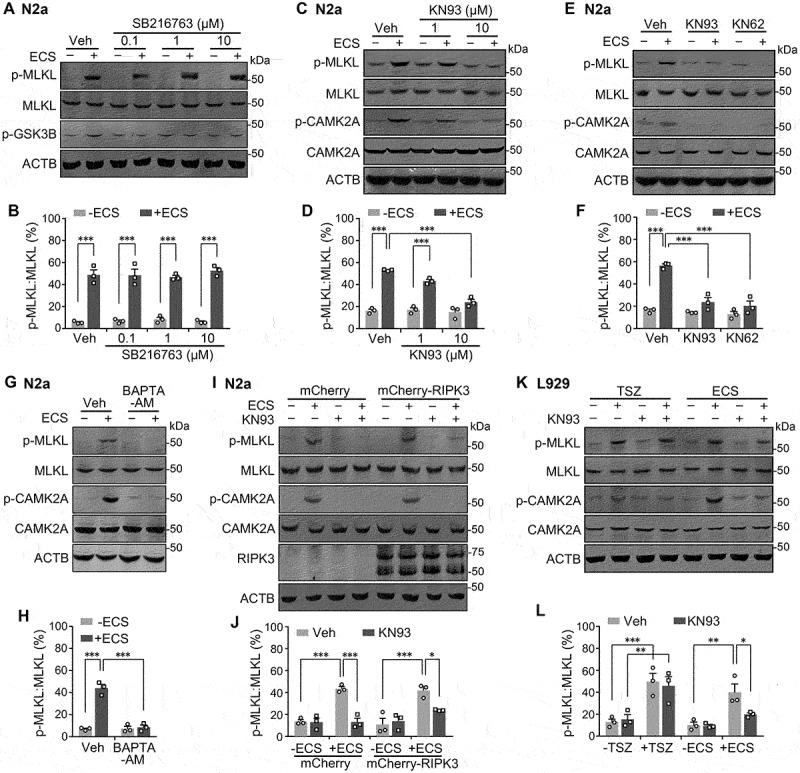
CAMK2 is involved in starvation-induced MLKL phosphorylation. (A) Western blots for levels of p-MLKL, MLKL, and phospho-GSK3B (p-GSK3B) in N2a cells unstarved (-ECS) or starved in ECS for 1 h. GSK3B inhibitor, SB216763 (0.1, 1 and 10 µM), was added at 0.5 h before and present during the starvation. Note, all three SB216763 concentrations suppressed the starvation-induced increase in p-GSK3B, but not p-MLKL. (B) p-MLKL:MLKL ratios for conditions shown in (A). Individual data points and means ± SEM of n = 3 experiments are shown. *** P < 0.001. (C) Western blots for levels of p-MLKL, MLKL, phospho-CAMK2A (p-CAMK2A), and total CAMK2A in N2a cells unstarved (-ECS) or starved in ECS for 1 h. CAMK2 inhibitor, KN93 (1 and 10 µM), was added at 0.5 h before and present during the starvation. (D) p-MLKL:MLKL ratios for conditions shown in (C). Individual data points and means ± SEM of n = 3 experiments are shown. *** P < 0.001. (E and F) Similar to (C and D), but CAMK2 inhibitors, KN93 and KN62 (both 10 µM), were used. (G and H) Similar to (C and D), but BAPTA-AM (200 µM) was used in place of KN93. (I) Western blots for levels of p-MLKL, MLKL, p-CAMK2A, CAMK2A, and RIPK3 in N2a cells transiently transfected with mCherry or mCherry-RIPK3. Cells were unstarved (-ECS) or starved in ECS for 1 h in the absence or presence of KN93 (10 µM), added at 0.5 h before and present during the starvation. (J) p-MLKL:MLKL ratios for conditions shown in (I). Individual data points and means ± SEM of n = 3 experiments are shown. * P < 0.05, *** P < 0.001. (K) Western blots for levels of p-MLKL, MLKL, p-CAMK2A, and CAMK2A in L929 cells untreated (-) or treated (+) with either TSZ for 6 h or ECS for 3 h, in the absence or present of KN93 (10 µM), added at 0.5 h before and present during the TSZ and ECS treatment. (L) p-MLKL:MLKL ratios for conditions shown in (K). Individual data points and means ± SEM of n = 3 experiments are shown. * P < 0.05, ** P < 0.01, *** P < 0.001.
On the other hand, the inhibition of CAMK2 by KN93 prevented the starvation-induced MLKL phosphorylation in N2a cells in a concentration-dependent manner, with complete inhibition achieved at 10 μM (Figure 2C and 2D). The structurally unrelated CAMK2 inhibitor, KN62 (10 μM), also inhibited the phosphorylation of MLKL to a similar extent as KN93 (Figure 2E and2F). In line with the notion that CAMK2 activation requires intracellular Ca2+ elevation, the starvation-induced phosphorylation of MLKL was also abolished by treating cells with BAPTA-AM, a membrane-permeable Ca2+ chelator (Figure 2G and2H). Moreover, the starvation treatment with ECS consistently increased p-CAMK2A (Thr286) levels in N2a cells and the increase was suppressed by inhibiting CAMK2 or chelating intracellular Ca2+ (Figure 2C, 2E, and 2G).The phosphorylation time course of CAMK2A also closely matched with that of MLKL in each of the cell lines tested, N2a, L929, HEK293, and HT29 (Fig. S1). These data demonstrate that serum and amino acid deprivation causes CAMK2 activation in a Ca2+-dependent manner, which in turn leads to enhanced MLKL phosphorylation.
Given that RIPK3 accelerated MLKL phosphorylation during starvation and slowed down the recovery of MLKL (Figure 1C, 1D and S1), we wondered if CAMK2-mediated MLKL phosphorylation only in the absence of RIPK3. To answer this question, we examined the effect of KN93 on starvation-induced MLKL phosphorylation in N2a cells that expressed mCherry-RIPK3, with cells that expressed mCherry as a control. Interestingly, whereas KN93 (10 µM) completely abolished the starvation-induced increase in p-MLKL levels in mCherry control cells, it suppressed the increase by ~67% (P = 0.047) in cells that expressed mCherry-RIPK3 (Figure 2I and 2J). In L929 cells that endogenously express RIPK3, while KN93 failed to affect the increase in p-MLKL levels induced by TSZ, it blocked (also ~67% reduction) the increased p-MLKL levels in response to starvation (Figure 2K and 2L). With 30 µM KN93, the inhibition of MLKL phosphorylation was more complete (Fig. S2B), and KN93 also abolished starvation-induced MLKL phosphorylation in HT29 cells at 30 µM, but not 10 µM (Fig. S2C). Furthermore, in L929 ripk1 KO and L929 ripk3 KO cells, 10 µM KN93 completely abolished starvation-induced MLKL phosphorylation (Fig. S2D and S2E). The starvation with ECS also increased p-CAMK2A levels in the L929 and HT29 cells, which were suppressed by KN93 (Figure 2K and S2B-E); however, the TSZ treatment had a very weak impact, if any, on CAMK2A activation in L929 cells (Figure 2K).
It is well-known that the phosphorylation of MLKL causes its oligomerization to form multimers [3,6,7]. Using non-reducing gels, we detected decreases in the monomeric and increases in the oligomeric forms of MLKL in L929 cells treated with TSZ or ECS, and KN93 (10 µM) prevented the ECS-induced changes, but not that caused by TSZ (Fig. S2F). Thus, like in the necroptotic pathway, starvation not only enhances MLKL phosphorylation but also leads to its oligomerization; however, only the starvation-induced effects are mediated by CAMK2. Taken together, the above data demonstrate that while RIPK3 is dedicated to mediating MLKL phosphorylation in necroptosis, CAMK2 is involved in phosphorylating MLKL under serum and amino acid-deprived conditions, although RIPK3 may augment and/or extend such an effect. In addition, the CAMK2-dependent MLKL phosphorylation occurs in both mouse and human cells and in both the absence and presence of RIPK3.
CAMK2 is physically associated with MLKL in starved cells
To catalyze phosphorylation, the kinase should be in close proximity or physically associated with the substrate. To see if CAMK2 is physically associated with MLKL in cells, we performed co-immunoprecipitation assays using both anti-CAMK2A and anti-MLKL antibodies to pull down protein complexes from lysates prepared from fed and starved N2a cells. Interestingly, not only did the anti-CAMK2A antibody pull down markedly more MLKL proteins in ECS-treated cells than cells kept in the normal culture medium, but reciprocally, the anti-MLKL antibody also precipitated more CAMK2A proteins in the ECS-treated cells (Figure 3A and 3B), indicating that starvation causes CAMK2 to physically associate with MLKL. Similar results were obtained using heterologously expressed HA-tagged MLKL and FLAG-tagged CAMK2A and the corresponding antibodies for the HA and FLAG tags (Fig. S3), showing that the recombinant MLKL and CAMK2A also interact in a starvation-dependent manner. This helps to rule out the artifact related to the use of a particular antibody. Moreover, the starvation-induced association between CAMK2A and MLKL was disrupted by the treatment with KN93 (Figure 3C), indicating that the interaction is dependent on the activation of CAMK2.
Figure 3.
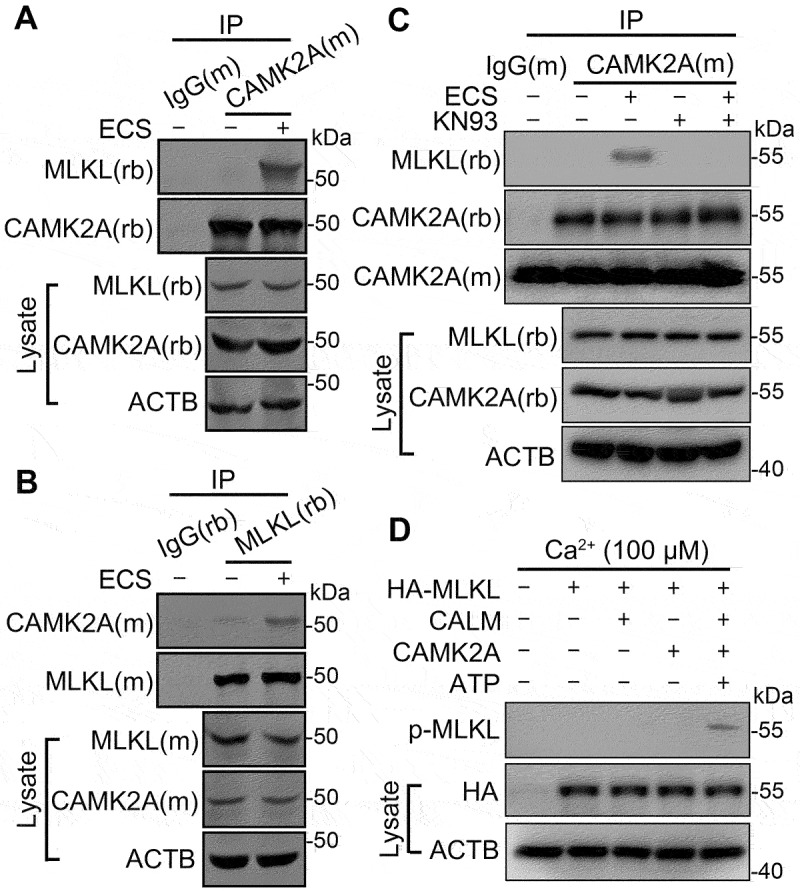
Starvation induces CAMK2A-MLKL association in a protein complex. (A and B) Cell lysates from N2a cells untreated or treated with ECS for 1 h were subject to immunoprecipitation (IP) by IgG, or anti-CAMK2A (A) or anti-MLKL (B) antibody, followed by western blotting for MLKL and CAMK2A. (M) and (rb) denote the antibody host species as mouse and rabbit, respectively. The reciprocal co-immunoprecipitation showed increased association between CAMK2 and MLKL following starvation. (C) As in (A) but the cells were treated with KN93 (10 µM) as indicated. The blot by the mouse anti-CAMK2A antibody (CAMK2A[m]) shows the presence of antibody heavy chain in IP products from both IgG(m) and CAMK2A(m). However, the rabbit anti-CAMK2A antibody (CAMK2A[rb]) only revealed bands in this area for IP products from CAMK2A(m), but not that from IgG(m), indicating no cross reactivity of the secondary antibody. (D) In vitro kinase assay showing MLKL phosphorylation by recombinant CAMK2A. HA-MLKL purified by IP from transfected N2a cells was incubated with CALM, CAMK2A and ATP as indicated in a kinase buffer. The samples were subject to western blotting by the p-MLKL antibody. HA and ACTB were also measured from the cell lysates.
To further demonstrate that ECS-induced phosphorylation of MLKL is CAMK2-dependent, we performed an in vitro kinase assay using purified CALM (calmodulin) and CAMK2A. Recombinant HA-MLKL was collected from N2a cell lysates 24 h after transfection by immunoprecipitation using an anti-HA antibody. As shown in Figure 3D, only in the presence of Ca2+, CALM, CAMK2A, and ATP, p-MLKL was detected. This result strongly supports the role of CAMK2A in MLKL phosphorylation.
MLKL facilitates autophagic flux in response to starvation
Recently, MLKL has been reported to be involved in the process of autophagy and endosomal protein trafficking, in addition to its well-recognized function in necroptosis [10–13,33–35]. To determine the functional significance of MLKL activation by CAMK2 in response to nutrient deprivation, we examined the autophagy marker, lipidated MAP1LC3B/LC3B (microtubule associated protein 1 light chain 3 beta; LC3-II), along with the measurement of p-MLKL levels in N2a cells kept in the normal culture medium, treated with ECS for different times (0.5 and 1 h), and then returned to the normal culture medium for 2 and 5 h. Intriguingly, there appeared to be an inverse relationship between p-MLKL and LC3-II levels in these cells. While the p-MLKL levels increased to the peak at 1 h after starvation and then recovered after 5 h of refeeding, the LC3-II levels dropped gradually in response to starvation until 1 h and returned slowly to near the baseline at 5 h after nutrient replenishment (Figure 4A and 4B).In N2a, L929, HEK293, and HT29 cells subjected to long-term starvation for up to 24 h, LC3-II levels also mirrored the changes in MLKL phosphorylation in the opposite direction, showing transient decreases for 1 to 6 h during the early phase of the ECS treatment (Fig. S1).
Figure 4.
MLKL activation facilitates starvation-induced substance degradation. (A) Western blots for levels of p-MLKL, MLKL, LC3-I and LC3-II in N2a cells treated with ECS for 0, 0.5 and 1 h. After the 1 h starvation, the cells were returned to the regular culture medium (Refeed) for 2 and 5 h, indicated as 3 and 6 total hours, respectively, counting from the beginning of the ECS treatment. (B) Time courses of normalized LC3-II:LC3-I (solid black) and p-MLKL:MLKL (dashed gray) ratios during starvation (ECS) and nutrient refeed in N2a cells. Data are presented as means ± SEM from n = 3 independent experiments. * P < 0.05, ** P < 0.01, *** P < 0.001 vs. zero time point for LC3-II:LC3-I, by one-way ANOVA followed by Dunnett’s multiple comparisons test. (C) Western blots for levels of p-MLKL, MLKL, phospho- RPS6KB1 (p-RPS6KB1), total RPS6KB1, SQSTM1, LC3-I, and LC3-II in N2a cells untreated (-) or treated (+) with ECS for 1 h. Vehicle (Veh) or GW806742X (GW, 1 µM) was added at 0.5 h before and present during the treatment. (D-G) p-MLKL:MLKL (D), p-RPS6KB1:RPS6KB1 (E), SQSTM1:ACTB (F), and LC3-II:LC3-I (G) ratios for conditions shown in (C). Individual data points and means ± SEM of n = 3 experiments are shown. ** P < 0.01, *** P < 0.001. (H) Representative single z-section confocal fluorescence images of N2a cells expressing PK-hLC3. The cells were unstarved (-ECS) or starved in ECS for 1 h in the absence (Veh) or presence of 1 µM GW. Scale bar: 10 µm. (I) % LC3 puncta displaying only red fluorescence signals for cells treated as in (H). Shown are individual data points and means ± SEM of n = 9 cells from 3 independent experiments, each with 3 cells. *** P < 0.001.
Reduction in LC3-II levels could result from either a decrease in its production due to inhibition of autophagosome formation or an increase in its degradation, which occurs following the fusion of autophagosomes and lysosomes. To distinguish these possibilities, we first treated L929 cells with bafilomycin A1, an inhibitor of vacuolar H+-ATPase that disrupts lysosomal degradation by raising lysosomal pH [36]. In the presence of bafilomycin A1 (0.1 µM), while the ECS treatment still induced MLKL phosphorylation, the decrease in LC3-II levels were no longer detected (Figure 5A, 5C, 5D, and 5F), indicating that the starvation-induced decrease in LC3-II results from an increase in lysosomal degradation. Second, we measured the levels of SQSTM1/p62 (sequestosome 1), a widely used marker of autophagic degradation by autolysosomes [37], in the ECS-treated N2a cells. Interestingly, SQSTM1 levels were similarly decreased as LC3-II following the 1 h nutrient deprivation in ECS (Figure 4C, 4F, and4G), indicating that degradation is enhanced upon starvation. Similar starvation-induced decreases of SQSTM1 levels were seen in L929 cells, which were blocked by bafilomycin A1 (Figure 5A, 5B, 5D, and 5E). Furthermore, in the long-term starvation experiments, SQSTM1 levels changed with similar time courses as LC3-II in both mouse and human cell lines (Fig. S1).
Figure 5.
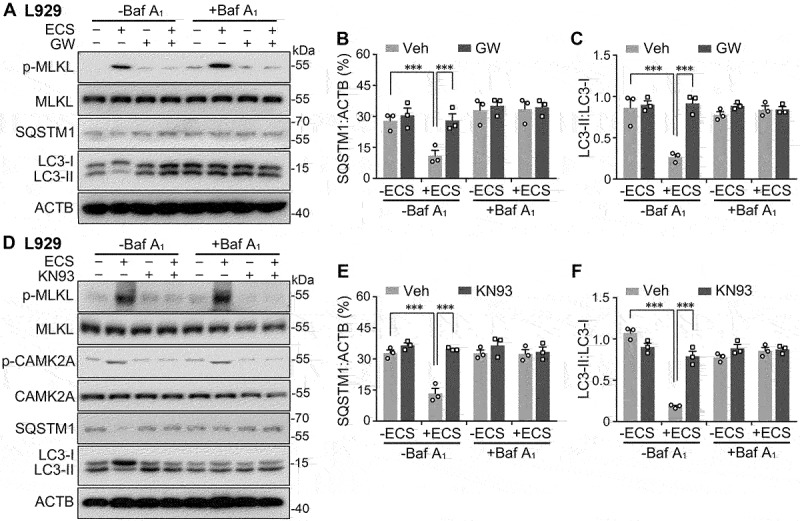
Starvation enhances autophagic flux in a manner that depends on MLKL and CAMK2A activity. (A) Western blots for levels of p-MLKL, MLKL, SQSTM1, LC3-I, and LC3-II, in L929 cells untreated (-) or treated (+) with ECS for 3 h. Vehicle (Veh), bafilomycin A1 (Baf A1, 0.1 µM), and GW806742X (GW, 1 µM) were added at 0.5 h before and present during the treatment. (B and C) SQSTM1:ACTB (B) and LC3-II:LC3-I (C) ratios for conditions shown in (A). Individual data points and means ± SEM of n = 3 experiments are shown. * P < 0.05, *** P < 0.001. (D) Western blots for levels of p-MLKL, MLKL, p-CAMK2A, CAMK2A, SQSTM1, LC3-I, and LC3-II in L929 cells untreated (-) or treated (+) with ECS for 3 h. Vehicle (Veh), Baf A1 (0.1 µM), and KN93 (10 µM) were added at 0.5 h before and present during the treatment. (E and F) SQSTM1:ACTB (E) and LC3-II:LC3-I (F) ratios for conditions shown in (D). Individual data points and means ± SEM of n = 3 experiments are shown. *** P < 0.001.
Serum and amino acid deprivation induces autophagy through inactivation of MTOR (mechanistic target of rapamycin kinase) complex 1 (MTORC1). As a marker of MTORC1 activity, the phosphorylation of RPS6KB1/S6K (ribosomal protein S6 kinase B1) showed a marked decrease as revealed by the anti-phospho-RPS6KB1 (T389) antibody (p-RPS6KB1) following the 1-h ECS treatment in N2a cells (Figure 4C and 4E). To determine if MTORC1 inactivation is sufficient to cause MLKL activation, we treated N2a cells with Torin-1, an inhibitor of MTOR. The treatment with Torin-1 (50 nM, 1 h) led to a marked increase in p-MLKL levels, which was accompanied by decreases in LC3-II and SQSTM1 levels (Fig. S4A-D). Interestingly, the effect of Torin-1 on MLKL phosphorylation was comparable to that of the ECS treatment and when Torin-1 and ECS were combined, the p-MLKL levels were not further increased (Fig. S4A and S4B), indicating that inhibiting MTORC1 is equipotent to starvation in inducing MLKL phosphorylation.
With starvation introduced by using Hanks’ balanced salt solution (HBSS), we also detected similar time courses in the increase of p-MLKL levels and decreases in SQSTM1 and LC3-II levels in L929 cells (Fig. S5A) as that induced by ECS (Fig. S1). While the increase in MLKL phosphorylation was not affected by bafilomycin A1 (0.1 µM), the decreases of SQSTM1 and LC3-II were prevented by blocking the vacuolar H+-ATPase (Fig. S5B). These indicate that changes seen in p-MLKL, SQSTM1, and LC3-II levels resulted from serum and amino acid deprivation rather than the specific solutions used. To examine whether the enhanced autolysosomal degradation induced by starvation is dependent on MLKL activity, we treated the N2a and L929 cells with the MLKL inhibitor, GW806742X. With GW806742X (1 μM) added at 30 min before exposure to the ECS, the starvation-induced phosphorylation of MLKL was diminished (Fig. 4C, 4Dand 5A), along with the prevention of decreases in SQSTM1 (Fig. 4C,4F,5A, and 5B) and LC3-II (Fig. 4C, 4G, 5A,and 5C) levels. However, the starvation-induced decrease in p-RPS6KB1 levels was not affected by inhibiting MLKL (Figure 4C and 4E).
As pharmacological approaches may suffer from off-target effects, we also used genetic approaches to manipulate MLKL expression. First, we used an L929 cell line in which the gene for MLKL was knocked out (mlkl KO) [21–23]. In wild type L929 cells, whereas ECS caused decreases in p-RPS6KB1, SQSTM1, and LC3-II levels, the TSZ treatment resulted in increases in p-RPS6KB1, SQSTM1, and LC3-II levels (Figure 6A-D), indicating opposite effects between starvation and necroptosis on MTORC1 activation and lysosomal degradation. Importantly, the loss of MLKL abolished both the starvation- and necroptosis-induced changes in SQSTM1 and LC3-II levels, but not that of p-RPS6KB1:RPS6KB1 ratio (Figure 6A-D; also see Fig. S5A and S5B), demonstrating that despite the opposite effects, MLKL is critical in mediating these functions. Second, we used short hairpin RNA (shRNA) to knock down the expression of MLKL in N2a cells. As shown in Fig. S6A, Mlkl shRNA reduced the MLKL levels by ~80%, which also abolished the increase in MLKL phosphorylation induced by the ECS treatment (Fig. S6A and S6B). The control shRNA did not have any effect as compared to the mock-transfected cells. While the knockdown of MLKL did not alter the decrease in p-RPS6KB1:RPS6KB1 ratio (Fig. S6A and S6C), it prevented the degradation of SQSTM1 (Fig. S6A and S6D) and LC3-II (Fig. S6A and S6E) in response to starvation. Together with the pharmacological results, the above data strongly argue for a positive role of MLKL in facilitating autophagic flux and enhancing autolysosomal degradation in short-term starvation.
Figure 6.
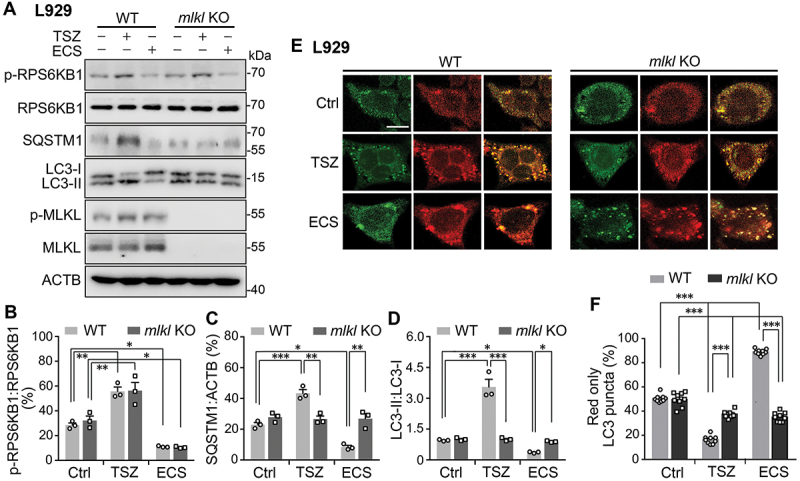
Necroptosis inhibits autophagic flux while starvation enhances it, and both are abolished by the knockout of MLKL from L929 cells. (A). Western blots for levels of p-RPS6KB1, RPS6KB1, SQSTM1, LC3-I, LC3-II, p-MLKL, and MLKL in wild type (WT) and mlkl knockout (KO) L929 cells. Cells were untreated (Ctrl) or treated with either TSZ for 6 h or ECS for 3 h. Note the complete lack of p-MLKL and MLKL immunoreactivity in mlkl KO cells. (B-D) p-RPS6KB1:RPS6KB1 (B), SQSTM1:ACTB (C), and LC3-II:LC3-I (D) ratios for conditions shown in (A). Note the increases induced by TSZ and decreases caused by ECS in WT cells. The lack of MLKL abolished the effects on SQSTM1 and LC3-II:LC3-I ratio by both TSZ and ECS but had no impact on the changes in the p-RPS6KB1:RPS6KB1 ratio. Individual data points and means ± SEM of n = 3 experiments are shown. * P < 0.05; ** P < 0.01, *** P < 0.001. (E) Representative single z-section confocal fluorescence images of WT and mlkl KO L929 cells transfected with PK-hLC3. The cells were untreated (Ctrl) or treated with either TSZ for 6 h or ECS for 3 h. Scale bar: 10 µm. (F) % LC3 puncta displaying only red fluorescence signals for cells treated as in (E). Shown are individual data points and means ± SEM of n = 9 cells from 3 independent experiments, each with 3 cells. *** P < 0.001.
To further verify that starvation-induced MLKL activation facilitates autophagic flux and thereby degradation, we made use of pHluorin-mKate2-hLC3 (PK-hLC3) as an indicator of fusion between autophagosomes and lysosomes to form autolysosomes. In the acidic environment of the autolysosome, the fluorescence of pHluorin (green) is quenched by protons more strongly than the fluorescence of mKate (red), resulting in predominantly red labeling of PK-hLC3 puncta, contrasting to the yellow (both green and red) fluorescence of the dually labeled PK-hLC3 puncta in autophagosomes, which have relatively neutral pH [38]. Thus, in cells that expressed PK-hLC3, green and red fluorescence co-labeled yellow puncta represent autophagosomes while red fluorescence puncta indicate successfully fused autolysosomes. As expected, in PK-hLC3-transfected N2a cells, both yellow and red puncta coexisted in cytosolic areas. While stimulating autophagy with Torin-1 increased the proportion of red puncta, suppressing lysosomal degradation with bafilomycin A1 decreased the proportion of red puncta (Fig. S4E).
Importantly, starvation induced a marked increase in the proportion of red puncta, indicating enhanced autophagic flux (Figure 4H and 4I). However, inhibiting MLKL with GW806742X (1 µM) decreased the proportion of red puncta in both fed and starved cells (Figure 4H and 4I). Similar results were also obtained in mlkl KO L929 cells (Figure 6E and 6F), and Mlkl shRNA-treated N2a cells (Fig. S6F and S6G). Interestingly, in wild type L929 cells, even though both TSZ and ECS treatments enhanced MLKL phosphorylation, only ECS, but not TSZ, resulted in an increase in the proportion of red puncta. TSZ, instead, caused a decrease in the proportion of red puncta. These opposite effects support the idea that MLKL activation under necroptotic and nutrient-deprived conditions differentially affects autophagic flux. Also intriguing is that under fed conditions, unlike the GW806742X- or Mlkl shRNA-treated cells, which exhibited reduced autophagic flux without the starvation treatment, mlkl KO cells appeared to have normal basal autophagic flux as the wild type L929 cells, indicative of a compensatory effect. However, although TSZ-treatment still decreased the proportion of red puncta in the mlkl KO cells, the decrease was less pronounced than in the wild type cells; and ECS even caused a decrease, instead of an increase, of the proportion of red puncta in the mlkl KO cells (Figure 6E and 6F). With the long-term (6 and 16 h) treatment of HBSS, wild type L929 cells also displayed increases in the red puncta, which were prevented with the loss of MLKL (Fig. S5C). Thus, MLKL contributes to both the necroptosis-induced decrease and starvation-induced increase of autophagic flux. Collectively, the above results further support the notion that MLKL facilitates autophagic flux in starvation, most likely by promoting the fusion of autophagosomes with lysosomes and thereby autolysosome formation and subsequent cargo degradation. This effect appears to be different, or even opposite, from the action of MLKL on autophagic flux when it is stimulated through the necroptotic pathway.
MLKL facilitates autophagic flux in a CAMK2-dependent manner
Since CAMK2 underlies the phosphorylation and thereby activation of MLKL in starvation, we investigated the effect of CAMK2 inhibition on autophagic flux under starvation in L929 and N2a cells. As with inhibiting MLKL, inhibiting CAMK2 with KN93 (10 µM) also prevented the starvation-induced decreases in SQSTM1 and LC3-II levels (Figure 5D-F, 7A, 7D, and 7E), along with its effect on suppressing the increase in MLKL phosphorylation (Figs. 5D, 7A, and 7B). Also similar to MLKL inhibition, KN93 did not interfere with the starvation-induced MTORC1 inactivation (Figure 7A and 7C). Furthermore, the treatment with KN93 reduced the proportion of red puncta in N2a cells that expressed PK-hLC3 under both fed and starved conditions, especially under starvation (Figure 7E and 7F), similar to that seen in MLKL-inhibited cells. To support the pharmacological data, we also used the small interference RNA (siRNA) approach to knock down the expression of CAMK2A in N2a cells, which produced essentially the same results as the use of KN93 (Fig. S7). These data establish a functional link between CAMK2 regulation of MLKL and acceleration of autophagic flux through facilitating autolysosome formation and the consequent degradation in short-term starvation.
Figure 7.
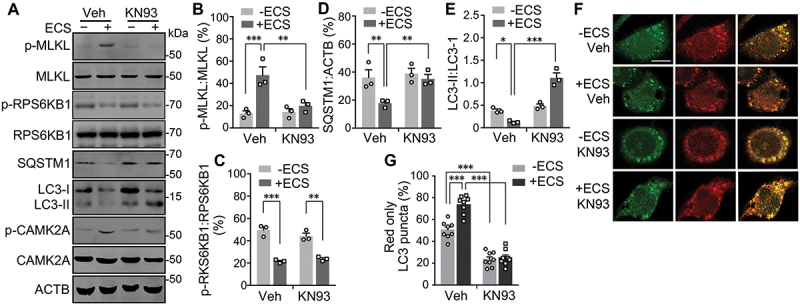
CAMK2 activity is required for starvation-induced substance degradation. (A) Western blots for levels of p-MLKL, MLKL, p-RPS6KB1, RPS6KB1, SQSTM1, LC3-I, LC3-II, p-CAMK2A, and CAMK2A in N2a cells untreated (-) or treated (+) with ECS for 1 h. Vehicle (Veh) or KN93 (10 µM) was added at 0.5 h before and present during the starvation. (B-E) p-MLKL:MLKL (B), p-RPS6KB1:RPS6KB1 (C), SQSTM1:ACTB (D), and LC3-II:LC3-I (E) ratios for conditions shown in (A). Individual data points and means ± SEM of n = 3 experiments are shown. * P < 0.05, ** P < 0.01, *** P < 0.001. (F) Representative single z-section confocal fluorescence images of N2a cells unstarved (-ECS) or starved in ECS for 1 h in the absence (Veh) or presence of 10 µM KN93. Scale bar: 10 µm. (G) % LC3 puncta displaying only red fluorescence signals for cells treated as in (F). Shown are individual data points and means ± SEM of n = 9 cells from 3 independent experiments, each with 3 cells. *** P < 0.001.
Furthermore, in L929 cells, although KN93 (10 µM) inhibited the increase in MLKL phosphorylation and the decreases in SQSTM1 and LC3-II levels caused by the ECS treatment, it did not impact the increases induced by TSZ (Figure 8A-C). By contrast, inhibiting RIPK1 with a RIPK1 inhibitor, necrostatin-1 (Nec-1, 30 µM) (Figure 8D-F), or RIPK3 with GSK’872 (3 µM) (Figure 8G-I), abolished the TSZ-induced increases in p-MLKL, SQSTM1, and LC3-II levels without affecting the changes caused by starvation with ECS. In L929 ripk1 KO and L929 ripk3 KO cells, the ECS-induced decreases in SQSTM1 and LC3-II levels were also readily detected as in the wild type cells (Fig. S1G and S1H), which were suppressed by the treatment with KN93 (Fig. S2D and S2E). In HT29 cells, KN93 (30 µM) also selectively inhibited the increase in p-MLKL and decreases in SQSTM1 and LC3-II levels induced by ECS, without affecting the changes caused by TSZ, and by contrast, Nec-1 and GSK’872 only suppressed the increases caused by TSZ, with no effect on the ECS-induced changes (Fig. S8). These data again argue for differential regulations of autophagic flux by MLKL activated through starvation-CAMK2 signaling and necroptosis-RIPK1-RIPK3 pathway, respectively. The results further validate the specificity of blockers used in the current study for selectively disrupting MLKL activation by the two different mechanisms through inhibition of CAMK2 and RIPK1-RIPK3, respectively.
Figure 8.
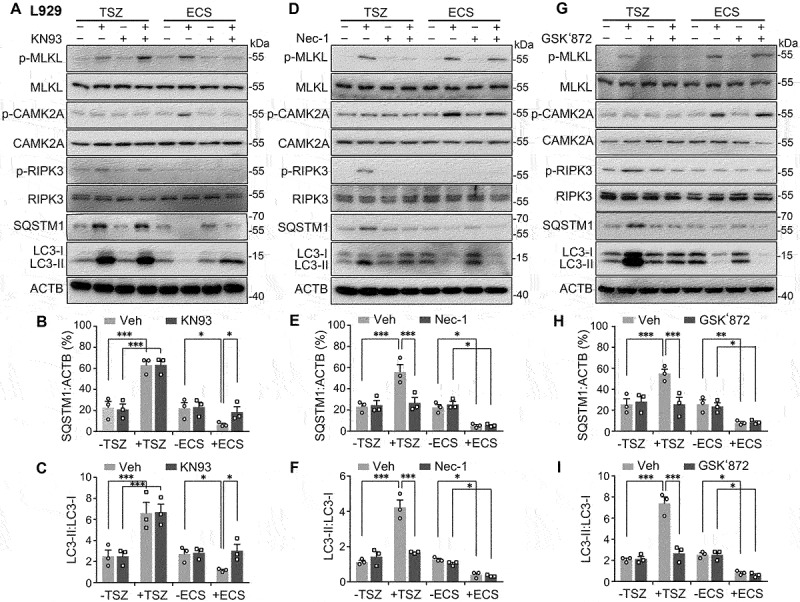
Necroptosis and starvation exert opposite effects on autophagic flux in L929 cells via MLKL phosphorylation by using two distinct pathways. (A, D, and G) Western blots for levels of p-MLKL, MLKL, p-CAMK2A, CAMK2A, p-RIPK3, RIPK3, SQSTM1, LC3-I, and LC3-II in L929 cells. Cells were untreated (-) or treated (+) with either TSZ for 6 h or ECS for 3 h. KN93 (10 µM, A), Nec-1 (30 µM, D), or GSK’872 (3 µM, G) was added at 0.5 h before and present during the treatment. For each set, vehicle (Veh) was added as a negative control. Note KN93 only blocked the changes induced by ECS, whereas Nec-1 and GSK’872 just suppressed that caused by TSZ. (B and C) SQSTM1:ACTB (B) and LC3-II:LC3-I (C) ratios for conditions shown in (A). (E and F) SQSTM1:ACTB (E) and LC3-II:LC3-I (F) ratios for conditions shown in (D). (H and I) SQSTM1:ACTB (H) and LC3-II:LC3-I (I) ratios for conditions shown in (G). Individual data points and means ± SEM of n = 3 experiments are shown. * P < 0.05; ** P < 0.01, *** P < 0.001.
Starvation-induced MLKL activation does not cause cell death
The opposite effects of MLKL activation by starvation and necroptosis on autophagic flux prompted us to test whether the starvation-induced MLKL phosphorylation was still pro-death, like its commonly accepted role in necroptosis [1–6]. To define the significance in cell survival of MLKL activation in response to nutrient deprivation, we first examined viability of L929 cells treated with TSZ for 6 h or ECS for 3 h by staining with propidium iodide (PI), which specifically labels the nuclei of necrotic cells. Both TSZ and ECS treatments greatly increased p-MLKL levels in the L929 cells, and the increase was abolished by GW806742X (1 μM) (Figure 9A and 9B). In order for the cell death to fully develop, after the treatment with TSZ or ECS, cells were cultured in the normal culture medium for 6 h before PI straining was performed. As previously reported, inducing necroptosis by the TSZ treatment dramatically increased the number of PI-positive L929 cells, and the effect was abolished by blocking MLKL with GW806742X. However, the ECS treatment did not cause detectable cell death in L929 cells (Figure 9C and 9D). As an alternative to evaluate cell death, we also performed lactate dehydrogenase (LDH) assay. Again, L929 cells showed increased LDH activity in response to the TSZ treatment, which was suppressed by GW806742X; however, ECS did not alter LDH activity in these cells (Figure 9E). These data suggest that, unlike necroptosis inducer-elicited MLKL activation, the starvation-induced MLKL activity does not negatively affect cell survival, even in the presence of endogenously expressed RIPK3.
Figure 9.
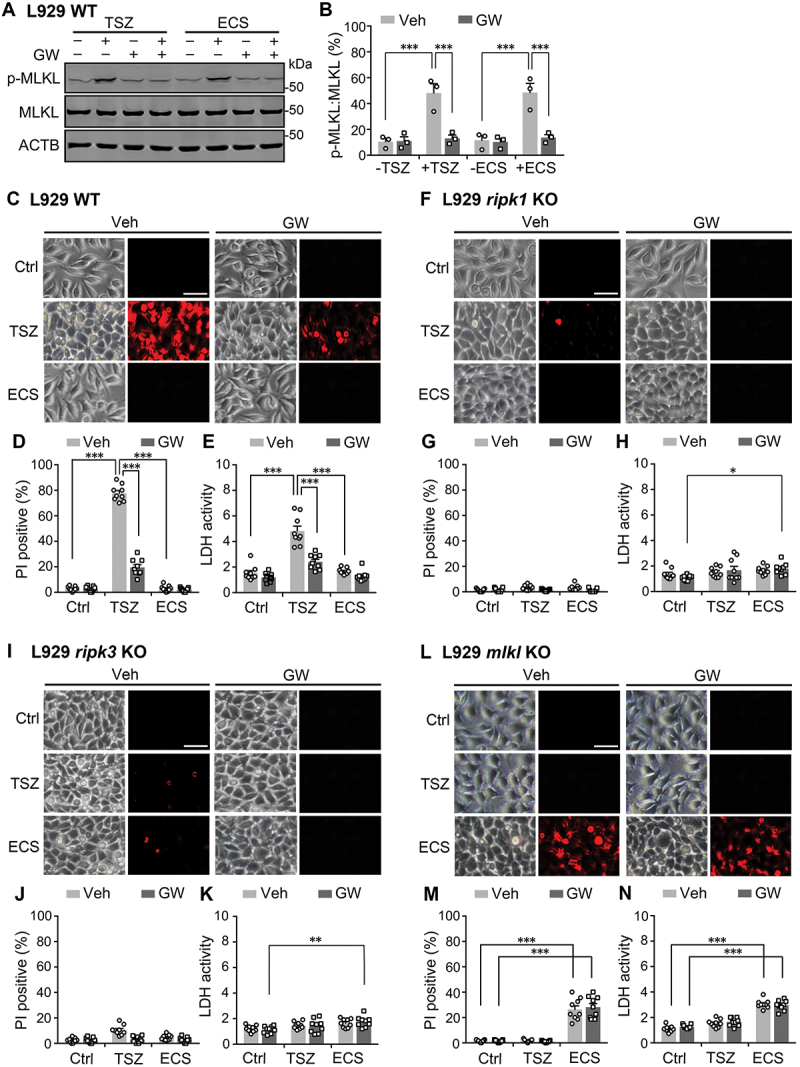
Starvation-induced MLKL phosphorylation does not cause cell death. (A) Western blots for levels of p-MLKL and MLKL in wild type (WT) L929 cells untreated or treated with either TSZ for 6 h or ECS for 3 h. GW806742X (GW, 1 µM) was included in some samples as indicated 0.5 h before and during the treatment. (B) p-MLKL:MLKL ratios for conditions shown in (A). Individual data points and means ± SEM of n = 3 experiments are shown. Veh, vehicle control for GW. *** P < 0.001. (C) Representative phase-contrast and fluorescence images of WT L929 cells untreated (Ctrl) or treated with either TSZ or ECS as in (A). After the treatment, cells were cultured for 6 h in normal culture medium and then stained with propidium iodide (PI) to label necrotic cells (red). Scale bar: 50 µm. (D) Percent of PI-positive L929 cells treated as in (C). Shown are individual data points and means ± SEM of n = 9 fields of view from 3 independent experiments, each with 3 fields. *** P < 0.001. (E) Lactate dehydrogenase (LDH) activity (mU/ml) measured from cells treated as in (C), except no PI staining was performed. Shown are individual data points and means ± SEM of n = 9 experiments. *** P < 0.001. (F-H) Similar to (C-E), but with the use of ripk1 KO L929 cells. * P < 0.05. (I-K) Similar to (C-E), but with the use of ripk3 KO L929 cells. ** P < 0.01. (L-N) Similar to (C-E), but with the use of mlkl KO L929 cells. *** P < 0.001. Note, in the absence of MLKL, starvation increased cell death and the effect was not blocked by GW806742X.
Using the KO cell lines, we showed that the loss of RIPK1, RIPK3, or MLKL from L929 cells abolished the ability of TSZ to induce cell death (Figure 9F-N), consistent with the critical involvement of the RIPK1-RIPK3-MLKL pathway in necroptotic death. Interestingly, however, whereas the KO of ripk1 or ripk3 did not affect cell survival under ECS-treated conditions (Figure 9F-K), that of mlkl from L929 cells increased cell death in response to starvation (Figure 9L-N). In line with the loss of MLKL, the starvation-induced death of L929 mlkl KO cells was insensitive to the MLKL inhibitor, GW806742X, indicating that it represents an MLKL-independent death pathway. This result also validates the specificity of GW806742X in blocking MLKL-mediated cell death. Interestingly, in the absence of RIPK1 or RIPK3, the addition of GW806742X also led to a small, but nevertheless detectable, increase in starvation-induced cell death when assessed by the LDH assay (Figure 9Kand 9H). This subtle change may reflect the short-term consequence of MLKL inhibition on cell survival, which appears to be much weaker than the long-term loss of MLKL in the mlkl KO cells but still consistent with the idea that MLKL positively contributes to cell survival in response to starvation, especially in the absence of necroptosis.
The lack of ability of starvation to induce death was also confirmed in human (HT29) cells. In these cells, the treatment of TSZ (6 h, followed by 6 h in normal medium without TSZ) evoked robust cell death as shown by both PI staining (Fig. S9A and S9B) and LDH assay (Fig. S9C), and the effect was suppressed by necrosulfonamide (NSA, 1 µM), which specifically blocks the membrane targeting, but not phosphorylation, of human MLKL [1,3]. However, the treatment with ECS (3 h, followed by 6 h in normal culture medium) did not increase the death of HT29 cells at all when tested using both death assays (Fig. S9A-C), despite the comparable levels of MLKL phosphorylation induced by TSZ and ECS (Fig. S9D). Thus, in both mouse and human cells that endogenously express RIPK3, only necroptotic treatment causes cell death through MLKL phosphorylation; the starvation-evoked MLKL phosphorylation not only does not mediate cell death, but may protect cells from the starvation-induced damage.
To further evaluate the role of RIPK3 in cell viability in response to starvation, we examined N2a cells transfected with the cDNA for mCherry or mCherry-RIPK3. Cells were again treated with either TSZ (6 h) or ECS (1 h). Cell death was evaluated at 6 h after returning the cells to the normal culture medium by staining with SYTOX Blue, which labels dead cells with green fluorescence. The ratio of green (dead cells):red (transfected cells indicated by the mCherry) fluorescence indicates the proportion of damaged cells. While TSZ induced a marginal increase in the proportion of dead cells in mCherry-expressing cells, it robustly evoked death in cells that expressed mCherry-RIPK3 (Fig. S9E and S9F), consistent with the idea that necroptotic death is dependent on RIPK3. Moreover, like in the L929 cells, the TSZ-induced death was completely suppressed by inhibiting MLKL with GW806742X (Fig. S9E and S9F), supporting the critical involvement of MLKL in necroptosis, now even in cells that normally do not undergo this type of cell death because of the lack of RIPK3. By contrast, with the starvation treatment, cells did not die no matter if they expressed mCherry or mCherry-RIPK3, despite the robust increases in MLKL phosphorylation (Fig. S9G-J). Moreover, under starvation, the MLKL inhibitor only blocked MLKL phosphorylation (Fig. S9G and S9H), but exhibited no effect on cell survival (Fig. S9I and S9J).
Discussion
CAMK2 promotes MLKL phosphorylation in response to starvation, independently of RIPK3
MLKL has thus far been mainly studied in the context of necroptosis as a substrate of RIPK3 [3,4,39]. Several recent studies, however, found MLKL to also plays roles in vesicular trafficking, extracellular vesicle formation and autophagy [10–12,40,41]. Although the endosomal function of MLKL is not necessarily in conflict with its necroptotic action at the plasma membrane, it is not always dependent on RIPK3 [10,41]. Here, we provide the first evidence that both mouse and human MLKL’s are also phosphorylated in a Ca2+- and CAMK2-dependent manner at the same residue, S345 in mouse and S358 in human, known to be phosphorylated by RIPK3, and this occurs in response to short-term deprivation of serum and amino acids. Furthermore, unlike RIPK3-induced activation, the CAMK2-mediated MLKL phosphorylation does not mediate cell death, but instead, it exerts a positive role in autophagic flux by facilitating autolysosome formation and consequently the degradation of autophagosome cargoes.
We show that CAMK2 and RIPK3 represent two independent pathways that trigger MLKL phosphorylation. First, whereas inhibiting CAMK2 with pharmacological blockers or genetic disruption only abolished the starvation-induced MLKL phosphorylation, that of RIPK1 or RIPK3 only suppressed the necroptotic activation of MLKL. Second, while the CAMK2-mediated MLKL activation initiated within 0.5–1 h of serum and amino acid starvation and then dissipated within a few hours, the RIPK3-mediated MLKL phosphorylation begins to appear within 3–6 h after the addition of TSZ and lasts for at least 12 h [3,42–44]. Third, the CAMK2-mediated MLKL activation facilitates autophagic flux, as revealed by the dependence on both MLKL and CAMK2 of the starvation-induced acceleration of autophagosome-lysosome fusion and degradation of LC3-II and SQSTM1. This contrasts to MLKL activation by RIPK3 through the necroptosis stimuli, which suppresses autophagic flux. Finally, in contrast to its well-known function in necroptotic death, MLKL appeared to be pro-survival under starvation, as shown by the increased death of mlkl KO cells subject to serum and amino acid starvation. Therefore, depending on how it is activated, MLKL exerts opposite functions on cell fate, with the CAMK2-MLKL link being supportive of survival under nutrient-deprived conditions and the RIPK1-RIPK3-MLKL pathway utilized to trigger cell death in necroptosis.
Our results comparing MLKL activation by ECS and TSZ treatment clearly indicate that whereas starvation accelerates autophagic flux, the necroptotic stimuli suppress it. The latter effect may be explained by the recent finding that TNF-induced necroptosis inhibits autophagosome-lysosome fusion by destabilizing SNARE complexes through the cleavage of STX17 (syntaxin 17) [45]. This also explains the reported inhibitory effect of MLKL on autophagic flux during necroptosis in mouse dermal fibroblasts and human HT29 cells [11] and lipotoxicity to hepatocytes [41]. Under stress conditions such as necroptosis [11] and high-fat-induced endoplasmic reticulum stress [41], MLKL likely switches its function from facilitating autophagic flux to inhibiting it. Notably, in experiments comparing HBSS-induced autophagic flux between wild type and mlkl−/- mouse dermal fibroblasts, the starvation time was quite long (6 and 16 h) and the measurement was made using flow cytometry [11]. These bring two possibilities: 1) a significantly more cell death in mlkl−/- cells than wild type which may alter the distribution of LC3 and their pH environment, and 2) a lack of distinction between nonlipidated LC3-I and lipidated LC3-II. In microscopic studies, the LC3 puncta represent mainly the latter. Thus, differences in the experimental conditions, detection and quantification methods, as well as the cell types used, may have all contributed to the different outcomes in our study and that by others [11,41].
CAMK2D has been reported to exist in the necrosome complex and serve as a substrate of RIPK3 [46,47]. As such, CAMK2 can be activated downstream from RIPK3 and this may explain why the presence of RIPK3 caused faster and longer-lasting MLKL phosphorylation upon starvation. However, it remains to be determined whether CAMK2D also contributes to starvation-induced MLKL activation. We focused on CAMK2A in the current study because siRNA knockdown of CAMK2A abolished the starvation-induced MLKL phosphorylation and recombinant CAMK2A not only interacted with MLKL but also supported its phosphorylation. However, the protein size detected by the anti-p-CAMK2 antibody, which likely recognizes all CAMK2 isoforms, matches that of CAMK2A and CAMK2D, which are both broadly distributed [48]. CAMK2D has been demonstrated to mediate RIPK1-independent cell death, downstream from RIPK3, through opening the mitochondrial permeability transition pore and dissipating mitochondrial membrane potential [46,47]. Whether CAMK2A carries a similar function is unclear. Therefore, the involvement of different CAMK2 isoforms in starvation- and RIPK3-dependent pathways needs further investigation.
The roles of Ca2+ and Ca2+/calmodulin-dependent kinases in various steps of autophagy are well recognized [14–17,49]. In addition to phosphorylation, oxidation of methionine residues, M281/282, also causes CAMK2 activation [47]. It remains to be determined whether oxidation also plays a part in CAMK2 activation during starvation-induced autophagy, which is typically accompanied with ROS production [50,51]. Recently, CAMK2A was found to be activated in cultured osteosarcoma cells by ROS after exposure to fullerene C60 nanocrystals, and this activation protected cells from oxidative damage by facilitating autophagic flux [17]. Plausibly, both Ca2+/CALM (calmodulin), via phosphorylation, and ROS, via oxidation, are involved in CAMK2 activation in response to serum and amino acid depletion, which in turn leads to MLKL phosphorylation. Also, the finding that CAMK2 and MLKL activation was elicited by starvation independently of RIPK3 does not rule out the possibility that when present, RIPK3 also contributes, at least partially, to CAMK2 activation, especially given the ability of RIPK3 to support ROS production under stressed conditions [47]. However, our data suggest that starvation for up to 24 h does not markedly increase RIPK3 phosphorylation from its basal levels in L929 and HT29 cells. Most likely, autophagy suppresses RIPK1-RIPK3, as RIPK1 is phosphorylated at S357 by ULK1, which suppresses its necroptotic signaling [52], and selective autophagy promotes the turnover of RIPK1 and RIPK3 [53]. Therefore, the functional significance of RIPK3 in the starvation-evoked MLKL activation, as well as the interplay between necroptosis and autophagy, warrant further investigation.
CAMK2-mediated MLKL phosphorylation promotes vesicular trafficking, not cell death
We found no evidence of cell death and no effect of MLKL inhibition, or changes in RIPK1 or RIPK3 expression, on cell survival after the short-term starvation. Only when MLKL was completely deleted did the ECS treatment induce cell death, demonstrating the presence of a necroptosis-independent cytotoxic pathway that responds to starvation but is normally suppressed by MLKL. The nature of this pathway is not known, but it may be related to the noncanonical CASP8 (caspase-8)-dependent apoptosis that was recently shown to occur when phagophore closure was disrupted by the deletion of CHMP2A, a component of ESCRT-III [54] or TNFSF10/TRAIL-induced cell death accelerated by MLKL-deficiency [55]. The emergence of this cytotoxic pathway may require time and/or long-term disruption of MLKL, as in ripk1 KO and ripk3 KO L929 cells, the inhibition of MLKL by GW806742X for a few hours only resulted in marginal ECS-induced cell death detected by the LDH assay, but not PI staining. Interestingly, long-term (>12 h) inhibition of CAMK2A also led to death of osteosarcoma cells, an effect further aggravated by inducing autophagy with nanocrystals [17]. The strong accumulation of autophagosomes following CAMK2 inhibition is also consistent with our findings [17]. Thus, instead of mediating cell death as in the case of necroptotic stimulation, the starvation-evoked CAMK2-mediated MLKL activation is actually protective against cell death and this may be accomplished by facilitating autophagic flux.
The role of MLKL in endosomal trafficking has been suggested by a number of recent studies [10,40,41]. MLKL is found to be associated with endosomes, including early and late endosomes, autophagosomes, as well as intraluminal vesicles and peripheral membranes of multivesicular bodies; deletion of MLKL impaired endocytic uptake and degradation of TNF and EGF (epidermal growth factor), as well as their receptors [10], while causing lipid accumulation in cells [40]. MLKL was also found on phagophore membranes in complex with pro-apoptotic or necroptotic proteins (FADD, RIPK1, RIPK3, and CASP8) and autophagy proteins (ATG5, ATG7, and SQSTM1) in HIV-1-infected macrophages treated with SMAC mimetics that induce autophagy-dependent apoptosis [56]. More importantly, a RIPK3-independent function for MLKL in intraluminal vesicle formation and subsequent extracellular vesicle release has been postulated to involve a role in membrane budding into the luminal side of endosomes and multivesicular bodies [10]. This action requires MLKL association with ESCRT complexes [10,13], membrane-scission machineries that function in sorting cargo proteins into intraluminal vesicles and many other aspects of vesicular trafficking [57–59].
Topologically, the autophagosome resembles a multivesicular body with a single intraluminal vesicle [60]. As in intraluminal vesicle scission, the ESCRT complexes are reported to perform similar functions in phagophore closure [36,59,61,62], a critical final step of autophagosome maturation that involves sealing the opening ends of the expanded phagophore for the separation of inner and outer membranes of the autophagosome [63]. As a part of the concerted action of the ESCRT-III complex, MLKL may also participate in phagophore closure. Importantly, the failure to seal off the newly formed autophagosome severely impairs autophagic flux [61,64], similarly as we observed in cells with MLKL inhibited by its inhibitors or genetic disruption. Therefore, we speculate that MLKL may facilitate autophagic flux by supporting autophagosome maturation during ESCRT-mediated membrane scission that separates the inner and outer autophagosome membranes, a step crucial for functional autolysosome formation and the proper degradation of autophagosomal cargoes.
In summary, we show here that MLKL is not just a substrate of RIPK3 involved in necroptotic death. Instead, the pseudokinase is transiently phosphorylated by CAMK2 in response to serum and amino acid deprivation during early hours and it serves to facilitate autophagic flux that allows accelerated degradation of autophagosome contents. This likely occurs through facilitating endomembrane scission required at various steps of endocytic and autophagic pathways. These previously unrecognized regulation and function will undoubtedly reshape the current thinking about MLKL and its roles in cell survival, signaling and metabolism.
Materials and Methods
Cell lines and cDNA constructs
Cell lines were from the following sources: mouse fibroblast L929 (MilliporeSigma, 14,112,101), mouse neuroblastoma Neuro-2a (N2a; American Type Culture Collection [ATCC], CCL-131), HEK293 (ATCC, CRL-1573), and HT29 (ATCC, HTB-38). All cells were maintained in normal culture medium: Dulbeco’s modified Eagle’s medium (DMEM, high glucose; ThermoFisher Scientific, 11,965,092) supplemented with 10% fetal bovine serum (FBS; GenDepot, 0610–050, or ThermoFisher Scientific, 16,140,071), 100 units/ml penicillin and 100 μg/ml streptomycin (GenDepot, CA004-025 or MedChemExpress LLC, HY-B0472), at 37°C, 5% CO2. ripk1 KO, ripk3 KO and mlkl KO L929 cells were kindly provided by Dr. Jiahuai Han (Xiamen University). These cell lines were generated using TALEN method as previously described [21,22]. The KO cells were confirmed by the sequencing of targeted loci and immunoblotting of the expression of respective proteins.
Expression plasmids for GFP-tagged mouse RIPK3 (GFP-RIPK3) and HA-tagged mouse MLKL (HA-MLKL) were generous gifts from Dr. Jiahuai Han (Xiamen University). Expression plasmid for GFP-C1-CAMK2A/CAMKIIα (rat) was from Addgene (21,226; deposited by Tobias Meyer). FLAG-tagged rat CAMK2A (FLAG-CAMK2A) was constructed by replacing the GFP-coding sequence with that of the FLAG tag. mCherry-RIPK3 expression plasmid was made by transferring the coding sequence of mouse RIPK3 from GFP-RIPK3 to the pCDH-CMV vector (Addgene, 72,265; deposited by Kazuhiro Oka). mCherry was used as vector control for all experiments that used mCherry-RIPK3. FUGW-PK-hLC3 vector for the expression of pHluorin-mKate2-human LC3 [38] was obtained from Addgene (61,460, a gift from Isei Tanida).
For transient expression, cells seeded in wells of 6-well plate were transfected with the desired plasmids using Lipofectamine 2000 (ThermoFisher Scientific, 11,668,027) following the protocol recommended by the manufacturer and used for experiments after 16–24 h. For FUGW-PK-hLC3, cells were seeded in poly-ornithine (MilliporeSigma, P3655) coated 12-mm glass coverslips placed in wells of 24-well plates, transfected using Lipofectamine 2000, and used 24 h later for experiments. For small hairpin RNA (shRNA)-mediated knockdown, the plasmid containing shRNA for mouse Mlkl was purchased from MilliporeSigma (SHCLND-NM_029005). The sequence targeted is AGATCCAGTTCAACGATATAT. An shRNA plasmid with a random target sequence of CCTAAGGTTAAGTCGCCCTCG in pLKO.1 vector (MilliporeSigma, SHC016) was used as the negative control. Transfection was carried out using Lipofectamine 2000 and cells were used after 2 d. For small interference RNA (siRNA)-mediated knockdown, three siRNA’s for mouse (rat) CAMK2A (si-m [r]-Camk2a_001, si-m [r]-Camk2a_002, si-m [r]-Camk2a_003) were purchased from RiboBio Co. Transfection was carried out using Lipofectamine 2000 and cells were used after 24 h. The efficiency of knockdown was assessed by western blotting.
Pharmacological reagents and primary antibodies
The following reagents were used: GW806742X (MedChemExpress LLC, HY112292), necrosulfonamide (NSA; MedChemExpress LLC, HY100573), necrostatin-1 (Nec-1; MedChemExpress LLC, HY15760), bafilomycin A1 (MedChemExpress LLC, HY100558), GSK’872 (Selleck Chemicals, S8465), CHIR99021 (Selleck Chemicals, S1263), KN62 (Selleck Chemicals, S7422), KN93 (Selleck Chemicals, S7423), SB216763 (Selleck Chemicals, S1075), Torin-1 (Selleck Chemicals, S2827), TNF (mouse-specific; APExBIO, P1002), human TNF (human-specific; APExBIO, P1001), dimeric Smac mimetic (AZD 5582 dihydrochloride; Tocris Bioscience, 5141), z-VAD (APExBIO, A1902), CALM/calmodulin (bovine brain; MilliporeSigma, 208,694, LOT: 3,433,002), CAMK2A (rat recombinant; MilliporeSigma, 208,706, LOT: 3,445,252).
The primary antibodies were from the following sources with dilutions indicated: rabbit anti-phospho-MLKL (S345, mouse specific; Abcam, 196,436; 1:1000), rabbit anti-phospho-RIPK3 (Ser227, human specific; Abcam, 209,384; 1:1000), mouse anti-HA (Abmart, M20003; 1:1000), mouse anti-RIPK1 (BD Biosciences, 610,459; 1:1000), rabbit anti-CAMK2A (Cell Signaling Technology, 11,945; 1:1000), rabbit anti-HA (Cell Signaling Technology, 3724; 1:1000), rabbit anti-human MLKL (Cell Signaling Technology, 14,993; 1:1000), rabbit anti-LC3 (Cell Signaling Technology, 12,741; 1:1000), rabbit anti-human RIPK3 (Cell Signaling Technology, 13,526; 1:1000), rabbit anti-mouse MLKL (Cell Signaling Technology, 37,705; 1:1000), rabbit anti-mouse RIPK3 (Cell Signaling Technology, 95,702; 1:1000), rabbit anti-RPS6KB/p70S6k (Cell Signaling Technology, 2708; 1:1000), rabbit anti-phospho-CAMK2A (T286; Cell Signaling Technology, 12,716; 1:1000), rabbit anti-phospho-GSK3B (Ser9; Cell Signaling Technology, 9336; 1:1000), rabbit anti-phospho-MLKL (S345, mouse specific; Cell Signaling Technology, 37,333; 1:1000), rabbit anti-phospho-MLKL (S358, human specific; Cell Signaling Technology, 91,689; 1:1000), rabbit anti-phospho-RPS6KB1/p70S6k (T389; Cell Signaling Technology, 9234; 1:1000), rabbit anti-SQSTM1/p62 (Cell Signaling Technology, 5114; 1:1000), rabbit anti-phospho-RIPK3 (Thr231/Ser232, mouse specific; Cell Signaling Technology, 195,117; 1:1000), mouse anti-FLAG (MilliporeSigma, F1804; 1:1000), rabbit anti-FLAG (MilliporeSigma, SAB4301135; 1:1000), mouse anti-phospho-MLKL (S345, mouse specific; MilliporeSigma, MABC1158; 1:1000), mouse anti-ACTB/β-actin (Santa Cruz Biotechnology, 47,778; 1:5000), mouse anti-SQSTM1/p62 (Santa Cruz Biotechnology, 48,402; 1:1000), mouse anti-CAMK2A (ThermoFisher Scientific, 13–7300; 1:1000).
Starvation treatment and necroptosis stimulation
Extracellular solution (ECS) contained (in mM) 140 NaCl, 2 CaCl2, 5 KCl, 1 MgCl2, 10 glucose (MilliporeSigma, G7021), 10 HEPES (Fisher Scientific, BP310), with pH adjusted to 7.4 by NaOH. Prior to the experiments, pH values of both ECS and normal culture medium were evaluated, and readjusted to 7.4, if necessary. When indicated, in some experiments, HBSS (with Mg2+ and Ca2+) (ThermoFisher Scientific, 14,025,092) was used in place of ECS. The culture medium was replaced with fresh normal culture medium 1 h prior to experimentation. Cells were rapidly washed once with ECS (or HBSS) at room temperature (22–24°C) and then incubated in ECS (or HBSS) for 0.1 to 24 h, as indicated in figures or legends, in the regular cell culture incubator with 5% CO2 at 37°C. Unstarved (fed) controls were continuously maintained in the normal culture medium. For cells with nutrient replenishment (refeed), at the end of the starvation, ECS was replaced with fresh normal culture medium and cells continuously cultured at 37°C, 5% CO2, until use. For drug treatment, cells were pre-incubated with the drug for 30 min in the normal culture medium and then in ECS with the same drug concentration for the desired time period. For TSZ treatment, the drug cocktail was added without preincubation. Vehicles are DMSO (< 0.3%). For experiments that involved incubation in the normal culture medium after the starvation or TSZ treatment, no drug was included.
Western blotting
After one wash with ice-cold phosphate-buffered saline (PBS; ThermoFisher Scientific, 10,010,049), cells were lysed in an ice-cold lysis buffer containing 20 mM Tris-Cl, pH 7.4, 150 mM NaCl, 1% Triton X-100 (ThermoFisher Scientific, BP151-500), 1 mM EDTA, 3 mM NaF, 1 mM beta-glycerophosphate (MilliporeSigma, G9891), 1 mM sodium orthovanadate (MilliporeSigma, S-6508), 2 mM N-ethylmaleimide (Chem Impex International, 00142), 10% glycerol (Fisher Scientific, B229), protease inhibitors (MilliporeSigma, 11,697,498,001) and phosphatase inhibitors (MilliporeSigma, P0044). The samples were placed on ice for 15 min, sonicated at 0°C for 10 s, and placed on ice for another 15 min before centrifugation at 13,000 x g in a microcentrifuge at 4°C for 15 min. To the supernatant was added the SDS sample buffer (1X: 50 mM Tris-Cl, 2% SDS, 6% glycerol, 1% beta-mercaptoethanol [Fisher Scientific, BP176], 0.004% bromophenol blue, pH 6.8). After heating at 95°C for 10 min, protein samples were separated by SDS-PAGE and transferred to nitrocellulose membrane (LiCOR Biotechnology, 926–31,092). After blocking in Tris-buffered saline (TBS; Sangon Biotech, B548105) containing 0.1% Tween-20 (Fisher Scientific, BP337-500; TBS-T) and 5% dry milk (Fisher Scientific, M0841) for 1 h, the membrane was incubated with the primary antibody diluted in TBS-T containing 5% bovine serum albumin (Sangon Biotech, A602440) at 4°C overnight. After washing 3 times with TBS-T, the membrane was incubated with Dylight 680- and Dylight 800-conjugated secondary antibodies (1:10,000; ThermoFisher Scientific, A32734 and A32730, respectively) diluted in TBS-T containing 1% dry milk for 1 h at room temperature. After extensive washes with TBS-T, the blots were visualized and digitally imaged using an Odyssey® CLx imaging system (LI-COR Biotechnology, Lincoln, NE).
For some experiments, cells were collected in ice-cold RIPA buffer (Beyotime, P0013 C) supplemented with phenylmethylsulfonyl fluoride (PMSF; Beyotime, ST506) and phosphatase inhibitors (MilliporeSigma, P0044). Protein samples were separated by SDS-PAGE and transferred to PVDF membrane (MilliporeSigma, IPVH00010). For non-reducing gels, the sample buffer contained (final concentration) 50 mM Tris-Cl, 6% glycerol, 0.004% bromophenol blue, pH 6.8. SDS was omitted from the standard acrylamide solution for gel making. After incubation with the primary antibody and washing as described above, the membrane was incubated with horseradish peroxidase (HRP)-conjugated mouse or rabbit secondary antibodies (1:10,000, Beyotime, A0216 or A0208, respectively) diluted in TBS-T containing 1% dry milk for 1 h at room temperature. After extensive washes with TBS-T and addition of enhanced chemiluminescent substrate (Beyotime, P0018M), the blots were visualized and digitally imaged using an Odyssey® Fc imaging system (LI-COR Biotechnology, Lincoln, NE).
Co-immunoprecipitation
The re-suspended lysates of N2a cells or N2a cells cotransfected with HA-MLKL and FLAG-CAMK2A were incubated on ice for 30 min and centrifuged at 13,000 x g for 15 min at 4°C to discard the pellet. The desired primary antibody (2 μg) was added to the samples and incubated at 4°C overnight. On the next day, protein A/G Sepharose beads (Abcam, 193,262) were added to the samples and the mixture incubated at 4°C for 3 h. After the incubation, the beads were washed three times with the lysis buffer and then boiled in 1X SDS sample buffer for 5 min. The beads were then spun down and the supernatants subject to SDS-PAGE and western blotting.
In vitro kinase assay for CAMK2A
At 24 h after the transfection with HA-MLKL, N2a cells were treated with ECS for 1 h before cell lysis. The lysates were incubated on ice for 30 min and centrifuged at 13,000 x g for 15 min at 4°C to discard the pellet. An aliquot of the supernatant was saved for input. The rest of the supernatant was subjected to IP as described above using the rabbit anti-HA antibody (2 μg). The washed IP products, including the Sepharose beads, were transferred to the kinase buffer (50 mM HEPES-KOH, 150 mM NaCl, 10 mM MgCl2, 0.1 mM CaCl2, 10% glycerol) with one additional wash. For a 20 μl reaction, 16 μl kinase buffer (with addition of 10 mM dithiothreitol, DTT), 1 μg CALM (calmodulin), 1 U purified CAMK2A, and 2 μl ATP (MilliporeSigma, 987–65-5, 1 mM in the kinase buffer) were added as desired to the HA-MLKL-containing beads. The samples were incubated at 25°C for 15 min and then heated at 65°C for 5 min in 1X SDS sample buffer containing 2% beta-mercaptoethanol to stop the reaction. The beads were then spun down and the supernatants subject to SDS-PAGE and western blotting for p-MLKL.
Cell death assays
Cell death was measured by staining with propidium iodide (PI; ThermoFisher Scientific, P3566) or SYTOX Blue (ThermoFisher Scientific, S11348) or LDH (lactate dehydrogenase) assay. Cells were cultured in wells of 6-well plates and treated with ECS for 1 or 3 h or with TSZ for 6 h. When needed, GW806742X (for mouse cells) or NSA (for human cells) was added to cells in the normal culture medium 30 min before the ECS or TSZ treatment and present throughout the treatment. After the treatment, cells were returned to the normal culture medium for 6 h before cell death was determined. For PI staining, PI was added to the medium at the final concentration of 2 μM and incubated with the cells for 10 min. The cells were washed with dye-free PBS and fixed in 4% paraformaldehyde in PBS for 10 min before imaging on an Olympus IX81 fluorescence microscope equipped with a CCD camera. Red labels represent the dead cells. For SYTOX Blue staining, N2a cells transfected with mCherry or mCherry-RIPK3 and treated with ECS or TSZ were incubated with 0.5 μM SYTOX Blue for 10 min. The cells were washed with PBS and fixed in 4% paraformaldehyde in PBS for 10 min and then examined by imaging with the fluorescence microscope. Green labels represent dead cells. LDH activity was measured using the LDH assay kit (Abcam, ab102526) according to the manufacturer’s instructions. After the reaction, LDH activity was read at 450 nm using a microplate reader in kinetic mode every 2–3 min for at least 30–60 min.
Confocal fluorescence imaging
N2a and L929 cells seeded on glass coverslips and transfected with the FUGW-PK-hLC3 plasmid were untreated or treated with either ECS (1 h for N2a cells, 3 h for L929 cells), HBSS (6 or 16 h for wild type and mlkl KO L929 cells), or with TSZ (6 h). After treatment, cells were fixed with 4% paraformaldehyde in PBS for 10 min and then washed with PBS. After mounting, fluorescence images were taken using a Leica confocal microscope with either a 40x or a 63x objective. LC3 puncta are defined as discrete, pointed or ellipse-shaped (diameter <3 µm), fluorescent signals above the surrounding background within the cell boundary. Puncta counting was performed manually in a blinded fashion. For each cell, 40–80 clearly distinguishable discrete puncta were randomly selected from the red channel as regions of interest (ROIs) and the presence of green fluorescence in the individual ROIs was then evaluated to determine whether the ROI was Red+Green or Red only. % Red-only puncta was calculated using the formula: 100*(Red-only ROI/total ROI).
Statistical analysis
Summary data are presented as means ± standard error of the mean (SEM) and analyzed by Prism software (GraphPad Software, Inc., San Diego, CA). Comparisons among experimental groups were made by one-way or two-way analysis of variance (ANOVA) with Tukey’s multiple comparison test, unless indicated otherwise, with P < 0.05 being considered as statistically significant.
Supplementary Material
Acknowledgments
We thank other members of the Zhu lab for helpful discussion of the project, Ms. Hyun-Jung Jung for technical assistance, and Profs. Kartik Venkatachalam (University of Texas Health Science Center at Houston) and Jiahuai Han (Xiamen University) for providing expression plasmids. pCDH-CMV was a gift from Kazuhiro Oka (Addgene plasmid # 72265; http://n2t.net/addgene:72265; RRID:Addgene_72265); FUGW-PK-hLC3 was a gift from Isei Tanida (Addgene plasmid # 61460; http://n2t.net/addgene:61460; RRID:Addgene_61460); GFP-C1-CAMK2A was a gift from Tobias Meyer (Addgene plasmid # 21226; http://n2t.net/addgene:21226; RRID:Addgene_21226).
Funding Statement
This work was supported in part by grants from National Institute of Neurological Disorders and Stroke (NS102452 and NS114716 to MXZ), American Heart Association (15GRNT23040032 to MXZ, 17POST33661282 to QW, and 19TPA34910051 to GD), and National Natural Science Foundation of China (81700071 to QZ; 81961128024 to TLX), Natural Science Foundation of Jiangsu Province (BK20191171 to FHJ) and Clinical Trial Capacity Improvement Project (SLT201909 to FHJ);
Disclosure statement
No potential conflict of interest was reported by the author(s).
Supplementary material
Supplemental data for this article can be accessed here
References
- [1].Sun L, Wang H, Wang Z, et al. Mixed lineage kinase domain-like protein mediates necrosis signaling downstream of RIP3 kinase. Cell. 2012;148:213–227. [DOI] [PubMed] [Google Scholar]
- [2].Murphy JM, Czabotar PE, Hildebrand JM, et al. The pseudokinase MLKL mediates necroptosis via a molecular switch mechanism. Immunity. 2013;39:443–453. [DOI] [PubMed] [Google Scholar]
- [3].Wang H, Sun L, Su L, et al. Mixed lineage kinase domain-like protein MLKL causes necrotic membrane disruption upon phosphorylation by RIP3. Mol Cell. 2014;54:133–146. [DOI] [PubMed] [Google Scholar]
- [4].Dondelinger Y, Declercq W, Montessuit S, et al. MLKL compromises plasma membrane integrity by binding to phosphatidylinositol phosphates. Cell Rep. 2014;7:971–981. [DOI] [PubMed] [Google Scholar]
- [5].Tanzer MC, Matti I, Hildebrand JM, et al. Evolutionary divergence of the necroptosis effector MLKL. Cell Death Differ. 2016;23:1185–1197. [DOI] [PMC free article] [PubMed] [Google Scholar]
- [6].Petrie EJ, Sandow JJ, Jacobsen AV, et al. Conformational switching of the pseudokinase domain promotes human MLKL tetramerization and cell death by necroptosis. Nat Commun. 2018;9:2422. [DOI] [PMC free article] [PubMed] [Google Scholar]
- [7].Hildebrand JM, Tanzer MC, Lucet IS, et al. Activation of the pseudokinase MLKL unleashes the four-helix bundle domain to induce membrane localization and necroptotic cell death. Proc Natl Acad Sci U S A. 2014;111:15072–15077. [DOI] [PMC free article] [PubMed] [Google Scholar]
- [8].Rodriguez DA, Weinlich R, Brown S, et al. Characterization of RIPK3-mediated phosphorylation of the activation loop of MLKL during necroptosis. Cell Death Differ. 2016;23:76–88. [DOI] [PMC free article] [PubMed] [Google Scholar]
- [9].Yang Z, Wang Y, Zhang Y, et al. RIP3 targets pyruvate dehydrogenase complex to increase aerobic respiration in TNF-induced necroptosis. Nat Cell Biol. 2018;20:186–197. [DOI] [PubMed] [Google Scholar]
- [10].Yoon S, Kovalenko A, Bogdanov K, et al. MLKL, the protein that mediates necroptosis, also regulates endosomal trafficking and extracellular vesicle generation. Immunity. 2017;47:51–65 e7. [DOI] [PubMed] [Google Scholar]
- [11].Frank D, Vaux DL, Murphy JM, et al. Activated MLKL attenuates autophagy following its translocation to intracellular membranes. J Cell Sci. 2019;132:jcs220996. [DOI] [PubMed] [Google Scholar]
- [12].Guo F-X, Wu Q, Li P, et al. The role of the LncRNA-FA2H-2-MLKL pathway in atherosclerosis by regulation of autophagy flux and inflammation through mTOR-dependent signaling. Cell Death Differ. 2019;26(9):1670–1687. [DOI] [PMC free article] [PubMed] [Google Scholar]
- [13].Gong Y-N, Guy C, Olauson H, et al. ESCRT-III acts downstream of MLKL to regulate necroptotic cell death and its consequences. Cell. 2017;169(2):286–300 e16. [DOI] [PMC free article] [PubMed] [Google Scholar]
- [14].Hoyer-Hansen M, Bastholm L, Szyniarowski P, et al. Control of macroautophagy by calcium, calmodulin-dependent kinase Kinase-β, and Bcl-2. Mol Cell. 2007;25(2):193–205. [DOI] [PubMed] [Google Scholar]
- [15].Ghislat G, Patron M, Rizzuto R, et al. Withdrawal of essential amino acids increases autophagy by a pathway involving Ca2+ </sup>++/calmodulin-dependent kinase Kinase-β (CaMKK-β). J Biol Chem. 2012;287(46):38625–38636. [DOI] [PMC free article] [PubMed] [Google Scholar]
- [16].Engedal N, Torgersen ML, Guldvik IJ, et al. Modulation of intracellular calcium homeostasis blocks autophagosome formation. Autophagy. 2013;9(10):1475–1490. [DOI] [PubMed] [Google Scholar]
- [17].Xu J, Wang H, Hu Y, et al. Inhibition of CaMKIIα activity enhances antitumor effect of fullerene C60 nanocrystals by suppression of autophagic degradation. Adv Sci (Weinh). 2019;6(8):1801233. [DOI] [PMC free article] [PubMed] [Google Scholar]
- [18].Morgan MJ, Kim Y-S.. The serine threonine kinase RIP3: lost and found. BMB Reports. 2015;48(6):303–312. [DOI] [PMC free article] [PubMed] [Google Scholar]
- [19].Li L, Chen W, Liang Y, et al. The Gβγ-Src signaling pathway regulates TNF-induced necroptosis via control of necrosome translocation. Cell Res. 2014;24(4):417–432. [DOI] [PMC free article] [PubMed] [Google Scholar]
- [20].Remijsen Q, Goossens V, Grootjans S, et al. Depletion of RIPK3 or MLKL blocks TNF-driven necroptosis and switches towards a delayed RIPK1 kinase-dependent apoptosis. Cell Death Dis. 2014;5(1):e1004. [DOI] [PMC free article] [PubMed] [Google Scholar]
- [21].Chen W, Zhou Z, Li L, et al. Diverse sequence determinants control human and mouse receptor interacting protein 3 (RIP3) and mixed lineage kinase domain-like (MLKL) interaction in necroptotic signaling. J Biol Chem. 2013;288(23):16247–16261. [DOI] [PMC free article] [PubMed] [Google Scholar]
- [22].Chen X, Li W, Ren J, et al. Translocation of mixed lineage kinase domain-like protein to plasma membrane leads to necrotic cell death. Cell Res. 2014;24(1):105–121. [DOI] [PMC free article] [PubMed] [Google Scholar]
- [23].Huang Z, Wu S-Q, Liang Y, et al. RIP1/RIP3 binding to HSV-1 ICP6 initiates necroptosis to restrict virus propagation in mice. Cell Host Microbe. 2015;17(2):229–242. [DOI] [PubMed] [Google Scholar]
- [24].Zhang Y, Su SS, Zhao S, et al. RIP1 autophosphorylation is promoted by mitochondrial ROS and is essential for RIP3 recruitment into necrosome. Nat Commun. 2017;8(1):14329. [DOI] [PMC free article] [PubMed] [Google Scholar]
- [25].Davies KA, Fitzgibbon C, Young SN, et al. Distinct pseudokinase domain conformations underlie divergent activation mechanisms among vertebrate MLKL orthologues. Nat Commun. 2020;11(1):3060. [DOI] [PMC free article] [PubMed] [Google Scholar]
- [26].He S, Wang L, Miao L, et al. Receptor interacting protein kinase-3 determines cellular necrotic response to TNF-α. Cell. 2009;137(6):1100–1111. [DOI] [PubMed] [Google Scholar]
- [27].Choi S-W, Song J-K, Yim Y-S, et al. Glucose deprivation triggers protein kinase C-dependent β-catenin proteasomal degradation. J Biol Chem. 2013;39(15):443–453. [DOI] [PMC free article] [PubMed] [Google Scholar]
- [28].Hermida MA, Dinesh Kumar J, Leslie NR.. GSK3 and its interactions with the PI3K/AKT/mTOR signalling network. Adv Biol Regul. 2017;65:5–15. [DOI] [PubMed] [Google Scholar]
- [29].LeBoeuf B, Gruninger TR, Garcia LR. Food deprivation attenuates seizures through CaMKII and EAG K+ channels. PLoS Genet. 2007;3:1622–1632. [DOI] [PMC free article] [PubMed] [Google Scholar]
- [30].Li X, Wu XQ, Deng R, et al. CaMKII-mediated Beclin 1 phosphorylation regulates autophagy that promotes degradation of Id and neuroblastoma cell differentiation. Nat Commun. 2017;8:1159. [DOI] [PMC free article] [PubMed] [Google Scholar]
- [31].Rajan A, Housden BE, Wirtz-Peitz F, et al. A mechanism coupling systemic energy sensing to adipokine secretion. Dev Cell. 2017;43:83–98 e6. [DOI] [PMC free article] [PubMed] [Google Scholar]
- [32].Ruan HB, Ma Y, Torres S, et al. Calcium-dependent O-GlcNAc signaling drives liver autophagy in adaptation to starvation. Genes Dev. 2017;31:1655–1665. [DOI] [PMC free article] [PubMed] [Google Scholar]
- [33].Lin SY, Hsieh SY, Fan YT, et al. Necroptosis promotes autophagy-dependent upregulation of DAMP and results in immunosurveillance. Autophagy. 2018;14:778–795. [DOI] [PMC free article] [PubMed] [Google Scholar]
- [34].Lindqvist LM, Frank D, McArthur K, et al. Autophagy induced during apoptosis degrades mitochondria and inhibits type I interferon secretion. Cell Death Differ. 2018;25:784–796. [DOI] [PMC free article] [PubMed] [Google Scholar]
- [35].Sharma KB, Sharma M, Aggarwal S, et al. Quantitative proteome analysis of Atg5-deficient mouse embryonic fibroblasts reveals the range of the autophagy-modulated basal cellular proteome. mSystems. 2019;4:e00481–19. [DOI] [PMC free article] [PubMed] [Google Scholar]
- [36].Mauvezin C, Neufeld TP. Bafilomycin A1 disrupts autophagic flux by inhibiting both V-ATPase-dependent acidification and Ca-P60A/SERCA-dependent autophagosome-lysosome fusion. Autophagy. 2015;11:1437–1438. [DOI] [PMC free article] [PubMed] [Google Scholar]
- [37].Segala G, David M, De Medina P, et al. Dendrogenin A drives LXR to trigger lethal autophagy in cancers. Nat Commun. 2017;8:1903. [DOI] [PMC free article] [PubMed] [Google Scholar]
- [38].Tanida I, Ueno T, Uchiyama Y. A super-ecliptic, pHluorin-mKate2, tandem fluorescent protein-tagged human LC3 for the monitoring of mammalian autophagy. PLoS One. 2014;9:e110600. [DOI] [PMC free article] [PubMed] [Google Scholar]
- [39].Fan W, Guo J, Gao B, et al. Flotillin-mediated endocytosis and ALIX-syntenin-1-mediated exocytosis protect the cell membrane from damage caused by necroptosis. Sci Signal. 2019;12:eaaw3423. [DOI] [PubMed] [Google Scholar]
- [40].Rasheed A, Robichaud S, Nguyen MA, et al. Loss of MLKL (mixed lineage kinase domain-like protein) decreases necrotic core but increases macrophage lipid accumulation in atherosclerosis. Arterioscler Thromb Vasc Biol. 2020;40:1155–1167. [DOI] [PubMed] [Google Scholar]
- [41].Wu X, Poulsen KL, Sanz-Garcia C, et al. MLKL-dependent signaling regulates autophagic flux in a murine model of non-alcohol-associated fatty liver and steatohepatitis. J Hepatol. 2020;73:616–627. [DOI] [PMC free article] [PubMed] [Google Scholar]
- [42].Zhu K, Liang W, Ma Z, et al. Necroptosis promotes cell-autonomous activation of proinflammatory cytokine gene expression. Cell Death Dis. 2018;9:500. [DOI] [PMC free article] [PubMed] [Google Scholar]
- [43].Najafov A, Mookhtiar AK, Luu HS, et al. TAM Kinases Promote Necroptosis by Regulating Oligomerization of MLKL. Mol Cell. 2019;75:457–468.e4. [DOI] [PubMed] [Google Scholar]
- [44].Samson AL, Zhang Y, Geoghegan ND, et al. MLKL trafficking and accumulation at the plasma membrane control the kinetics and threshold for necroptosis. Nat Commun. 2020;11:3151. [DOI] [PMC free article] [PubMed] [Google Scholar]
- [45].Wu W, Wang X, Sun Y, et al. TNF-induced necroptosis initiates early autophagy events via RIPK3-dependent AMPK activation, but inhibits late autophagy. Autophagy. 2021;28:1–18. [DOI] [PMC free article] [PubMed] [Google Scholar]
- [46].Qu Y, Tang J, Wang H, et al. RIPK3 interactions with MLKL and CaMKII mediate oligodendrocytes death in the developing brain. Cell Death Dis. 2017;8:e2629–e2629. [DOI] [PMC free article] [PubMed] [Google Scholar] [Retracted]
- [47].Zhang T, Zhang Y, Cui M, et al. CaMKII is a RIP3 substrate mediating ischemia- and oxidative stress-induced myocardial necroptosis. Nat Med. 2016;22:175–182. [DOI] [PubMed] [Google Scholar]
- [48].Zalcman G, Federman N, Romano A. CaMKII isoforms in learning and memory: localization and function. Front Mol Neurosci. 2018;11:445. [DOI] [PMC free article] [PubMed] [Google Scholar]
- [49].Bootman MD, Chehab T, Bultynck G, et al. The regulation of autophagy by calcium signals: do we have a consensus? Cell Calcium. 2018;70:32–46. [DOI] [PubMed] [Google Scholar]
- [50].Scherz-Shouval R, Elazar Z. ROS, mitochondria and the regulation of autophagy. Trends Cell Biol. 2007;17:422–427. [DOI] [PubMed] [Google Scholar]
- [51].Li L, Chen Y, Gibson SB. Starvation-induced autophagy is regulated by mitochondrial reactive oxygen species leading to AMPK activation. Cell Signal. 2013;25:50–65. [DOI] [PubMed] [Google Scholar]
- [52].Wu W, Wang X, Berleth N, et al. The autophagy-initiating kinase ULK1 controls RIPK1-mediated cell death. Cell Rep. 2020;31:107547. [DOI] [PubMed] [Google Scholar]
- [53].Lim J, Park H, Heisler J, et al. Autophagy regulates inflammatory programmed cell death via turnover of RHIM-domain proteins. Elife. 2019;8:e44452. [DOI] [PMC free article] [PubMed] [Google Scholar]
- [54].Hattori T, Takahashi Y, Chen L, et al. Targeting the ESCRT-III component CHMP2A for noncanonical Caspase-8 activation on autophagosomal membranes. Cell Death Differ. 2021;28:657–670. [DOI] [PMC free article] [PubMed] [Google Scholar]
- [55].Park SY, Park HH, Park SY, et al. Reduction in MLKL-mediated endosomal trafficking enhances the TRAIL-DR4/5 signal to increase cancer cell death. Cell Death Dis. 2020;11:744. [DOI] [PMC free article] [PubMed] [Google Scholar]
- [56].Campbell GR, To RK, Zhang G, et al. SMAC mimetics induce autophagy-dependent apoptosis of HIV-1-infected macrophages. Cell Death Dis. 2020;11:590. [DOI] [PMC free article] [PubMed] [Google Scholar]
- [57].Williams RL, Urbé S. The emerging shape of the ESCRT machinery. Nat Rev Mol Cell Biol. 2007;8:355–368. [DOI] [PubMed] [Google Scholar]
- [58].Christ L, Raiborg C, Wenzel EM, et al. Cellular functions and molecular mechanisms of the ESCRT membrane-scission machinery. Trends Biochem Sci. 2017;42:42–56. [DOI] [PubMed] [Google Scholar]
- [59].Lefebvre C, Legouis R, Culetto E. ESCRT and autophagies: endosomal functions and beyond. Semin Cell Dev Biol. 2018;74:21–28. [DOI] [PubMed] [Google Scholar]
- [60].Nakatogawa H, Suzuki K, Kamada Y, et al. Dynamics and diversity in autophagy mechanisms: lessons from yeast. Nat Rev Mol Cell Biol. 2009;10:458–467. [DOI] [PubMed] [Google Scholar]
- [61].Takahashi Y, He H, Tang Z, et al. An autophagy assay reveals the ESCRT-III component CHMP2A as a regulator of phagophore closure. Nat Commun. 2018;9:2855. [DOI] [PMC free article] [PubMed] [Google Scholar]
- [62].Zhen Y, Spangenberg H, Munson MJ, et al. ESCRT-mediated phagophore sealing during mitophagy. Autophagy. 2020;16:826–841. [DOI] [PMC free article] [PubMed] [Google Scholar]
- [63].Yim WWY, Mizushima N. Lysosome Biology in Autophagy. Cell Discov. 2020;6:6. [DOI] [PMC free article] [PubMed] [Google Scholar]
- [64].Tsuboyama K, Koyama-Honda I, Sakamaki Y, et al. The ATG conjugation systems are important for degradation of the inner autophagosomal membrane. Science. 2016;354:1036–1041. [DOI] [PubMed] [Google Scholar]
Associated Data
This section collects any data citations, data availability statements, or supplementary materials included in this article.