

ABSTRACT
The drug-induced proliferation (DIP) rate is a metric of in vitro drug response that avoids inherent biases in commonly used metrics such as 72 h viability. However, DIP rate measurements rely on direct cell counting over time, a laborious task that is subject to numerous challenges, including the need to fluorescently label cells and automatically segment nuclei. Moreover, it is incredibly difficult to directly count cells and accurately measure DIP rates for cell populations in suspension. As an alternative, we use real-time luminescence measurements derived from the cellular activity of NAD(P)H oxidoreductase to efficiently estimate drug response in both adherent and suspension cell populations to a panel of known anticancer agents. For the adherent cell lines, we collect both luminescence reads and direct cell counts over time simultaneously to assess their congruency. Our results demonstrate that the proposed approach significantly speeds up data collection, avoids the need for cellular labels and image segmentation, and opens the door to significant advances in high-throughput screening of anticancer drugs.
KEYWORDS: DIP rate, continuous assay, cell viability, suspension cells, drug response, quantitative analysis, drug screening, real-time luminescence
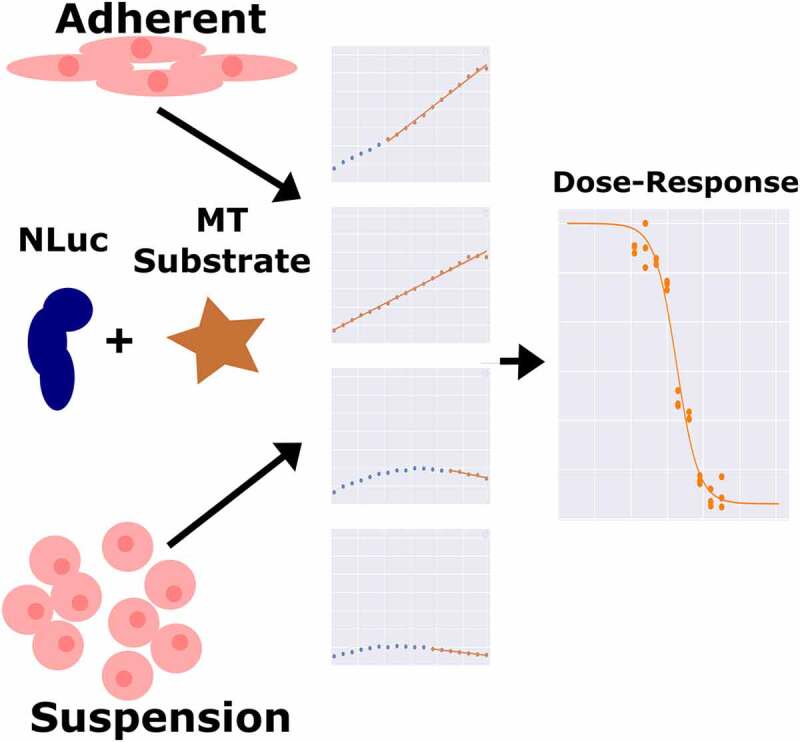
Graphical abstract
Introduction
Assessing cellular drug response across multiple cell lines and types is an integral component of modern cancer research. This is primarily done by taking a single cellular viability1 measurement before and after the addition of a drug across a range of concentrations in what is known as a “fixed-endpoint assay”. These measurements are then used to produce a dose–response curve to assess efficacy and potency. However, fixed endpoint assays contain a multitude of inherent biases such as the time delay effect (slow-acting drug bias), seeding density variability (T0), exponential growth vs. percent viability (ratio changes based on how far out the endpoint is taken), cellular growth rate dependence, and the lack of ability to produce negative values (minimum efficacy of zero) that can result in inaccurate determinations of both efficacy and potency in a variety of scenarios, potentially mischaracterizing both effective and ineffective treatments.1 A more robust alternative is to assess viability via a continuous metric. Continuous viability assays have gained substantial interest in the scientific community as they overcome the biases associated with a fixed endpoint and provide a more detailed representation of cellular drug response over time. Continuous viability assays are conducted by taking intermediate measurements across a given time interval, with short measurement intervals and extended time courses giving the most detailed information. While fixed-endpoint data yields a single number that can easily be used in dose–response curve generation, continuous assays generate multiple values, and thus require derivation to distill responses across a time period down to a single value. Assays such as EZ-MTT address this most simply by taking the slope of the dataset for dose–response curve generation, while alternative approaches such as the GR (growth inhibition rate) metrics and DIP rate address it by expressing each individual data series as a ratio of the basal response.1–3 Continuous assays also have their own experimental hurdles that have prevented widespread adoption of the platform, such as requiring a live cell fluorescent label (direct cell counting), inefficient cell segmentation algorithms, and an inability to work well with suspension cell lines (limited by imaging ability).
Recently, a new continuous luminescence-based viability assay has been developed that indirectly measures the cellular reductive capacity through metabolic conversion of a pro-substrate to substrate (Figure 1). The novel low-toxicity and membrane-permeable NanoLuc luciferase pro-substrate rapidly diffuses into cells and is converted to active substrate (furimazine) primarily by NAD(P)H oxidoreductase, a ubiquitous and established enzyme in the cellular metabolic process.4–12 Once the substrate is generated, binding to the luciferase and subsequent enzymatic cleavage produces luminescence. These luminescence values correlate well with cell counts in static measurements (Figure 2) suggesting that this system could also be used for continuous luminescence measurements as an alternative to obtaining proliferation rates by direct cell counting. This is especially promising for suspension cell cultures, where direct cell counting is often not a feasible option. Here, we show that by modifying and optimizing the commercial assay protocol for single reagent-addition, the continuous luminescence data can be used as an alternative for direct cell counting measurements. Briefly, by focusing on the rate of luminescence change in drugged cell conditions and normalizing to the basal rate of change in an undrugged population, the continuous luminescence data can be reduced to a single value, reflecting the expansion and contraction of the cell population in response to drug. This streamlines the quantification of the response to the level of a fixed-endpoint assay, while remaining continuous in origin.1,11,13,14 Furthermore, we addressed challenges in the data interpretation by developing a freely available open-source analytical process (coding algorithm). Overall, using continuous luminescence to measure cellular drug response allows quantification regardless of cells being in suspension or adherent culture.
Cellular viability is referred to herein as the amount of live, viable, cells within a well.
Figure 1.
Diagram of Real-Time Luminescence Dynamics. Pro-substrate added to the culture media is rapidly metabolized by live cells via intracellular reduction into active substrate. The active substrate then reacts with NanoLuc luciferase to produce light. Dead cells are not able to metabolize the pro-substrate and therefore do not contribute to the amount of active substrate produced and subsequent light generation within the assay.
Alt Text: A cartoon diagram depicting how the NanoLuc Real-Time luminescence assay works. There are two flowcharts moving from left to right, above and below each other. The upper flowchart depicts the dynamics of the assay with live cells and the lower flowchart depicts the dynamics with dead cells. Pro substrate is depicted as a red tear drop, substrate is depicted as a red triangle, NanoLuc luciferase is depicted as a blue circle with a wedge missing, cells are depicted as large circles, and light is depicted as a yellow sun.
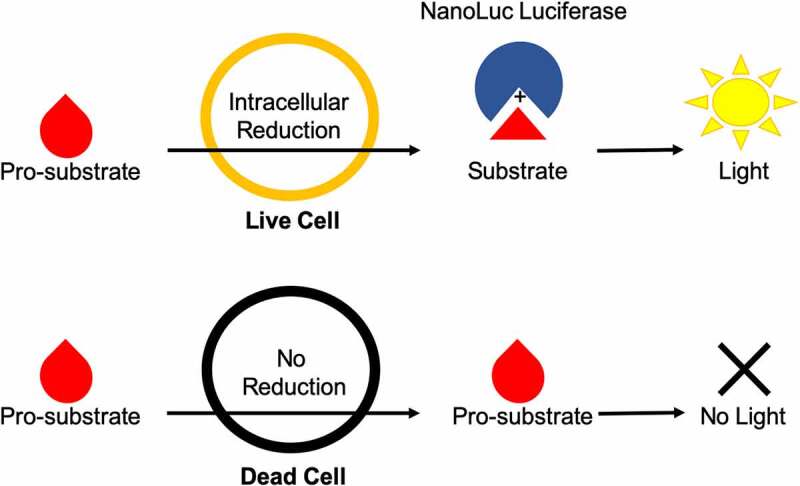
Figure 2.
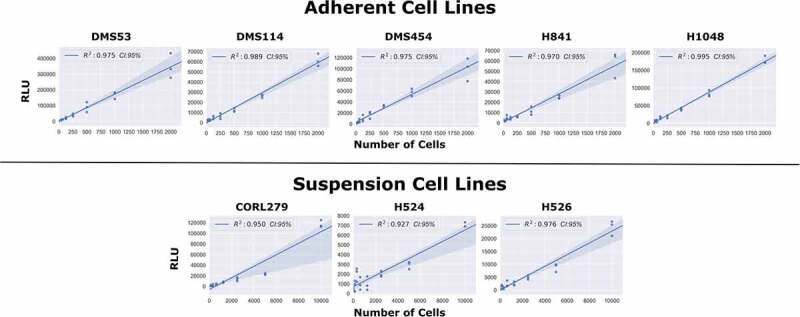
Comparison of Static Luminescent Signal and Cell Count. A range of cell lines were serially diluted by a factor of 2 from either 10,000 cells (suspension lines) or 2,000 cells (adherent lines). Assay reagents were then added to the wells and the plate was allowed to equilibrate for 1 hour. The luminescence measurements were then obtained, with the above graph showing the regression values among the static measurements of luminescence compared to varying cell seeding densities.
Alt Text: There are two rows of graphs where the Y-axis is RLU (Relative Luminescence Units) and the X-axis is number of cells. The top row is five adherent cell lines and the bottom row is three suspension cell lines. All of the graphs show a highly linearly correlated regression line with R2 values greater than 0.92 in all cases.
Results
Optimizing the commercial assay for single reagent-addition continuous experiments
In order to utilize the commercial NanoLuc luciferase assay for continuous experiments, we adjusted the supplied protocol. After testing of a variety of conditions addressing NanoLuc enzyme concentration, MT substrate (NanoLuc pro-substrate) concentration, solubilization temperature and duration, cell seeding density, and confluency of culture prior to experimentation (data not shown), the following tenets were obtained. First and foremost, the optimal reagent preparation was found to be 20 µL of both the NanoLuc enzyme (1000X supplied) and the MT substrate (1000X supplied) dissolved in to 25 mL of culture medium supplemented with 10% FBS (Fetal Bovine Serum). We found the solubility of the MT substrate specifically, to be highly dependent on temperature.
During optimization, it was observed that the assay was more sensitive to temperature fluctuations during reads than previously anticipated. In order to address this, travel time between the plate incubator and reader was reduced to a minimum, and an additional incubation delay within a pre-warmed reader was added. The resulting optimized protocol based on these findings is available at https://github.com/QuLab-VU/RT-Glow/tree/master/RT-Glo%20Paper.
Comparing luminescence to direct cell counts in proliferating cell populations
We first confirmed the relationship between luminescence signal and cell number by comparing luminescence readings and direct cell counts in cultured wells with predefined numbers of cells (Figure 2, and see Methods). To this end, we took luminescence reads across serially diluted cell concentrations after addition of assay reagents followed by 1 h of equilibration. These static, single time-point measurements revealed a strong linear correlation between luminescence signal intensity and cell number in five adherent and three suspension cell lines (Figure 2). These results suggested that it is possible to monitor cell proliferation via luminescence in continuous culture over time, as a substitute for the more laborious direct cell count sampling.
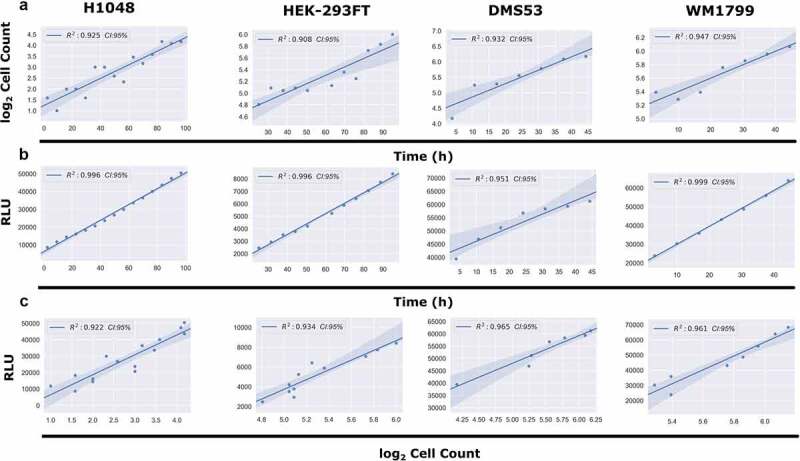
To test the feasibility of continuous luminescence as an alternative for direct cell counting, we cultured multiple adherent cell lines (see Methods) and took both luminescence and direct cell counts every 4 h for 100 h (Figure 3). Proliferation rates were then generated by taking the slope of both the raw luminescence and log transformed direct cell counting values and compared (Figure 3). The coefficient of determination (R2) between the two proliferation rates was found to be greater than 0.92 in each.
Figure 3.
Comparison of Continuous Luminescent Signal and Cell Counts Over Time. (A) Comparison of the log2 transformed cell counts over time in four adherent cell lines. Cell counts were log2 transformed in order to linearize the data for subsequent comparisons. (B) Comparison of the continuous luminescent signal over time for the same four adherent lines from panel A. (C) Comparison of the correlation between continuous luminescent signal and log2 transformed cell count over time using a best-fit linear regression model. All conditions show R2 correlation coefficients >0.92.
Alt Text: There are four columns of graphs for cell lines (H1048, HEK-293FT, DMS53, and WM1799). Each column is divided into three rows A, B, and C. Row A has graphs with a Y-axis of log2 cell count and an X-axis of time in hours. Each graph shows a best fit linear regression line for the two axes. Row B has graphs with a Y-axis of RLU (Relative Luminescence Units) and an X-axis of time in hours. Each graph shows a best fit linear regression line for the two axes. Row C has graphs with a Y-axis of RLU and an X-axis of log2 cell count. Each graph shows a best fit linear regression line for the two axes.
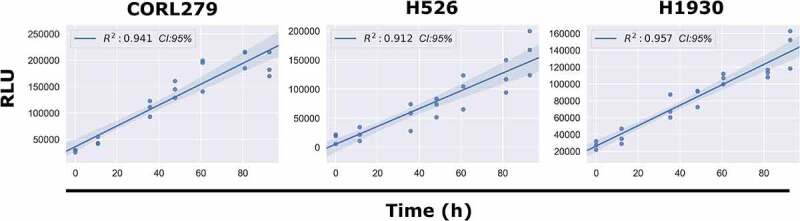
Next, we took continuous luminescence measurements on suspension cell lines, where direct cell counting is not available, to assess if their luminescence remained linear for the duration of the experiment. Since linearity of luminescence signal is a requirement for straightforward analysis of continuous luminescence measurements (taking the slope) it was necessary to confirm this prior to using it as a metric for cell proliferation (see Methods, Determining Linear Assay Range). All three of the suspension lines tested (CORL279, H526, H1930) satisfied this requirement (Figure 4). Taken together, these results from both adherent and suspension cell cultures indicate that continuous luminescent measurements are a viable alternative to direct cell counting to assess cell proliferation over time.
Figure 4.
Continuous Luminescence of Suspension Cell Lines. A best-fit linear regression model of continuous luminescence in all suspension cell lines tested shows that minimum luminescent linearity requirements (R2 >0.90) are met. Real-time luminescent signal maintains a sufficient linearity for the duration of the assay.
Alt Text: There is a single row of three graphs with RLU (Relative Luminescence Units) on the Y axis and time in hours on the X-axis. The three graphs are for suspension cell lines CORL279, H526, and H1930, respectively. Each graph shows a best fit linear regression line for the two axes.
Quantifying drug response using continuous luminescence measurements
To explore the usefulness of the assay for continuous measurements of cell proliferation in response to drugs, we treated eight cell lines with several known anticancer agents and cultured them with the assay reagents for 5 d while taking luminescence measurements. Luminescence offers several advantages over conventional cell count assays (see Introduction and Discussion for more details), including speed and ease of execution and analysis for both adherent and suspension cell lines. By combining luminescence with drug-response data, continuous dose–response curves can be rapidly and efficiently generated by quantifying the rate of change in luminescence (slope). Moreover, because luminescence measurements are an indirect quantification of every single cell within a well, the data gleaned from them is much more sensitive and less variable than taking direct cell imaging counts. This is most exemplified when comparing luminescence measurements to direct cell counts produced from imaging only a fraction of a given well (standard practice).
To generate rates from the continuous luminescence data, we took the slopes of the best fit linear regression lines of the raw luminescence data. An algorithm was developed to compare increasing slices of data points from the end of the assay (defined as peak luminescence in the control condition) by calculating an R2 value for each slice, and using the highest R2 value’s linear regression slope as the basal rate for which subsequent drug dilution luminescence rates were normalized to. For drugged conditions, a similar process was used, but constrained to the region between the peak luminescence of the drugged condition, and the final timepoint of the assay determined by the peak luminescence of the control (Figure 5A). Once the slopes of the continuous luminescent signals were obtained, they were normalized and plotted against the drug concentration series to obtain dose–response curves (Table 1, Figure 5B). In comparing dose–response curves generated from luminescent or direct cell counting data; overall fitting, data variation, and EC50 values were broadly found to be in agreement (Figure 6). Comparing the EC50 values generated from both luminescence and direct counting measures, a Wilcoxon signed-rank test analysis (nonparametric, paired) generated a Wilcoxon value of 31 and a p-value of 0.5693359 (Figure 6A). For the EC50 sample size (N = 12) a Wilcoxon value of 31 exceeds the two-tailed critical value threshold of 13 () and we fail to reject the null hypothesis that the EC50 value pairs are not significantly different. Therefore, whether the EC50 was obtained through direct counting measurements or luminescence did not make a significant difference in its value across the cases tested here. To further assess the congruency of dose–response curve generation between luminescence-derived datasets and those from direct counting, the Emax values for each cell line and drug pairing were compared based on whether or not the Emax values were positive (anti-proliferative/cytostatic [~0]), negative (cytotoxic), or equal to 1 (no drug effect). This is an important observation to make if this type of assay were to be utilized as a first pass drug screening application in order to correctly discern cytotoxic lead compounds from those that are anti-proliferative/cytostatic, or have no effect at all. From 12 paired samples, 11 pairs were found to be in agreement on drug effect mechanism while only one pair (H841/trametinib) was found to lack congruency (Figure 6B). It is also important to note that all of the data used in generating the comparisons in figure 6 were obtained using the same cells within a well for both the luminescence and direct counting measurements. To this end, the analysis being down between the two methods is being generated from the exact same cells, not between equivalents. Across both suspension and adherent cell lines, dose–response curves from luminescence-based rates were generated successfully. The code and associated data are freely accessible in this github repository, “https://github.com/QuLab-VU/RT-Glow/tree/master/RT-Glo%20Paper”.
Figure 5.
Slicing of Luminescence Data to Obtain Rate. (A) Luminescence rates for each individual drug concentration were calculated by fitting the raw luminescence data to a linear regression model. For each concentration, the number of timepoints used in the regression (slice) was determined by calculating the R2 for every possible slicing vector containing more than four points, originating from the end of the assay. The slice producing the maximum R2 value is denoted in orange as a triangle. (B) To generate dose–response curves, each of the calculated luminescence rates was normalized to the luminescence rate in the absence of drug and plotted as a normalized rate in respect to the log of the drug concentration. These data were then fitted to a four parameter log logistic function.
Alt Text: (A) The diagram consists of two rows, one on top of the other, where the top row has five graphs with a Y-axis of RLU (relative luminescence units) and an X-axis of time in hours. Each of these graphs shows the luminescence data points collected during the experiment, and highlights the slice of data used in determining the luminescence rate. This top row is labeled “Calculated Luminescence Rate”. The bottom row has five corresponding graphs with a Y-axis of R2 coefficient and an X-axis of the number of timepoints used in the luminescence rate calculation. In each graph the number of timepoints used in the final calculation is denoted with an orange triangle. This row is labelled “Luminescence Regression Maximum”. (B) This diagram depicts a dose–response curve of the response of H1048 to Barasertib based on luminescence data. It is an example of the types of dose–response curves that can be generated using continuous luminescence. The overlaid sigmoidal curves fits well, and an IC50 value of 1.026E-08 M is denoted in the top-right corner.
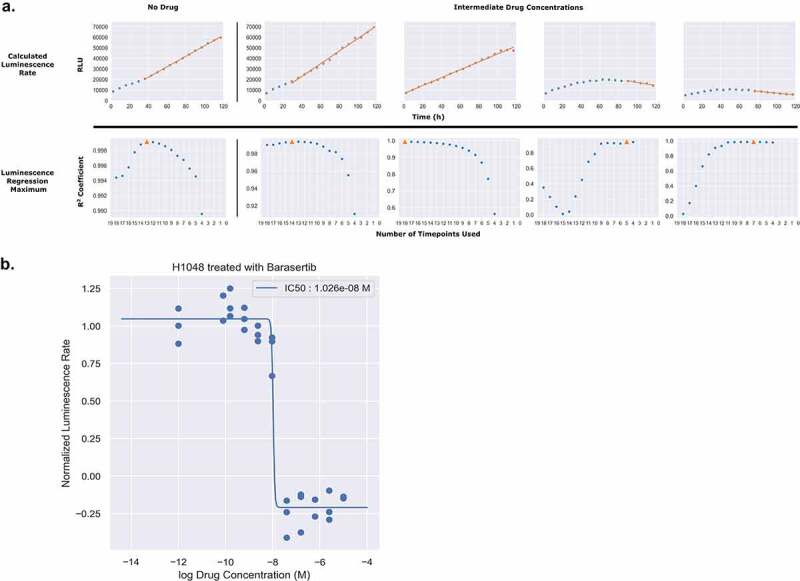
Table 1.
Extracted parameters from best-fit dose–response models
| Cell Line | Drug | Data Type | Hill Coef | Max Resp | EC50 | Residuals |
|---|---|---|---|---|---|---|
| DMS114 | Barasertib | Lum | 8.754 | −0.079 | 7.86E-09 | 9.812 |
| DMS114 | AMG-900 | Lum | 0.544 | −0.234 | 1.69E-09 | 9.254 |
| DMS114 | TAK-901 | Lum | 4.181 | −0.074 | 1.6E-08 | 4.990 |
| DMS114 | YM-155 | Lum | 9.527 | −0.034 | 6.91E-08 | 13.579 |
| DMS114 | SCH-1473759 | Lum | 0.485 | −0.131 | 5.74E-09 | 7.134 |
| DMS114 | Etoposide | Lum | 14.618 | −0.049 | 4.83E-07 | 16.446 |
| DMS114 | SNS-314 | Lum | 0.143 | −0.564 | 2.88E-09 | 11.205 |
| DMS454 | Barasertib | Lum | 0.192 | −5.000 | 733 | 17.492 |
| DMS454 | AMG-900 | Lum | 2.816 | −1.841 | 1.17 | 23.981 |
| DMS454 | TAK-901 | Lum | 0.187 | −4.834 | 6.25E-04 | 61.902 |
| DMS454 | YM-155 | Lum | 14.273 | −0.480 | 7.6E-08 | 19.917 |
| DMS454 | SCH-1473759 | Lum | 0.490 | −5.000 | 3.81E-05 | 30.889 |
| DMS454 | Etoposide | Lum | 10.439 | −1.163 | 2.99E-06 | 305.999 |
| DMS454 | SNS-314 | Lum | 0.535 | −0.511 | 1.44E-08 | 70.104 |
| CORL279 | Barasertib | Lum | 0.482 | 0.143 | 5.13E-09 | 2.275 |
| CORL279 | AMG-900 | Lum | 0.047 | −0.414 | 5.44E-09 | 4.109 |
| CORL279 | TAK-901 | Lum | 1.027 | −0.114 | 4.42E-08 | 1.755 |
| CORL279 | YM-155 | Lum | 0.572 | −0.172 | 2.83E-09 | 8.129 |
| CORL279 | SCH-1473759 | Lum | 0.313 | −0.391 | 1.55E-09 | 4.560 |
| CORL279 | Etoposide | Lum | 0.088 | −0.967 | 5.5E-09 | 19.581 |
| CORL279 | SNS-314 | Lum | 0.000 | −1.608 | 65.5 | 5.726 |
| H1930 | Barasertib | Lum | 0.396 | 0.134 | 2.57E-08 | 4.891 |
| H1930 | AMG-900 | Lum | 0.950 | 0.500 | 7E-10 | 6.743 |
| H1930 | TAK-901 | Lum | 1.350 | 0.080 | 9.01E-08 | 6.072 |
| H1930 | YM-155 | Lum | 1.528 | −0.253 | 2E-09 | 48.869 |
| H1930 | SCH-1473759 | Lum | 0.318 | −0.550 | 5.59E-07 | 3.666 |
| H1930 | Etoposide | Lum | 0.126 | −1.089 | 3.37E-09 | 7.514 |
| H526 | Barasertib | Lum | 2.818 | −1.859 | 1.15 | 93.562 |
| H526 | AMG-900 | Lum | 2.821 | −1.887 | 1.11 | 144.650 |
| H526 | TAK-901 | Lum | 14.720 | 0.402 | 2.39E-06 | 23.102 |
| H526 | YM-155 | Lum | 0.299 | 0.084 | 5.12E-08 | 9.928 |
| H526 | SCH-1473759 | Lum | 13.750 | 0.101 | 2.47E-06 | 24.866 |
| H526 | SNS-314 | Lum | 0.000 | −0.103 | 2.18E-09 | 101.411 |
| H1048 | Barasertib | Lum | 3.431 | −0.209 | 1.44E-08 | 10.332 |
| H1048 | hygromycin_b | Lum | 0.577 | 0.635 | 1.1E-04 | 13.097 |
| H1048 | Trametinib | Lum | 1.054 | 0.238 | 1.37E-07 | 12.033 |
| H1048 | SCH-1473759 | Lum | 1.333 | −0.219 | 2.86E-09 | 17.029 |
| H1048 | YM-155 | Lum | 0.995 | −0.186 | 2.74E-09 | 4.925 |
| H1048 | TAK-901 | Lum | 2.508 | −0.209 | 1.45E-08 | 17.176 |
| H1048 | SNS-314 | Lum | 2.507 | −0.069 | 4.95E-09 | 14.051 |
| H841 | Barasertib | Lum | 0.520 | −0.427 | 3.96E-09 | 44.403 |
| H841 | hygromycin_b | Lum | 2.817 | −1.851 | 1.16 | 17.366 |
| H841 | Trametinib | Lum | 0.799 | −0.281 | 2.1E-08 | 17.401 |
| H841 | SCH-1473759 | Lum | 3.777 | −0.363 | 4.17E-09 | 59.188 |
| H841 | YM-155 | Lum | 0.999 | −0.794 | 9.79E-09 | 86.686 |
| H841 | TAK-901 | Lum | 2.342 | −0.380 | 1.45E-08 | 13.628 |
| H841 | SNS-314 | Lum | 2.465 | −0.377 | 8.42E-09 | 14.323 |
| DMS53 | Barasertib | Lum | 2.817 | −1.855 | 1.15 | 1395.696 |
| DMS53 | hygromycin_b | Lum | 2.717 | 0.857 | 5.28E-08 | 117.582 |
| DMS53 | Trametinib | Lum | 1.032 | −0.659 | 1.38E-08 | 85.699 |
| DMS53 | SCH-1473759 | Lum | 0.201 | −4.430 | 2.17E-03 | 47.346 |
| DMS53 | YM-155 | Lum | 0.483 | −0.696 | 2.89E-09 | 46.906 |
| DMS53 | TAK-901 | Lum | 0.203 | −5.000 | 4.42E-03 | 45.003 |
| DMS53 | SNS-314 | Lum | 0.781 | −5.000 | 1.54E-04 | 138.641 |
| DMS53 | Vemurafenib | Lum | 0.230 | −5.000 | 5.49E-03 | 43.273 |
| H1048 | SNS-314 | Direct | 0.339 | −1.673 | 1.31E-08 | 3.812 |
| H1048 | Trametinib | Direct | 1.009 | 0.137 | 2.29E-08 | 9.877 |
| H1048 | SCH-1473759 | Direct | 0.601 | −1.588 | 3.32E-09 | 2.783 |
| H1048 | YM-155 | Direct | 0.730 | −1.703 | 3.01E-10 | 22.686 |
| H1048 | TAK-901 | Direct | 1.692 | −1.294 | 2.11E-08 | 1.317 |
| H1048 | Barasertib | Direct | 0.322 | −2.742 | 6.29E-07 | 6.424 |
| H841 | SNS-314 | Direct | 0.550 | −0.351 | 1.12E-09 | 1.208 |
| H841 | Trametinib | Direct | 2.111 | 0.588 | 5.46E-07 | 0.124 |
| H841 | SCH-1473759 | Direct | 1.312 | −0.072 | 5.33E-09 | 3.166 |
| H841 | YM-155 | Direct | 1.216 | −0.818 | 2.61E-10 | 4.012 |
| H841 | TAK-901 | Direct | 2.328 | −0.633 | 6.33E-08 | 0.634 |
| H841 | Barasertib | Direct | 0.442 | −5.000 | 1.55E-05 | 0.544 |
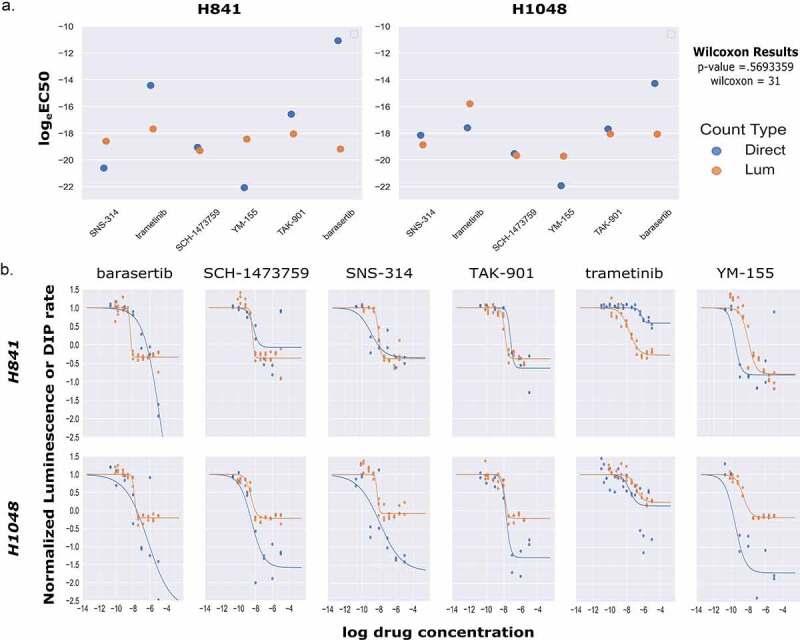
Figure 6.
Comparison of EC50 Values and Dose–Response Curve Fits between Luminescent and Direct Cell Counting Measurements. (A) Scatter plot comparison of calculated logeEC50 values for both luminescence based and direct cell counting measurements. Across all paired values tested, there was no significant difference between luminescence-based logeEC50 values and those obtained from direct cell counting (Wilcoxon signed rank test, p-value = 0.569, W = 31, N = 12). (B) Comparisons of dose–response curves generated by either luminescence (orange) or direct cell counting (blue) for two cell lines across a panel of six drugs.
Alt Text: (A) There are two paired scatter plots side by side with a Y-axis of logeEC50 and X-axis labels of SNS-314, trametinib, SCH-1473759, YM-155, TAK-901, and barasertib corresponding to drugs. The scatter plot on the left is for cell line H841 and the one on the right is for cell line H1048. For each X-axis label within each plot, there are a pair of points, one orange denoting the value derived from luminescence, and one blue denoting the value derived from direct counting. Objectively, the majority of these paired points are similar. On the fair right of the diagram are the Wilcoxon signed-rank statistical test results showing a p-value of 0.563359 and a Wilcoxon value of 31. These results indicate that there is not a significant difference in the logeEC50 value between those determined by luminescence and those determined by direct cell counting. (B) There is a panel of 12 dose response curves, two rows of six. The top row is labeled H841 and the bottom row is labeled H1048. Columns 1–6 are labeled barasertib, SCH-1473759, SNS-314, TAK-901, trametinib, and YM-155, respectively. In every graph, the Y-axis is the Normalized Luminescence or DIP rate and the X-axis is the log drug concentration. Within each graph, there are two overlaid curves, an orange one derived from luminescence measurements and a blue one derived from direct counting measurements. All of the curves across every cell line and drug pairing have highly congruent EC50 values. Additionally, while only about half of the Emax values show objective congruency, all Emax pairings are in agreement for drug effect mechanism (cytostatic, cytotoxic, anti-proliferative) except for H841/trametinib.
Discussion
Here, we have outlined the development and application of a non-lytic luminescence-based assay to extract rate-based metrics of drug response. Implementation of our analysis and workflow has the potential to greatly expedite and modernize large-scale screening and characterization of drug response in a variety of disease models and culture methods. This work has traditionally been accomplished using fixed-endpoint viability metrics, which contain a significant degree of inherent biases, ultimately leading to a large potential for mischaracterization of drug effect in a variety of indices, both positive and negative. We and others have shown the value in taking continuous measurements across the duration of an experiment at multiple timepoints.1–3,11,15,16 However, despite the clear advantages in data quality, adoption of continuous viability assays has been relatively slow, likely due primarily to the difficulties in integrating a continuous assay into an existing setup designed for fixed-endpoint measurements. Previously, we have described the DIP rate as an unbiased metric for drug proliferation when using direct cell counting. Our analysis of continuous luminescence utilizes the same mathematical ideology, while going one step further, with a protocol that is easily adaptable to existing fixed-endpoint workflows. What this means is, by changing only the reagent preparation method and data analysis pipeline, laboratories currently setup for drug screening using a fixed-endpoint protocol could rapidly pivot to a much more quantitatively robust method with little to no adjustment of established automation. Our hope is that this additional analytical rigor at the basic science level could lead to fewer cases of therapeutic candidates failing to translate to higher order biological models.
Like any assay, NanoLuc luciferase-based continuous luminescence does have its limitations, and suffers many of the same issues surrounding MTT/MTS-based measurements such as potential overestimation of viability from active mitochondrion, and inability of use for drugs targeting redox pathways.11,17 These features are hardly unique to this assay, and have been generally accepted in the field for quite some time.8,11,18–20 Furthermore, because the assay is based upon the reducing potential of cells, the raw data is highly sensitive to the proliferation rate and the metabolic status of the cells being studied. This is to say that when comparing the raw luminescence data between cell lines, cells that proliferate quickly, have a very active metabolic status, or both, exhibit steeper luminescence trends than their slower growing or metabolically less active counterparts. However, similar to how DIP rate measurements counter proliferation rate bias involved in fixed-endpoint assays, our continuous luminescence-based analysis is not influenced by these absolute differences in the raw data, as all quantification is done within a cell line and not compared to an outside standard. This is to say that because each drug-response is calculated as a fractional value of the basal luminescence rate (for that cell line), the overall response is normalized and not amplified or diminished by the individual growth and metabolic characteristics of the line being studied. In the extreme case scenario of non-proliferating cells, we expect our proposed analysis method to remain valid, as long as the cells remain metabolically active. This example would expect to produce a relatively consistent raw luminescence trend with a slope of ~0. However, if the metabolic status of the cells being studied was not continuous (i.e. cyclically active, or non-existent) the analysis would need to be significantly adjusted and further experimentation would be required to confirm whether or not continuous luminescent measurements as described here would be the appropriate method to use at all. By structuring experiments to avoid these known factors, complex drug-response analysis can easily be simultaneously achieved across cell lines, independent of their morphology.17
For cell lines that are able to maintain a linear trend in luminescence for the duration of an experiment (without drug), continuous luminescence measurements offer a simple and scalable option for generating dose–response curves. This is of particular interest for cell lines that are cultured in suspension, as direct counting of suspension line cultures is not currently feasible in most situations. Additionally, because the structure of the assay is irrespective to the cell morphology, continuous luminescence allows for the quantification of cellular response across a wide range of culture characteristics such as adherent clustering, suspension aggregation, low-density culture, and slowly or non-proliferating lines. As long as the luminescent signal within the well is above the minimum threshold for the instrument, results can be obtained. Furthermore, during the course of experimentation for this method, no appreciable differences in the raw data quality were observed between cell lines exhibiting highly dense or aggregated characteristics and those exhibiting classical adherent spreading or monodisperse suspension characteristics. This suggests that the density of the culture did not play a major role in the utilization of the assay, but would need to be confirmed more thoroughly prior to implementation in three-dimensional culture settings (e.g. organoids) where diffusion of nutrients and components from the media to the center of the culture is a known issue.21–24 Based on the results of our experimentation, we intend to further explore the utility of NanoLuc luciferase-based luminescence by computationally modeling the dynamics of the system, potentially using luminescence rates to predict DIP rates, as well as testing its usefulness in quantifying drug-response in three-dimensional cultures (organoids). Moreover, while the mechanism of drug action (outside of redox pathway-related drugs) is not expected to influence the results of this assay, further experimentation is required using a broader library of drug classes before this can be explicitly stated. Additionally, during this process, nonsmall-molecule therapeutics (e.g. detergents, toxins, antibodies, cyclic peptides, etc.) should also be tested to assess any possible biases from therapeutic type. The results of this broader screen could also be used to assess whether induced cell death method plays any role in the utility of the assay by comparing responses to drugs which are known to induce specific cell death pathways (e.g. DNA alkylating agents for apoptosis, cytochalasin B for necrosis, SMAC mimetics combined with caspase-8 inhibition for necroptosis, etc.).25,26 Lastly, our most immediate goal for this work is to showcase its utility with the successful integration into a high-throughput in vitro drug screening platform.
Compared to the other currently available viability assays, continuous luminescence measures utilizing the NanoLuc luciferase signal and MT substrate offer the most advantaged and scalable platform. Unlike CellTiter-Glo, the assay is continuous and non-lytic, allowing for fewer characterization biases and the ability to use cells in downstream applications. Unlike EZ-MTT and Alamar Blue, it allows for real-time population dynamic quantification as the resulting product used in measurements (photons) is removed from the system as it is detected, instead of accumulating (formazan and resazurin), allowing for the ability to obtain negative rates. This is especially important for classifying drug effect mechanism as without real-time population dynamics it is difficult to differentiate between anti-proliferative, cytostatic, and cytotoxic drug effects. With continuous luminescence measurements, this is easily characterized, as drugs that produce rates with a value fractional to the basal rate are considered anti-proliferative, drugs that produce a rate of ~0 are considered cytostatic, and drugs that produce a negative rate are cytotoxic. Finally, unlike imaging-based methods (the only other true real-time viability assay currently available), it does not require cellular labeling or expensive imaging equipment, making it easily integrable into existing microplate-based workflows.
Methods
Cell lines
DMS454 and CORL-279 cells were purchased from Sigma-Aldrich (Sigma 95062832, 96020724). DMS53, DMS114, H524, H526, H841, H1048, and H1930 were purchased from the ATCC (ATCC CRL-2062, CRL-2066, CRL-5831, CRL-5811, CRL-5845, CRL-5853, CRL-5906). WM1799 cells were generously donated as a gift from the laboratory of Kim Dahlman, Ph.D. HEK293FT cells were purchased from ThermoFisher Scientific (ThermoFisher R70007).
Cell culture
All cell lines were cultured for a minimum of 2 weeks prior to experimentation in T75 (Corning 430641 U) flasks containing appropriate media (see below) at 37°C and 5% CO2. Additionally, prior to any experimentation, absence of mycoplasma was confirmed using a MycoAlert Mycoplasma Detection Kit (Lonza LT07-118).
Appropriate media
RPMI 1640 medium (Corning 10–040-CV) supplemented with 10% FBS (Gibco 26140079) and 1% Pen-Strep (Gibco 15140122)
(CORL-279, DMS53, DMS114, DMS454, H524, H526, H1048, H1930)
DMEM/F12 medium (Gibco 11320033) supplemented with 10% FBS (Gibco 26140079), and 15 mM HEPES (Gibco 15630080)
(WM1799)
DMEM medium containing 4.5 g/L glucose (Gibco 11965092) supplemented with 10% FBS (Gibco 26140079), and 1% Pen-Strep (Gibco 15140122)
(HEK293FT)
Static luminescence measurements
Cells were cultured for 2 weeks, spun down, and resuspended at a density of 2.86E4 cells/mL in appropriate media, NanoLuc Enzyme (Promega E499A), and MT pro-substrate (Promega G971A). Each cell line was plated on to a 384 well GreinerOne Imaging plate (Greiner 781096) at a density of 2000 cells per well serially diluted across ten wells (2000–4) with a total well volume of 70 µu\L in each. Additionally, each cell line was plated in triplicate. The plate was then incubated in a BioTek Synergy H1 at 37°C and 5% CO2 for 5 minutes before luminescence measurements were taken (lid on).
Determining Linear Assay Range
Initial cell concentrations for the linearity range of the assay were determined by following the guidelines in the “Promega RealTime-Glo MT Cell Viability Assay Protocol Handbook” under subsection four, “Determining Assay Linearity for the Endpoint or Continuous-Read Format”. Briefly, cells were serially diluted and plated with RT-Glo reagents, incubated for the proposed length of experiment (120 h), while luminescence measurements were taken every 4 h. Upon completion, the luminescence trend lines were analyzed by linear regression to find a suitable cell concentration that would maintain a linear regression coefficient of >.90 for the duration of the assay (Data Not Shown).
Continuous luminescence measurements
Cells were cultured for 2 weeks, spun down, and resuspended at a density of 4.39E3 cells/mL in appropriate media, 10 nM Sytox Green (Invitrogen S7020), NanoLuc Enzyme (Promega E499A), and MT pro-substrate (Promega G971A). Each cell line was plated on to a 384 well GreinerOne imaging plate (Greiner 781096) at a density of 300 cells per well across ten wells with a total well volume of 70 µL in each. Additionally, each cell line was plated in triplicate. The plate was then incubated in a BioTek Synergy H1 at 37°C and 5% CO2 for 5 min before initial luminescence and fluorescence measurements were taken (lid on). The plate was then stored at 37° Celsius and 5% CO2 in an incubator. Every 12 h, the plate was removed, left to equilibrate for 5 mins in the BioTek Synergy H1, and luminescence measurements were recorded. This continued for a total of 100 h, at which time the plates were discarded.
Direct cell counting
To facilitate automated image processing, cells were engineered to express the monomeric red fluorescent protein mRuby2, integrated by dual transfection of a modified PiggyBac recombinase expressing plasmid and a custom mRuby2 containing transposon plasmid.27,28 Cells were seeded at 300 cells per well in 384 well GreinerOne imaging plates (Greiner 781096). DMSO (Sigma D8418) and phosphate-buffered saline (Corning 21–040-CV) were used as vehicle controls, as appropriate. Images were acquired through a 10× or 20× objective with a Cellavista HighEnd Bioimager (SynenTec Bio Services, Meunster, Germany) every 12 h as 3 × 3 or 5 × 5 montages for 120 hours. Image processing to obtain counts of cell nuclei at each timepoint was performed as previously described.15
Acknowledgments
The authors would like to acknowledge Dr Dave Westover for his immense help in implementing automated luminescence and imaging protocols, Dr Jing Hao for reagent acquisition, and all members of the Quaranta and Lopez laboratories for facilitating productive discussions.
Funding Statement
This work was supported by the National Cancer Institute under Grants NCI – U01 CA215845, NCI – U54 CA217450, NCI – CA174706; National Institutes of Health NIH – R50 CA243783; Quantitative Systems Biology Center at Vanderbilt University; and the Institute for Maximizing Student Diversity at Vanderbilt University. LAH is supported by a National Cancer Institute (NCI) Transition Career Development Award to Promote Diversity (K22-CA237857-01A1).
Disclosure statement
The authors report that there are no competing interests to declare.
References
- 1.Harris LA, Frick PL, Garbett SP, Hardeman KN, Paudel BB, Lopez CF, Quaranta V, Tyson DR.. An unbiased metric of antiproliferative drug effect in vitro. Nat Methods. 2016;13(6):497–500. doi: 10.1038/nmeth.3852. PMID: 27135974. [DOI] [PMC free article] [PubMed] [Google Scholar]
- 2.Hafner M, Niepel M, Chung M, Sorger PK.. Growth rate inhibition metrics correct for confounders in measuring sensitivity to cancer drugs. Nat Methods. 2016;13(6):521. doi: 10.1038/NMETH.3853. PMID: 27135972. [DOI] [PMC free article] [PubMed] [Google Scholar]
- 3.Fallahi-Sichani M, Honarnejad S, Heiser LM, Gray JW, Sorger PK. Metrics other than potency reveal systematic variation in responses to cancer drugs. Nat Chem Biol. 2013;9(11):708. doi: 10.1038/NCHEMBIO.1337. PMID: 24013279. [DOI] [PMC free article] [PubMed] [Google Scholar]
- 4.Berridge MV, Herst PM, Tan AS. Tetrazolium dyes as tools in cell biology: new insights into their cellular reduction. Biotechnol Annu Rev. 2005;11:127–152. PMID: 16216776. doi: 10.1016/S1387-2656(05)11004-7. [DOI] [PubMed] [Google Scholar]
- 5.Berridge MV, Tan AS. Characterization of the Cellular Reduction of 3-(4,5-dimethylthiazol-2-yl)-2,5-diphenyltetrazolium bromide (MTT): Subcellular Localization, Substrate Dependence, and Involvement of Mitochondrial Electron Transport in MTT Reduction. Arch Biochem Biophys. 1993;303(2): 474–482. doi: 10.1006/ABBI.1993.1311. PMID: 8390225. [DOI] [PubMed] [Google Scholar]
- 6.Bernas T, Dobrucki J. Mitochondrial and nonmitochondrial reduction of MTT: interaction of MTT with TMRE, JC-1, and NAO mitochondrial fluorescent probes. Cytometry. 2002;47(4):236–242. doi: 10.1002/CYTO.10080. PMID: 11933013. [DOI] [PubMed] [Google Scholar]
- 7.England CG, Ehlerding EB, Cai W. NanoLuc: a small luciferase is brightening up the field of bioluminescence. Bioconjug Chem. 2016;27(5):1175. doi: 10.1021/ACS.BIOCONJCHEM.6B00112. PMID: 27045664. [DOI] [PMC free article] [PubMed] [Google Scholar]
- 8.Cory AH, Owen TC, Barltrop JA, Cory JG. Use of an aqueous soluble tetrazolium/formazan assay for cell growth assays in culture. Cancer Commun. 1991;3(7):207–212. doi: 10.3727/095535491820873191. PMID: 1867954. [DOI] [PubMed] [Google Scholar]
- 9.Hall MP, Unch J, Binkowski BF, Valley MP, Butler BL, Wood MG, Otto P, Zimmerman K, Vidugiris G, MacHleidt T, et al. Engineered luciferase reporter from a deep sea shrimp utilizing a novel imidazopyrazinone substrate. ACS Chem Biol. 2012;7(11):1848. 10.1021/CB3002478. PMID: 22894855. [DOI] [PMC free article] [PubMed] [Google Scholar]
- 10.Duellman SJ, Zhou W, Meisenheimer P, Vidugiris G, Cali JJ, Gautam P, Wennerberg K, Bioluminescent VJ, Nonlytic. real-time cell viability assay and use in inhibitor screening. Assay Drug Dev Technol. 2015;13(8):456–465. doi: 10.1089/ADT.2015.669/ASSET/IMAGES/LARGE/FIGURE5.JPEG. PMID: 26383544. [DOI] [PMC free article] [PubMed] [Google Scholar]
- 11.Riss TL, Moravec RA, Niles AL, Duellman S, Benink HA, Worzella TJ, Minor L. Cell Viability Assays [Internet]. Assay Guid Man. Bethesda (MD): Eli Lilly & Company and the National Center for Advancing Translational Sciences; 2016 Jul 01 [accessed 2021 Oct 15]. http://www.ncbi.nlm.nih.gov/pubmed/23805433. [Google Scholar]
- 12.Altman FP. Tetrazolium salts and formazans. Prog Histochem Cytochem. 1976;9(3):3–6. doi: 10.1016/S0079-6336(76)80015-0. PMID: 792958. [DOI] [PubMed] [Google Scholar]
- 13.Isherwood B, Timpson P, Mcghee EJ, Anderson KI, Canel M, Serrels A, Brunton VG, Carragher NO. Live cell in vitro and in vivo imaging applications: accelerating drug discovery. Pharmaceutics. 2011;3(2):141. doi: 10.3390/PHARMACEUTICS3020141. PMID: 24310493. [DOI] [PMC free article] [PubMed] [Google Scholar]
- 14.Hsieh JH, Huang R, Lin JA, Sedykh A, Zhao J, Tice RR, Paules RS, Xia M, Auerbach SS. Real-time cell toxicity profiling of Tox21 10K compounds reveals cytotoxicity dependent toxicity pathway linkage. PLoS One. 2017;12. 10.1371/JOURNAL.PONE.0177902. PMID: 28531190. [DOI] [PMC free article] [PubMed] [Google Scholar]
- 15.Frick PL, Paudel BB, Tyson DR, Quaranta V. Quantifying heterogeneity and dynamics of clonal fitness in response to perturbation. J Cell Physiol. 2015;230(7):1403–1412. doi: 10.1002/JCP.24888. PMID: 25600161. [DOI] [PMC free article] [PubMed] [Google Scholar]
- 16.Uzunoglu S, Karaca B, Atmaca H, Kisim A, Sezgin C, Karabulut B, Uslu R. Comparison of XTT and Alamar blue assays in the assessment of the viability of various human cancer cell lines by AT-101 (−/− gossypol). Toxicol Mech Methods. 2010;20(8):482–486. doi: 10.3109/15376516.2010.508080. PMID: 20843265. [DOI] [PubMed] [Google Scholar]
- 17.Wang P, Henning SM, Heber D. Limitations of MTT and MTS-Based assays for measurement of antiproliferative activity of green tea polyphenols. PLoS One. 2010;5(4):e10202. doi: 10.1371/JOURNAL.PONE.0010202. PMID: 20419137. [DOI] [PMC free article] [PubMed] [Google Scholar]
- 18.Butcher EC. Can cell systems biology rescue drug discovery? Nat Rev Drug Discov. 2005;4(6):461–467. doi: 10.1038/NRD1754. PMID: 15915152. [DOI] [PubMed] [Google Scholar]
- 19.Garnett MJ, Edelman EJ, Heidorn SJ, Greenman CD, Dastur A, Lau KW, Greninger P, Thompson IR, Luo X, Soares J, et al. Systematic identification of genomic markers of drug sensitivity in cancer cells. Nat. 2012;483(7391):570–575. 10.1038/nature11005. PMID: 22460902. [DOI] [PMC free article] [PubMed] [Google Scholar]
- 20.Mosmann T. Rapid colorimetric assay for cellular growth and survival: application to proliferation and cytotoxicity assays. J Immunol Methods. 1983;65(1–2):55–63. doi: 10.1016/0022-1759(83)90303-4. PMID: 6606682. [DOI] [PubMed] [Google Scholar]
- 21.Cartmell SH, Porter BD, García AJ, Guldberg RE. Effects of medium perfusion rate on cell-seeded three-dimensional bone constructs in vitro. Tissue Eng. 2003;9(6):1197–1203. doi: 10.1089/10763270360728107. PMID: 14670107. [DOI] [PubMed] [Google Scholar]
- 22.Volkmer E, Drosse I, Otto S, Stangelmayer A, Stengele M, Kallukalam BC, Mutschler W, Schieker M. Hypoxia in static and dynamic 3D culture systems for tissue engineering of bone. Tissue Eng Part A. 2008;14(8):1331–1340. doi: 10.1089/TEN.TEA.2007.0231. PMID: 18601588. [DOI] [PubMed] [Google Scholar]
- 23.Malda J, Klein TJ, Upton Z. The roles of hypoxia in the in vitro engineering of tissues. Tissue Eng. 2007;13(9):2153–2162. doi: 10.1089/TEN.2006.0417. PMID: 17516855. [DOI] [PubMed] [Google Scholar]
- 24.McMurtrey RJ. Analytic models of oxygen and nutrient diffusion, metabolism dynamics, and architecture optimization in three-dimensional tissue constructs with applications and insights in cerebral organoids. Tissue Eng Part C Methods. 2016;22(3):221. doi: 10.1089/TEN.TEC.2015.0375. PMID: 26650970. [DOI] [PMC free article] [PubMed] [Google Scholar]
- 25.Bezabeh T, Mowat MRA, Jarolim L, Greenberg AH, Smith ICP. Detection of drug-induced apoptosis and necrosis in human cervical carcinoma cells using 1H NMR spectroscopy. Cell Death Differ. 2001;8(3):219–224. 2001 83 doi: 10.1038/sj.cdd.4400802. PMID: 11319604. [DOI] [PubMed] [Google Scholar]
- 26.Mezzatesta C, Bornhauser BC. Exploiting necroptosis for therapy of acute lymphoblastic leukemia. Front Cell Dev Biol. 2019;7:40. PMID: 30941349. doi: 10.3389/FCELL.2019.00040/BIBTEX. [DOI] [PMC free article] [PubMed] [Google Scholar]
- 27.Li X, Burnight ER, Cooney AL, Malani N, Brady T, Sander JD, Staber J, Wheelan SJ, Joung JK, McCray PB, et al. PiggyBac transposase tools for genome engineering. Proc Natl Acad Sci U S A. 2013;110. 10.1073/pnas.1305987110. PMID: 23723351. [DOI] [PMC free article] [PubMed] [Google Scholar]
- 28.Yusa K, Zhou L, Li MA, Bradley A, Craig NL. A hyperactive piggyBac transposase for mammalian applications. Proc Natl Acad Sci U S A. 2011;108(4):1531–1536. doi: 10.1073/PNAS.1008322108. PMID: 21205896. [DOI] [PMC free article] [PubMed] [Google Scholar]