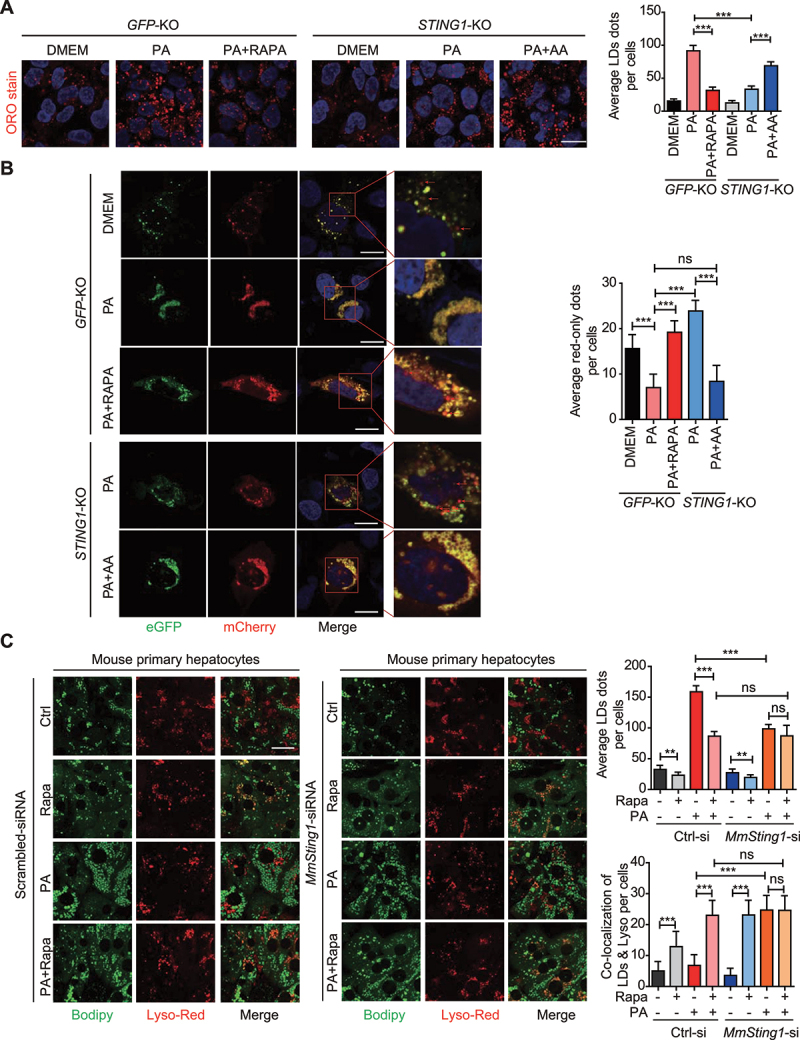
Figure 5.

STING1 involves in inhibition of lipophagy under PA treatment. (A) Control (GFP-KO) and STING1-KO Hep3B cells with indicated treatment were fixed and stained with Oil red O (ORO stain), and followed by confocal fluorescence microscopy. The numbers of red-only puncta per cell were quantified by blind counting. Shown on the right is the mean plus SD of ten views of counting. ***p < 0.001. (B) Control (GFP-KO) and STING1-KO Hep3B cells transfected with mCherry-eGFP-PLIN2 plasmid for 48 h were treated with or without PA (0.5 mM, 24 h) followed with rapamycin (200 nM, 6 h) and AA (60 min). Cells were fixed and followed by confocal fluorescence microscopy. Representative images are shown. Right panels are enlarged photographs from the boxed areas. Arrow denotes the red-only puncta. Scale bar: 10 μm. The numbers of red-only puncta per cell were quantified by blind counting. Shown on the right is the mean plus SD of ten views of counting. ***p < 0.001, ns = not significant. (C) Confocal microscopy of mouse primary hepatocytes with or without mouse-Sting1-siRNA (MmSting1-siRNA) transfection followed with treatment of PA (0.5 mM, 24 h) or rapamycin (200 nM, 6 h). Cells treated with scrambled siRNA were used as control. For the combination treatment of PA and rapamycin, PA was treated for 18 h followed with 6 h of rapamycin treatment. The cultured cells were stained with Bodipy-FL and LysoTracker Red. Representative images are shown. Scale bar: 10 μm. The numbers of colocalized puncta per cell were quantified by blind counting. Shown on the right is the mean plus SD of ten views of counting. Ctrl-si referred to scrambled siRNA. MmSting1-si refereed to mouse-Sting1-siRNA. ***p < 0.001, **p < 0.01. ns = not significant.
