Abstract
Single nucleus ATAC-seq (snATAC-seq) creates new opportunities to dissect cell type-specific mechanisms of complex diseases. As pancreatic islets are central to type 2 diabetes (T2D), we profiled 15.3k islet cells using combinatorial barcoding snATAC-seq and identified 12 clusters, including multiple alpha, beta and delta cell states. We cataloged 228,873 accessible chromatin sites and identified transcription factors underlying lineage- and state-specific regulation. We observed state-specific enrichment of fasting glucose and T2D GWAS for beta cells as well as enrichment for other endocrine cell types. At T2D signals localized to islet accessible chromatin, we prioritized variants with predicted regulatory function and co-accessibility with target genes. A causal T2D variant rs231361 at the KCNQ1 locus had predicted effects on a beta cell enhancer co-accessible with INS, and genome editing in embryonic stem cell-derived beta cells affected INS levels. Together our findings demonstrate the power of single cell epigenomics for interpreting complex disease genetics.
INTRODUCTION
Gene regulatory programs are largely orchestrated by cis-regulatory elements that direct the expression of genes in response to specific developmental and environmental cues. Genetic variants associated with complex disease are highly enriched within putative cis-regulatory elements1. The activity of regulatory elements is often restricted to specific cell types and/or cell states, limiting the ability of ATAC-seq and other “ensemble” (or “bulk”) epigenomic technologies to map regulatory elements in individual cell types within disease-relevant tissues. To overcome this limitation, new approaches to obtain ATAC-seq profiles from single nuclei allow for the disaggregation of open chromatin from heterogenous samples into component cell types and subtypes2–4. These developments create opportunities to dissect the molecular mechanisms that underlie genetic risk of disease. However, to date snATAC-seq data from disease-relevant human tissues are limited5–8.
Type 2 diabetes (T2D) is a multifactorial disease with a highly polygenic inheritance9. Pancreatic islets are central to genetic risk of T2D, as evidenced by shared association between T2D risk and quantitative measures of islet function10–13 and enrichment of T2D risk variants in islet regulatory sites14–18. Islets are comprised of multiple endocrine cell types with distinct functions19–21 and are heterogeneous22–24 in gene expression and other molecular signatures which likely reflect different functional cell states22,25,26. Heterogeneity in the epigenome of islet cell types has not been described, however, which is necessary to understand islet regulation and interpret the molecular mechanisms of non-coding T2D risk variants. In this study, we map accessible chromatin profiles of individual islet cells using snATAC-seq, define the regulatory programs of islet cell types and cell states, describe their relationship to T2D risk and fasting glycemia, and predict the molecular mechanisms of T2D risk variants.
RESULTS
Islet snATAC-seq reveals 12 distinct cell clusters
We performed snATAC-seq on human pancreatic islets from three donors using a combinatorial barcoding snATAC-seq approach optimized for use on tissues2,4 (Supplementary Table 1). To confirm library quality, we first analyzed the data as ensemble ATAC-seq by aggregating all high-quality mapped reads irrespective of barcode. Ensemble snATAC-seq from all three samples showed the expected insert size distribution (Extended Data Figure 1a), strong enrichment of signal at transcription start sites (TSS) (Extended Data Figure 1b), and high concordance of signal with published islet ATAC-seq data14,27–29 (Extended Data Figure 1c).
To obtain high-quality single cell profiles, we first filtered out barcodes with fewer than 500 reads (Extended Data Figure 1d), resulting in a total of 18,544 cells across the three samples. We then clustered accessible chromatin profiles from these cells, making key modifications to previous approaches4 (Extended Data Figure 2). After filtering out cells with aberrant quality metrics, we retained 15,298 cells which mapped to 12 clusters (Figure 1a). To determine the cell type represented by each cluster, we examined chromatin accessibility at the promoter region of the cognate hormone genes for endocrine cells and known marker genes for non-endocrine cell types. We identified clusters representing beta (INS-IGF2/insulin), alpha (GCG/glucagon), delta (SST/somatostatin), gamma (PPY/pancreatic polypeptide), ductal (CFTR), acinar (REG1A), immune (NCF2)30, stellate (PDGFRB)30, and endothelial (CD93)31 cells (Figure 1b-c). We defined a broader set of marker genes for each cluster by identifying promoters with accessibility most specific to each cluster (Supplementary Table 2). We observed highly specific correlations between marker genes defining cell types in snATAC-seq and islet scRNA-seq23 (Figure 1d, Extended Data Figure 3a-e).
Figure 1. Pancreatic islet cell type accessible chromatin defined using snATAC-seq.
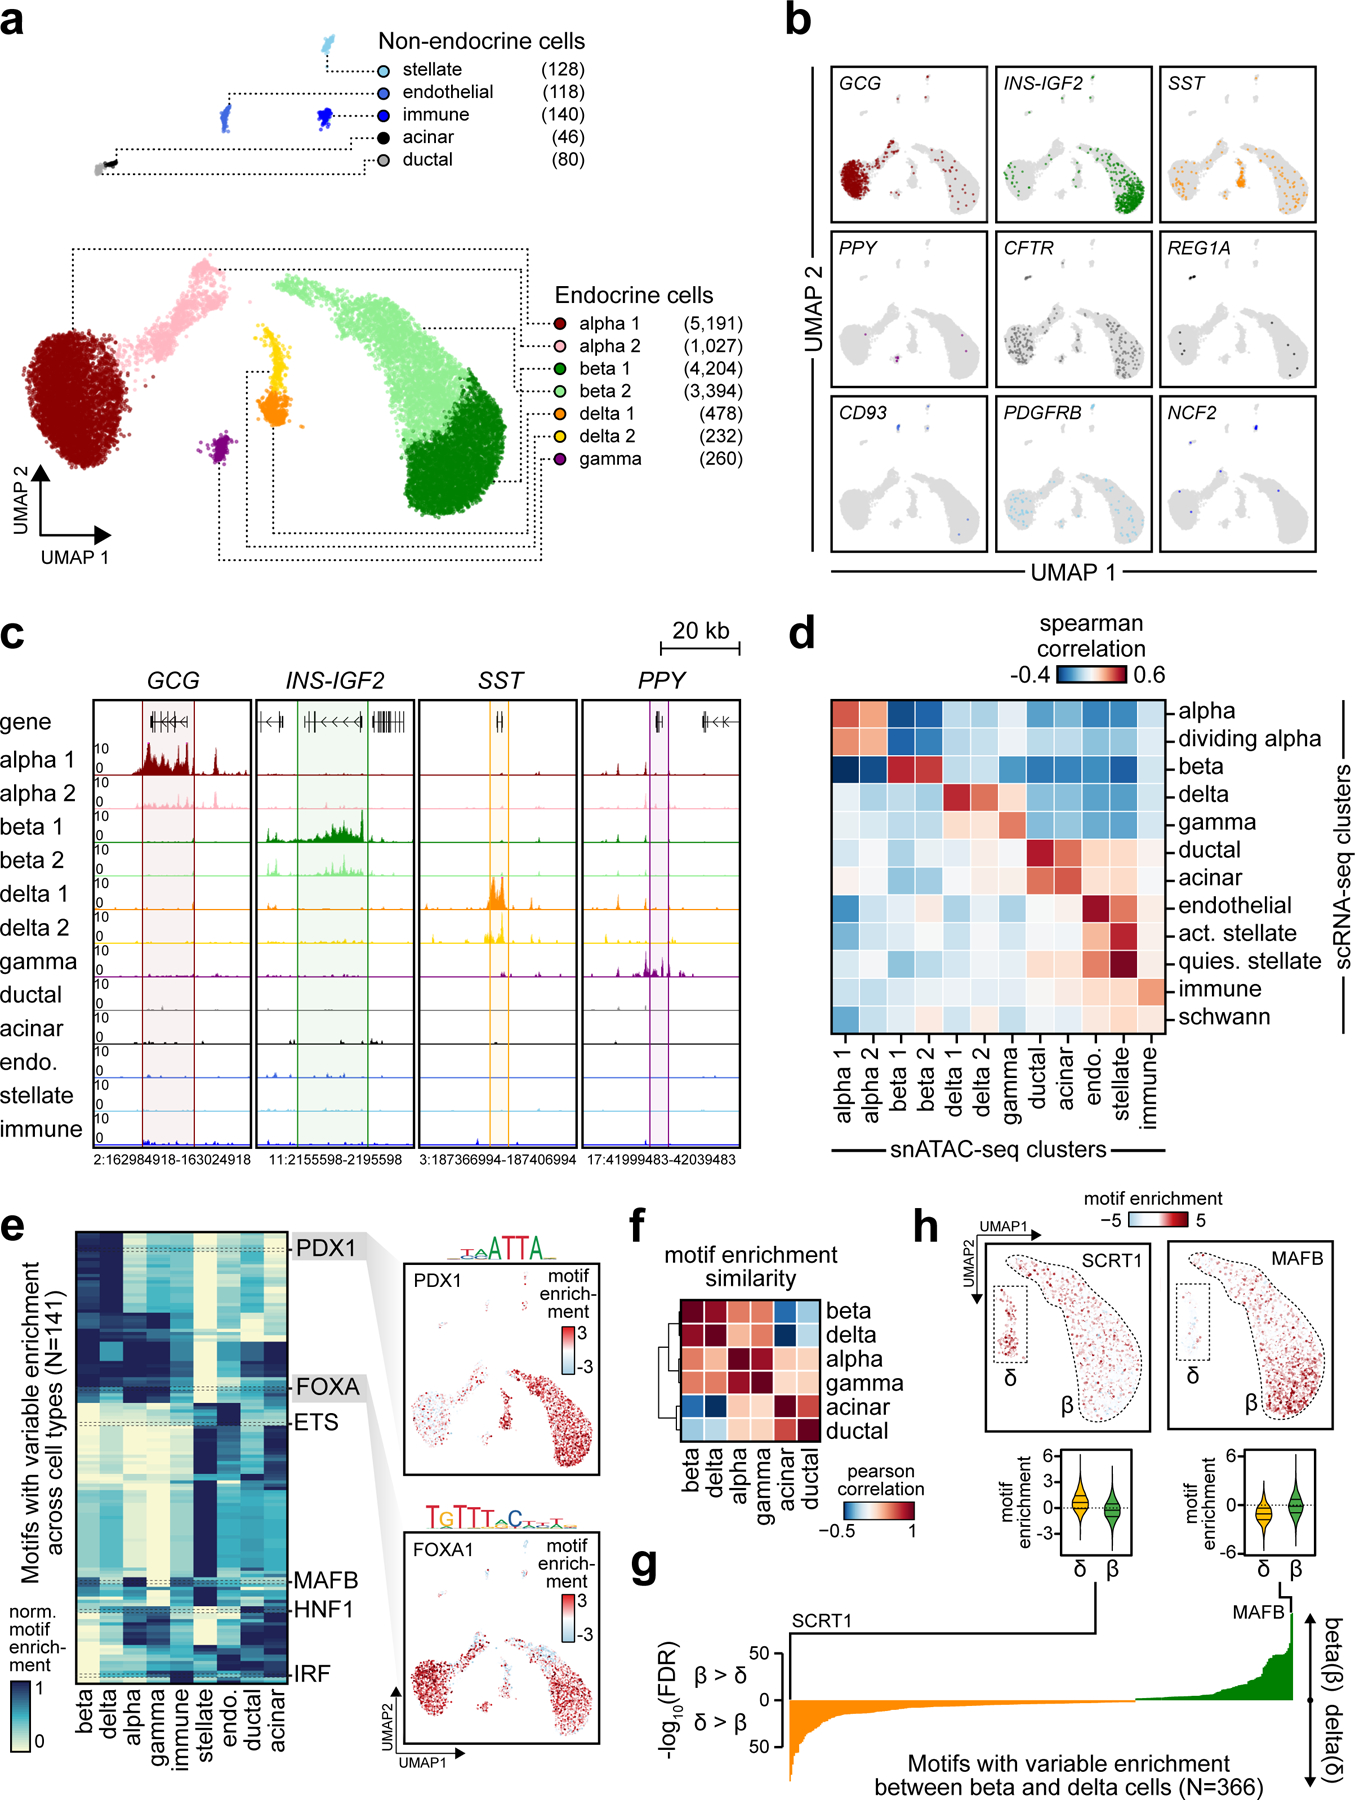
(a) Clustering of accessible chromatin profiles from 15,298 pancreatic islet cells identifies 12 distinct clusters plotted on UMAP coordinates. The number of cells for each cluster is listed in parenthesis next to the cluster label. (b) Promoter accessibility in a 1 kb window around the TSS for selected marker genes. (c) Aggregate read density (counts per 1×10⁵) at hormone marker genes: GCG (alpha), INS-IGF2 (beta), SST (delta), and PPY (gamma). (d) Spearman correlation between t-statistics of cluster-specific genes based on promoter accessibility (snATAC-seq) and gene expression (scRNA-seq). (e) Row-normalized chromVAR motif enrichment z-scores for 141 TF sequence motifs with variable enrichment across clusters (left). Cell types with multiple clusters are collapsed into a single cluster (e.g. beta 1 + beta 2 into beta). Enrichment z-scores for FOXA1 and PDX1 motifs for each cell projected onto UMAP coordinates (right). (f) Pearson correlation of TF motif enrichment z-scores between endocrine and exocrine cell types (g) FDR-corrected p-values from two-sided two sample T-tests of differential chromVAR motif enrichment comparison between delta and beta cells for 366 TF motifs. (h) Enrichment z-scores for SCRT1 and MAFB motifs in 7,598 beta and 710 delta cells projected onto UMAP coordinates (top) and shown as violin distributions (bottom; lines represent median and quartiles).
To characterize regulatory programs in each cell type, we aggregated reads for cells within each cluster and identified accessible chromatin sites for the cluster using MACS232. In total, we identified 228,873 accessible chromatin sites merged across the 12 clusters (Supplementary Data 1). We next used chromVAR33 to identify transcription factor (TF) motifs from JASPAR34 enriched within accessible chromatin of each cell. Analysis of motif enrichments averaged across cells for each cell type revealed cell type-specific patterns of motif enrichment (Figure 1e, Supplementary Table 3). For example, we observed enrichment of PDX1 in beta and delta cells35, MAF in alpha and beta cells36–38, IRF in immune cells39 and ETS in endothelial cells40 (Figure 1e). Hierarchical clustering of cell types based on motif enrichment revealed that regulatory programs of beta and delta cells were closely related as were alpha and gamma cells (Figure 1f), consistent with single cell expression data30,41,42. Motifs highly enriched in delta cell chromatin relative to beta cells included SCRT (SCRT1 -log10(FDR)=86.49) and ELF TFs (ELF5 -log10(FDR)=79.41), and motifs enriched in gamma cell chromatin relative to alpha cells included HOX (Hoxa9 -log10(FDR)=20.92) and IRF TFs (IRF1 -log10(FDR)=20.22) (Figure 1h,g, Extended Data Figure 4, Supplementary Table 4-5).
Heterogeneity in islet endocrine cell regulatory programs
A major strength of single cell approaches is the ability to reveal heterogeneity within a cell type. Indeed, our initial clustering showed that alpha, beta and delta cells segregated into sub-clusters. We identified gene promoters with variable accessibility between sub-clusters (Methods, Supplementary Data 2). Notably, INS had amongst the most variable promoter accessibility between beta cell sub-clusters (INS-IGF2 beta OR=4.74, two-sided Fisher’s exact p=1.78×10−40), and therefore for clarity we renamed the clusters INShigh and INSlow beta cells, respectively (Figure 1b,c; Figure 2a). Similarly, GCG promoter accessibility was variable between alpha cell sub-clusters (GCG alpha OR=3.67, p=3.45×10⁻²²), which we renamed GCGhigh and GCGlow alpha cells, and SST promoter accessibility was variable between delta cell sub-clusters (SST delta OR=1.86 p=0.02), which we renamed SSThigh and SSTlow delta cells (Figure 1b-c; Figure 2a).
Figure 2. Heterogeneity in endocrine cell accessible chromatin and regulatory programs.
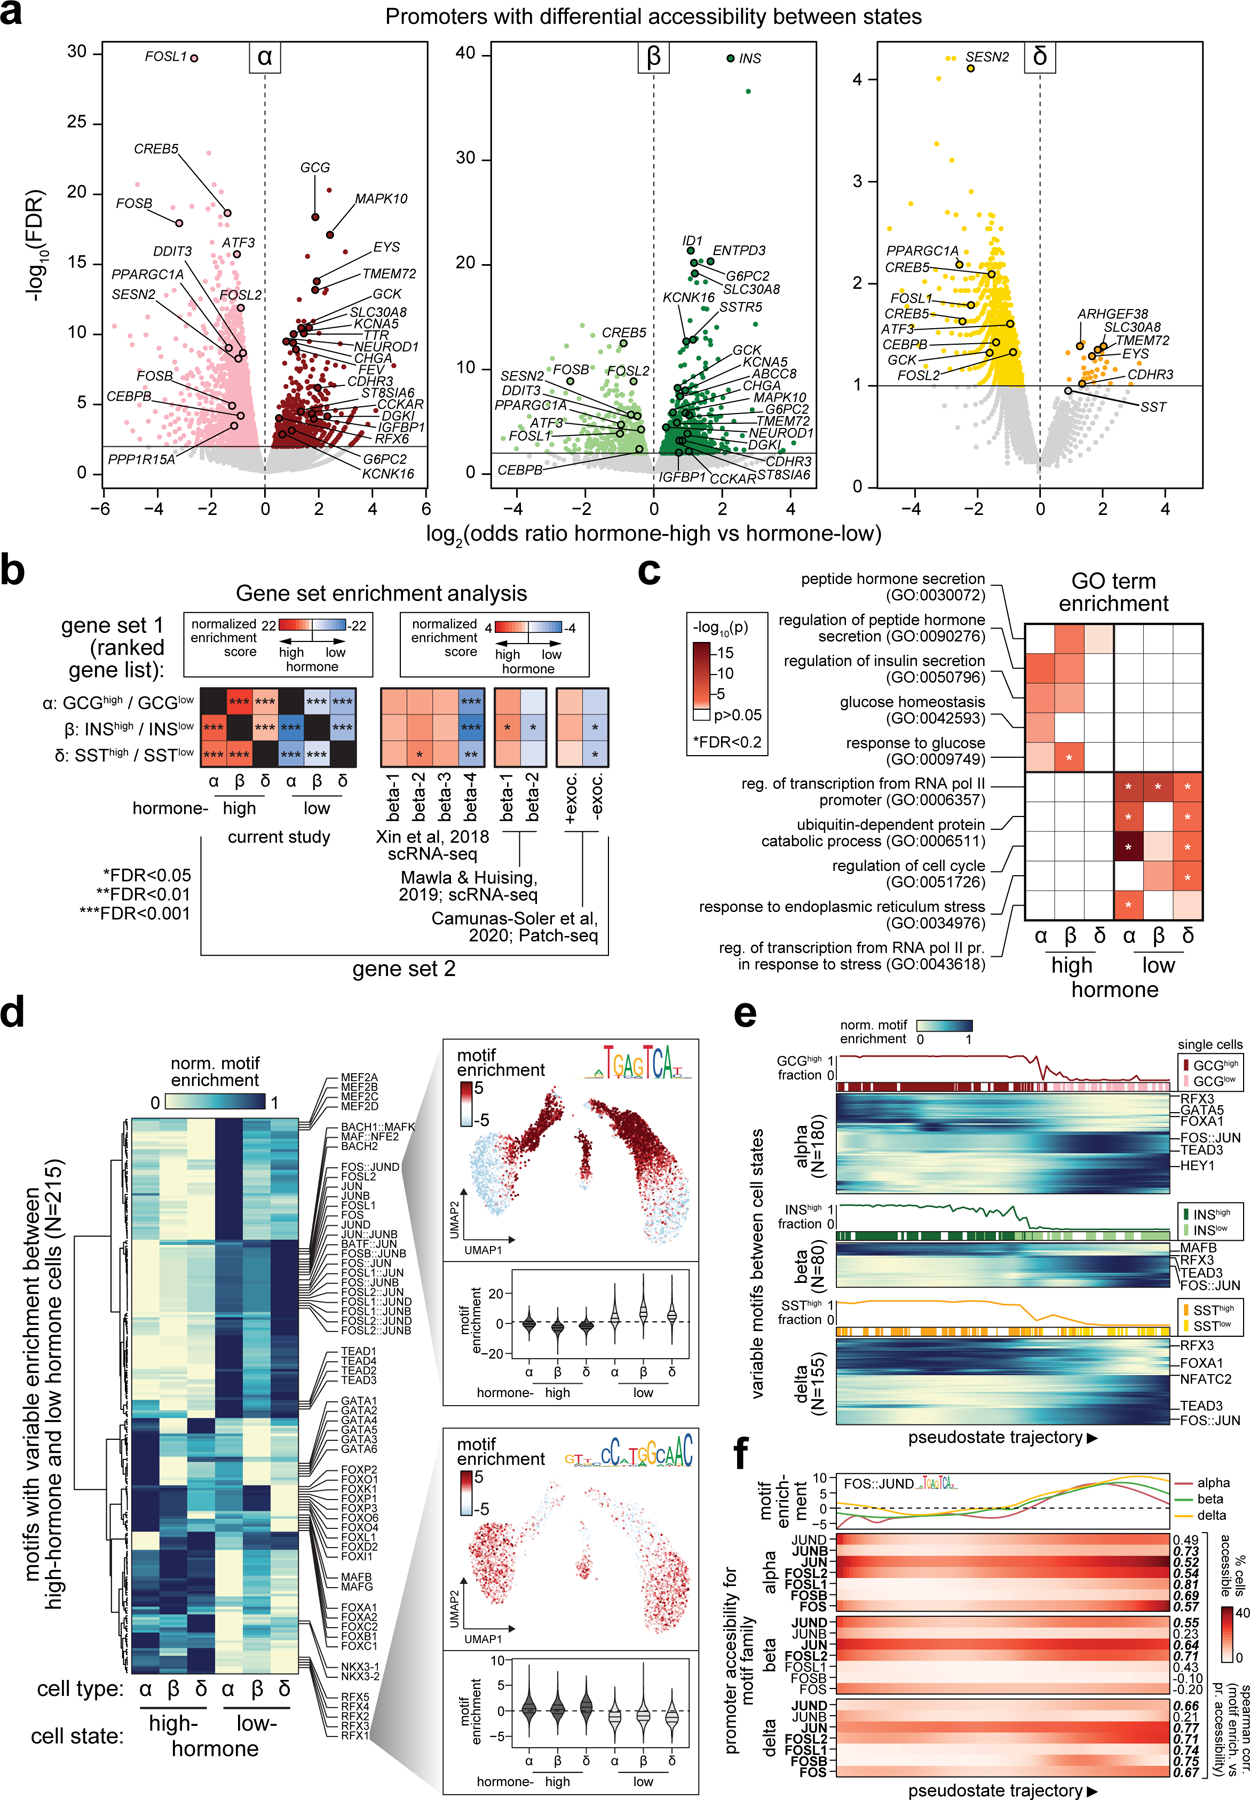
(a) Gene promoters with significantly differential chromatin accessibility between sub-clusters of alpha cells (left), beta cells (middle), and delta cells (right). (b) Enrichment of gene sets using ranked gene lists from the differential promoter analyses. Panels include genes with differential promoter accessibility between hormone-high or hormone-low states (first subpanel from left); genes expressed in beta cell sub-clusters from islet scRNA-seq (second and third subpanels); genes positively and negatively correlated with exocytosis from islet Patch-seq (fourth subpanel). (c) Enrichment of gene ontology terms related to glucose response, hormone secretion, stress response, and cell cycle among genes with differential promoter accessibility between endocrine cell states. (d) Row-normalized motif enrichments for 215 TF motifs with variable enrichment across endocrine cell states. Single cell motif enrichment z-scores for a representative RFX (RFX3) and FOS/JUN (FOS::JUN) motif are projected onto UMAP coordinates (right), and violin plots below show motif enrichment distribution within endocrine cell states (lines represent median and quartiles). (e) Ordering of alpha, beta and delta cells across pseudostate trajectories using high GCG/INS-IGF2/SST promoter accessibility as the reference point. Across each trajectory, the percentage of cells in the hormone-high state and the binary cluster call of individual cells are shown above the heatmaps, which show row-normalized motif enrichment for variable motifs between cell states. (f) Promoter accessibility for genes in the FOS/JUN motif family across pseudostate trajectories. Genes with matching promoter accessibility and motif enrichment patterns (ρ>0.5) are bolded.
We found significant overlap in the genes that distinguish hormone-high from hormone-low alpha, beta and delta cells by gene set enrichment analysis (GSEA) (Figure 2b). Genes with increased promoter accessibility in hormone-high states were enriched for hormone secretion and glucose response; in contrast, genes with increased promoter accessibility for hormone-low states were enriched for stress-induced signaling response (Figure 2a,c, Supplementary Table 6). We also observed enriched TF motifs that distinguished different states (Figure 2d, Supplementary Table 7). For example, RFX family motifs were enriched in hormone-high but not in hormone-low states (Rfx1 mean enrichment INShigh=0.36, INSlow=−0.95, p=0; GCGhigh=0.52, GCGlow=−1.16, p=7.3×10−260; SSThigh=0.76, SSTlow=−1.24, p=3.9×10−58) (Figure 2d). In contrast, FOS/JUN family motifs were prominently enriched in hormone-low but not hormone-high states (FOS::JUN mean enrichment INShigh=−1.78, INSlow=3.90, p=0; GCGhigh=−2.86, GCGlow=5.50, p=0; SSThigh=−0.21, SSTlow=7.62, p=1.1×10−121) (Figure 2d). These data reveal epigenomic differences between endocrine cell states among genes involved in hormone production and stress-induced signaling responses and point to an underlying commonality in regulatory networks that govern state-specific functions of endocrine cell types.
We next sought to determine whether the observed heterogeneity in the epigenome of endocrine cells correlated with heterogeneity in islet gene expression and function. We first compared our states to beta cell sub-clusters from a previous scRNA-seq study23. Genes with increased promoter accessibility in hormone-low cells were enriched in a beta cell sub-cluster (β-sub.4) associated with ER stress and protein folding and low INS expression, whereas genes with increased promoter accessibility in hormone-high cells were enriched in the other beta cell sub-clusters (β-sub.1–3) (Figure 2b). We further found enrichment of genes with differential promoter accessibility among gene sets preferentially expressed in beta cell sub-clusters from a recent scRNA-seq meta-analysis43 (Figure 2b). Finally, we found significant overlap in genes with differential promoter accessibility between states and genes that correlate with electrophysiological measures of beta cell function from a recent Patch-seq study44 (Figure 2b). These results thus provide a link between epigenomic heterogeneity in endocrine cells and heterogeneity in gene expression and electrophysiological function.
To explore potential gradations among endocrine cells as a continuum rather than as binary states23,45, we used Cicero8 to order cells from each cell type along trajectories based on chromatin accessibility. We observed cells on a gradient between hormone-high and hormone-low states (Figure 2e, Extended Data Figure 5a-c). These trajectories allowed us to examine gene promoter accessibility and TF motif enrichment as a function of pseudo-state (Figure 2e, Extended Data Figure 5d). Consistent with binary sub-clusters, lineage-specifying genes and TF family motif enrichments such as RFX and NFAT decreased along the trajectory from hormone-high to -low cells, whereas motif enrichment in TF families such as FOS/JUN increased (Figure 2e). Structurally-related TFs often have similar motifs, and thus to assign motifs to specific TFs we correlated promoter-accessibility of TFs within the structural subfamily with motif enrichments across the state trajectory. Motif enrichment for the FOS/JUN family correlated with the promoter accessibility of FOSL1, FOSL2 and JUN (Figure 2f), supporting a role for these specific TFs in hormone-low cell regulation.
Islet cell type enrichment for diabetes and glycemia GWAS
Genetic variants influencing diabetes and fasting glucose level are enriched in pancreatic islet regulatory elements14,17,18,46. Using our islet cell type- and state-resolved accessible chromatin profiles, we determined the enrichment of variants associated with diabetes9,47 and related quantitative phenotypes11,12,48–51 as well as other complex traits52–59. We first determined the enrichment of variants in accessible chromatin sites for each cell type and state using stratified LD score regression60–62. We observed significant enrichment (FDR<0.1) of fasting glucose (FG) level association in INShigh beta cells and T2D association for both INShigh and INSlow beta cell states (FG INShigh Z=3.58 FDR=0.013; T2D INShigh Z=4.41 FDR=0.001, INSlow Z=4.19 FDR=0.002) (Figure 3a). We also observed more nominal evidence for enrichment of T2D association for GCGlow alpha cells and both delta cell states, as well as multiple glycemic traits for endocrine cells (Figure 3a).
Figure 3. Enrichment of islet accessible chromatin for diabetes and fasting glycemia.
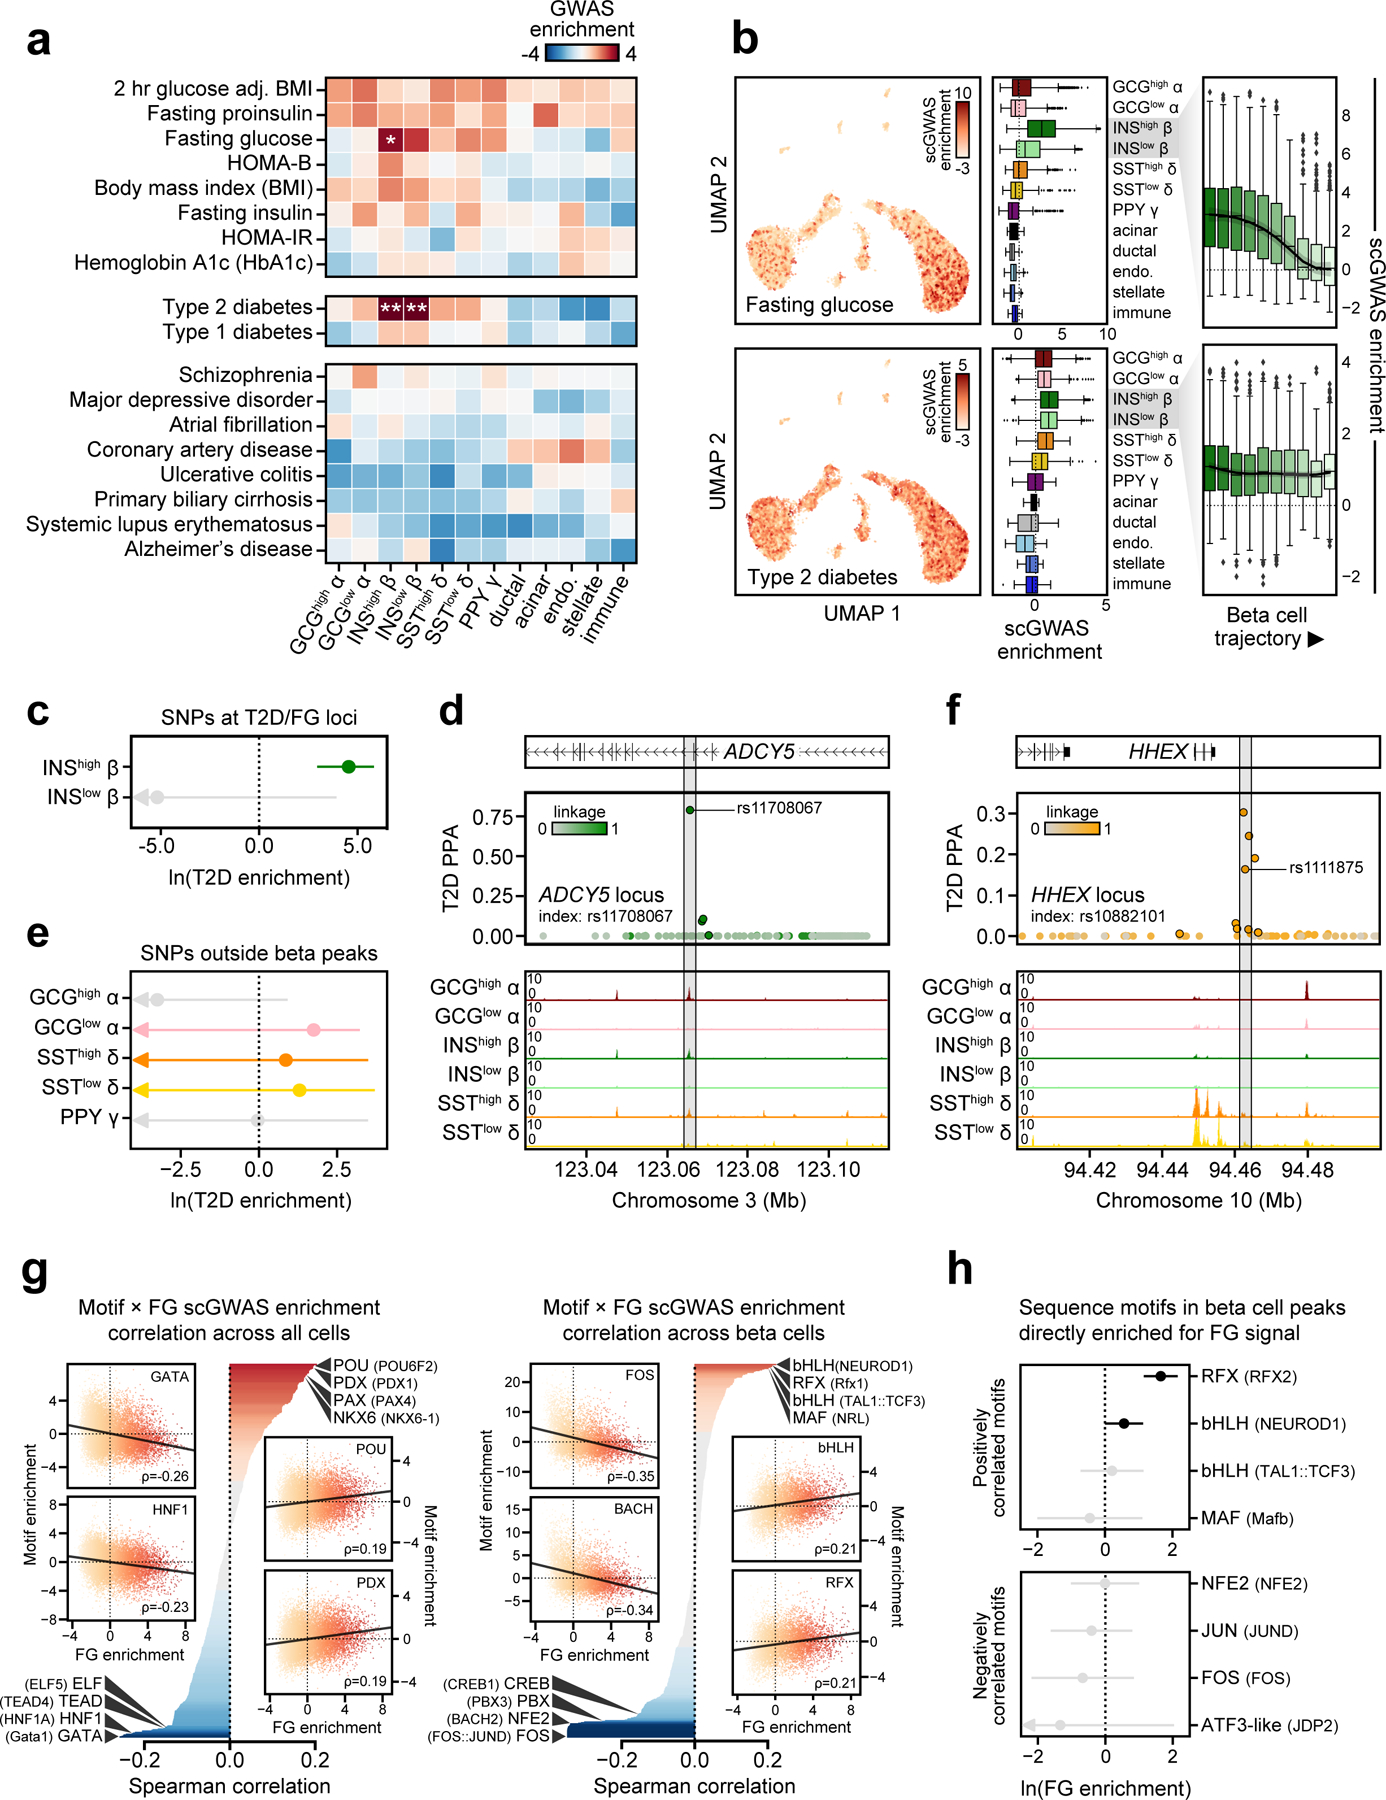
(a) Stratified LD score regression enrichment z-scores for diabetes-related quantitative endophenotypes (top), type 1 and 2 diabetes (middle), and control traits (bottom) for islet cell types. **FDR<0.01 *FDR<0.1. (b) Single cell enrichment z-scores for fasting glucose level (FG) and T2D projected onto UMAP coordinates (left), enrichment per cell type (middle panels), and beta cell enrichment split into 10 trajectory bins (right). Boxplot center line, limits, and whiskers represent median, quartiles, and 1.5 interquartile range respectively. (c) Enrichment (estimate ± 95% CI by fgwas) of variants at loci associated with both T2D and FG (T2D/FG) within beta cell accessible chromatin. (d) Candidate causal T2D variant rs11708067 overlaps an enhancer active in INShigh beta cells at the ADCY5 locus, consistent with beta cell enrichment patterns for T2D/FG loci. (e) Enrichment (estimate ± 95% CI by fgwas) of variants at T2D loci in accessible chromatin for non-beta endocrine cells after removing beta accessible chromatin. (f) Candidate causal T2D variant rs1111875 overlaps a delta cell-specific site at the HHEX locus. (g) Correlation between single cell FG and TF motif enrichments across all 14.2k cells (left) and 7.2k beta cells (right). Across all cells, FG has positive correlations with beta-enriched TF families such as PDX, NKX6 and PAX. Within beta cells, FG has positive correlations with INShigh beta-enriched TF families such as RFX, MAF/NRL, and FOXA. (h) Enrichment (effect±SE) of FG-associated variants directly overlapping sequence motifs for those either positively or negatively correlated with FG in beta cells.
In these analyses, we observed differences in enrichments between INShigh and INSlow beta cells for fasting glucose (Figure 3a). To further resolve the heterogeneity of genetic association enrichment, we tested enrichment of T2D and fasting glucose as well as several negative control traits within single cell profiles (Figure 3b, Extended Data Figure 6a). We observed marked heterogeneity among beta cells for fasting glucose-associated variants, where INShigh cells had significantly stronger enrichment (INShigh median Z=2.58, INSlow median Z=0.68, p=1.19×10−225) (Figure 3b). We further calculated the average enrichment for cells binned across ‘pseudostate’ (Figure 2), which revealed decreasing enrichment from INShigh to INSlow beta cells (Figure 3b). In contrast, for T2D we observed consistent enrichment across INShigh and INSlow beta cells (INShigh median Z=0.93, INSlow median Z=0.91, p=0.44) (Figure 3b). As many variants affecting fasting glucose also affect T2D12,13,63, we grouped T2D loci associated with fasting glucose (‘T2D/FG’ loci) and tested these loci for enrichment of INShigh and INSlow beta cell sites using fgwas64. We observed strong enrichment of T2D/FG loci for INShigh beta cells only (INShigh beta ln(enrichment)=4.54, INSlow beta ln(enrichment)=−25.7), suggesting that T2D loci affecting glucose levels have state-specific effects (Figure 3c). For example, at the ADCY5 locus associated with both fasting glucose and T2D, variant rs11708067:A>G (PPA=0.79) overlapped a site specific to INShigh beta cells (Figure 3d).
Outside of beta cells we also observed evidence for enrichment of T2D association for variants in chromatin sites for other endocrine cell states including GCGlow alpha cells and SSThigh and SSTlow delta cells (Figure 3a). In order to understand the potential role of these cell states in T2D risk, we performed additional enrichment analysis at known T2D risk loci using fgwas64. We tested alpha, delta and gamma sites not overlapping beta cell sites for enrichment at fine-mapped T2D loci from DIAMANTE. Here we again observed enrichment of T2D association for GCGlow alpha cells (ln(enrichment)=1.75) as well as SSThigh and SSTlow delta cells (ln(enrichment)=0.86, 1.30) (Figure 3e). In further support of the likely role of these cell types in T2D, several fine-mapped risk variants overlapped sites specific to these cell types; for example, rs1111875:C>T (PPA=0.16) mapped in a delta cell-specific site at the HHEX locus (Figure 3f).
Given our ability to map both complex trait and TF motif enrichments to single cells, we reasoned that joint analysis could provide insight into TFs regulating trait-relevant chromatin. We correlated single cell fasting glucose and T2D enrichment z-scores with TF motif enrichments from chromVAR33. Across all 15.3k cells, we observed positive correlation between fasting glucose and T2D enrichment and motifs for beta cell TFs such as PDX (Figure 3g, Extended Data Figure 6b, Supplementary Table 9). Across the 7.6k beta cells only, we observed strongest positive correlation between fasting glucose and motifs in TF families enriched for INShigh beta cells such as bHLH (NEUROD1 ρ=0.21, p=9.43×10−78) and RFX (Rfx1 ρ=0.21, p=8.83×10−74) (Figure 3g, Supplementary Table 9). For T2D, strongest positive correlations included motifs for TF families such as RFX (Rfx1 ρ=0.052, p=3.72×10⁻⁹), NFAT (NFATC2 ρ=0.047, p=4.69×10⁻⁵), and MEF2 (MEF2A ρ=0.062, p=6.99×10⁻⁸) (Extended Data Figure 6b, Supplementary Table 9). We further determined whether TF motifs preferentially harbored associated variants directly. For fasting glucose, we identified strongest enrichment for INShigh state-specific TF motifs, most notably RFX (RFX2 p=1.3×10⁻¹⁰) and NEUROD (p=0.049). For T2D, we observed enrichment for TF motifs positively correlated with T2D association including RFX (Rfx1 p=4.0×10⁻¹⁵), NFAT (NFATC2 p=2.2×10⁻⁴), and MEF2 (MEF2D p=1.9×10⁻³) (Extended Data Figure 6c). These motifs remained significantly enriched for T2D when considering only variants predicted to disrupt the motif (Rfx1 p=1.1×10⁻⁹, NFATC2 p=2.2×10⁻⁴, MEF2D p=7.7×10⁻⁵).
Together these results provide state-resolved insight into the role of beta cells and their TFs in both T2D risk and fasting glucose level and implicate other endocrine cell types in T2D risk.
Predictions of variant effects on islet cell type chromatin
Predicting the effects of non-coding genetic variants on regulatory activity remains a major challenge, in large part because the sequence vocabularies that encode regulatory function differ between cell types and states. We therefore used deltaSVM65 to predict the effects of genetic variants from the Haplotype Reference Consortium panel66 on chromatin accessibility in each endocrine cell type and cell state. We identified 432,072 variants genome-wide with predicted allelic effects (FDR<0.1), encompassing between 115k-161k variants (7.8%−10.9% of tested variants) per cell type or state (Figure 4a, Supplementary Data 3).
Figure 4. Genetic variants with islet cell type- and state-specific effects on chromatin accessibility.
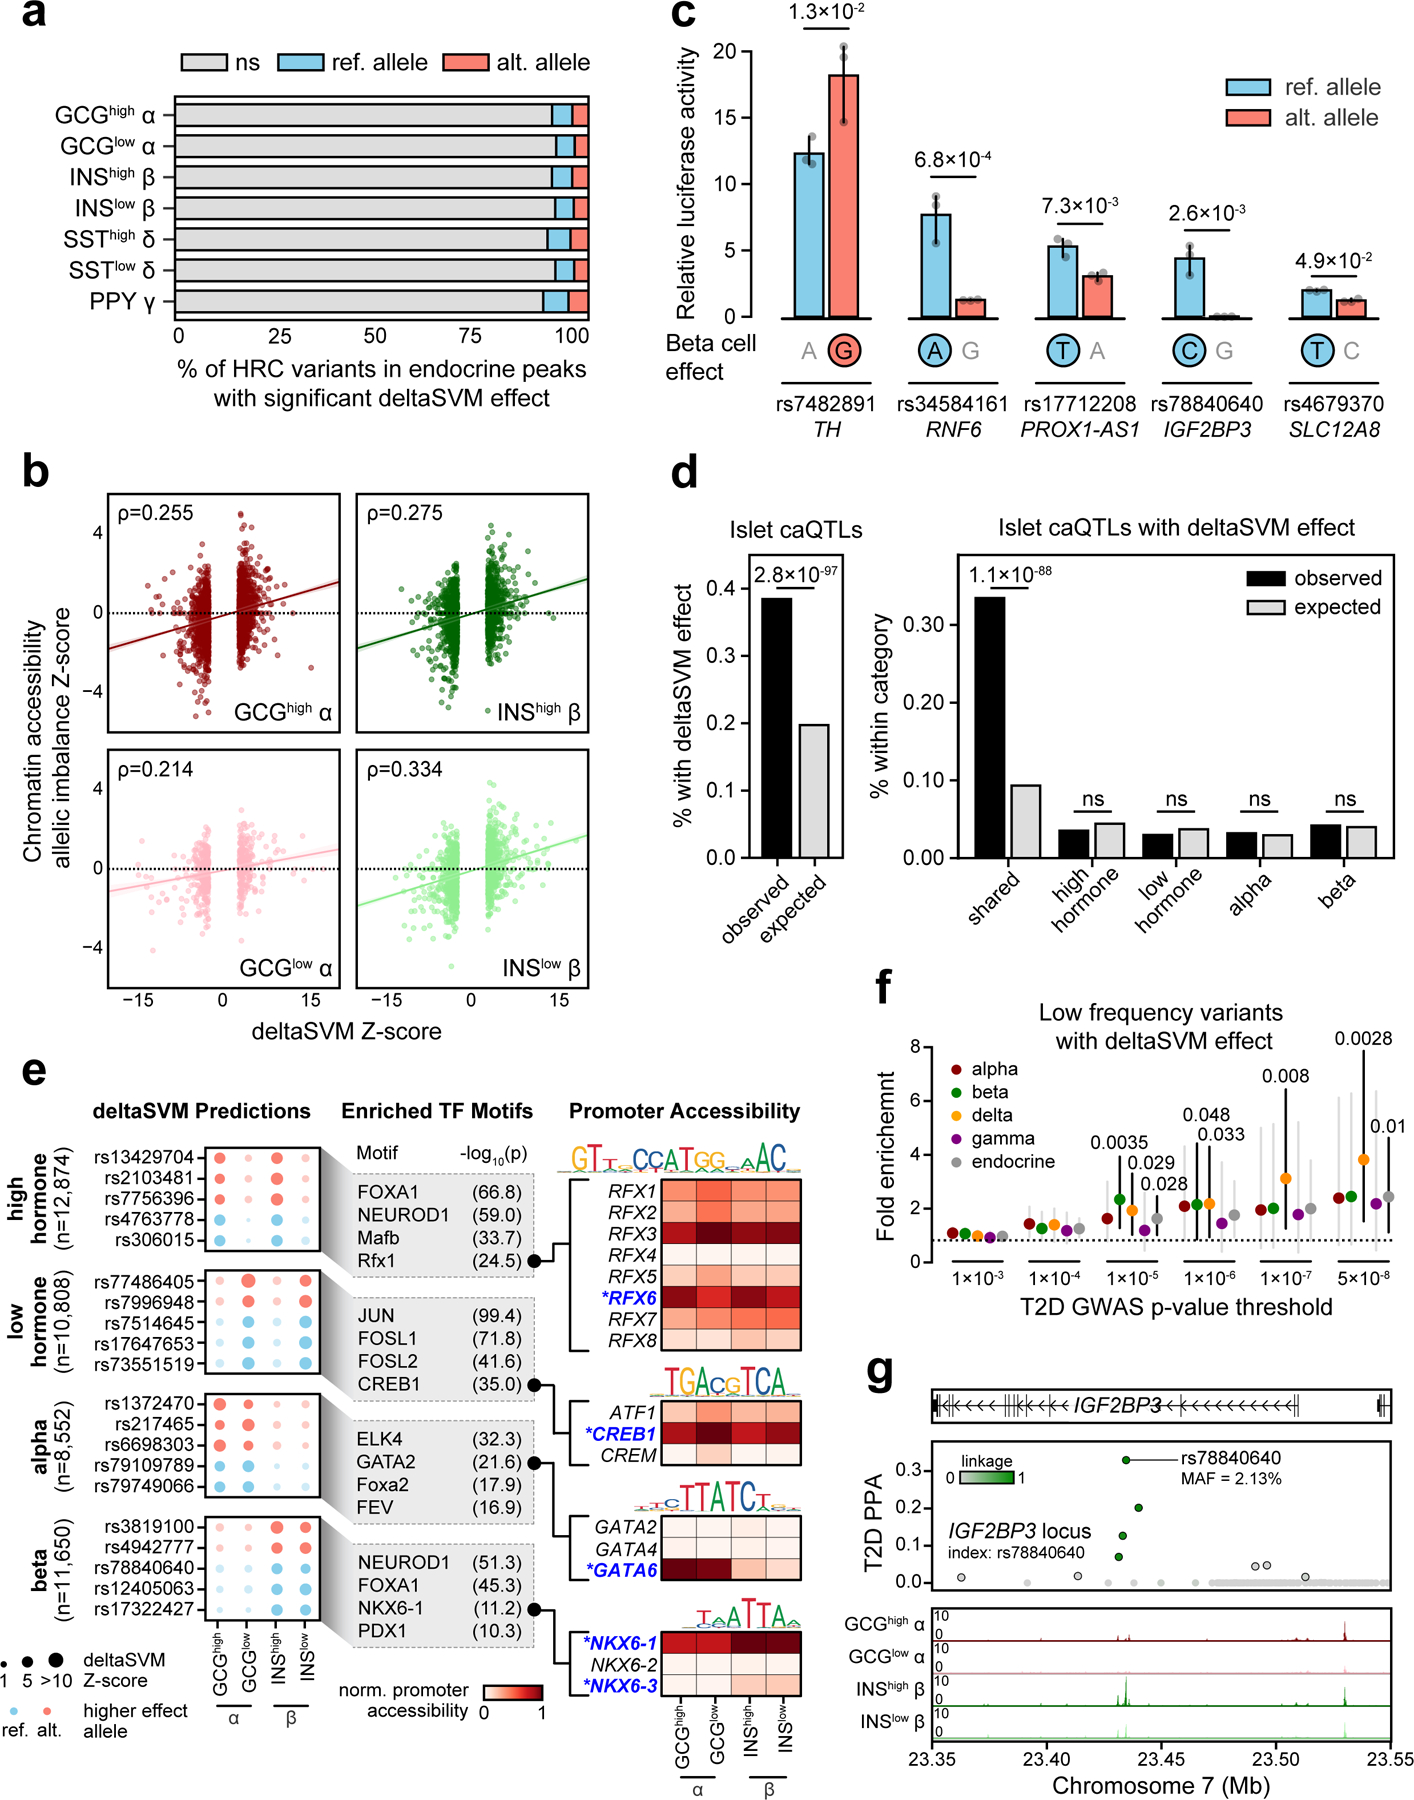
(a) Percentage of HRC variants in any endocrine cell type peak (n=1,411,387 variants) that had significant deltaSVM effects (FDR<0.1) for the reference (ref.) or alternative (alt.) allele. (b) Spearman correlation between deltaSVM Z-score and chromatin accessibility allelic imbalance Z-scores for variants with predicted effects in alpha and beta states. (c) Relative luciferase reporter activity (mean ± 95% CI; n=3 replicates) for five T2D variants with predicted beta cell effects. The allele with predicted effect is circled. p-values by two-sided Student’s T-tests. (d) Enrichment of islet caQTLs for variants with predicted effects in alpha and beta cells (left) and stratified based on shared, cell type- and state-specific effects (right). p-values by two-sided Fisher’s exact test, ns, not significant. (e) Examples of variants with predicted effects in alpha and beta cells (left). TF motif families enriched in sequences surrounding the effect allele relative to the non-effect allele (middle). Promoter accessibility patterns for genes in enriched TF motif families (right). Genes with matching promoter accessibility and TF motif enrichment patterns are highlighted. (f) Enrichment (estimate ± 95% CI) of low frequency and rare variants with predicted effects on islet chromatin at different T2D association thresholds. p-values by two-sided binomial test. (g) Low-frequency T2D variant rs78840640 at the IGF2BP3 locus with high causal probability (PPA=0.33) has predicted effects in beta cells.
To validate that our predictions captured true allelic effects on islet chromatin accessibility, we first compared alpha and beta cell predictions to direct measurements of allelic effects on chromatin accessibility. We found significant correlations between predicted allelic effects and allelic imbalance estimates for all alpha and beta cell states (GCGhigh Spearman ρ=0.255, p=1.20×10⁻³⁴, GCGlow ρ=0.214, p=2.35×10⁻⁷, INShigh ρ=0.275, p=1.03×10⁻³⁴, INSlow ρ=0.334, p=4.73×10−38) (Figure 4b). We further validated five likely causal T2D variants predicted to affect beta cell chromatin which had directionally consistent effects on enhancer activity using gene reporter assays in the MIN6 beta cell line (Figure 4c). We also compared predictions to islet chromatin accessibility quantitative trait loci (caQTLs)28, and observed significant enrichment of caQTLs among variants with predicted effects in alpha or beta cells (observed=38.4%, expected=19.7%, two-sided Fisher’s exact p=2.78×10−97) (Figure 4d). When sub-dividing predictions based on shared, cell type-specific or state-specific effects we observed significant enrichment of caQTLs only among shared effect variants (Figure 4d).
We further characterized genetic variants predicted to have cell type- and state-dependent effects on islet chromatin. Variants with state-specific effects tended to disrupt motifs for TF families such as NEUROD and RFX for hormone-high states (-log10(p)=59.0, 24.5) (Figure 4e). Similarly, variants with alpha or beta cell-specific effects tended to disrupt motifs for lineage-defining TF families including GATA for alpha cells (-log10(p)=21.6), and NKX6 and PDX1 for beta cells (-log10(p)=11.2, 10.3) (Figure 4e). To assign motifs to specific TFs, we examined promoter-accessibility of TFs within the structural TF subfamily67. Among GATA subfamily members only GATA6 had high promoter accessibility in alpha cells (GCGhigh=1.00, GCGlow=0.96, INShigh=0.22, INSlow=0.14), suggesting that GATA6 binding is likely disrupted in alpha cells. Similarly, among RFX family members RFX6 had promoter accessibility in hormone-high state cells (GCGhigh=0.92, GCGlow=0.70, INShigh=0.93, INSlow=0.80) (Figure 4e).
We evaluated whether our predictions could prioritize lower frequency (defined as minor allele frequency MAF<0.05) functional variants involved in T2D risk. We observed enrichment of genome-wide significant T2D associations among lower frequency variants with predicted effects in any endocrine cell type compared to background (Figure 4f). When considering each cell type, we observed enrichment of T2D association among variants with predicted effects in beta and delta cells, even at sub-genome-wide significant p-values (Figure 4f). For example, at the IGF2BP3 locus, rs78840640:C>G (MAF=0.02) had allelic effects on beta cell chromatin (INShigh beta FDR=1.15×10⁻⁴; INSlow beta FDR=6.93×10⁻³), and fine-mapping supported a causal role in T2D (PPA=0.33) (Figure 4g). This variant affected enhancer activity in gene reporter assays where the alternate (and T2D risk) allele G had reduced activity (Figure 4c). These results reveal that cell type-specific chromatin can provide accurate functional predictions of lower frequency variants.
Co-accessibility links regulatory variants to target genes
Defining the genes affected by regulatory element activity remains a major challenge, as enhancers can regulate gene activity over large, non-adjacent distances68. A number of approaches have been developed to link regulatory elements to target genes69,70, but are not typically cell type-resolved27,71. Recently, a new approach was developed to link regulatory elements at cell type resolution based on co-accessibility across single cells8. We thus leveraged single cell accessible chromatin profiles to define co-accessibility between accessible chromatin sites in alpha, beta and delta cells.
To calibrate the extent to which co-accessibility reflected physical interactions between regulatory elements, we performed a distance-matched comparison between co-accessible sites stratified by co-accessibility threshold and chromatin loops identified from Hi-C and promoter capture Hi-C (pcHi-C) in primary islets27,71. We observed strong enrichment for sites with co-accessibility scores >0.05 for islet chromatin loops compared to non-co-accessible sites (Figure 5a, Extended Data Figure 7a-e). We therefore used this threshold (0.05) to define co-accessible sites (Supplementary Data 4-6). Among co-accessible sites were 47,871 (alpha), 46,036 (beta) and 42,234 (delta) distal sites co-accessible with a gene promoter (Extended Data Figure 7f-g), and the majority (71.9%) were cell type-specific (Extended Data Figure 8a-c). For example, the PDX1 promoter was co-accessible with 31 sites in beta and 39 sites in delta cells, including sites that directly coincided with islet pcHi-C, only 7 of which were in alpha cells (Figure 5b).
Figure 5. Chromatin co-accessibility links diabetes risk variants to target genes.
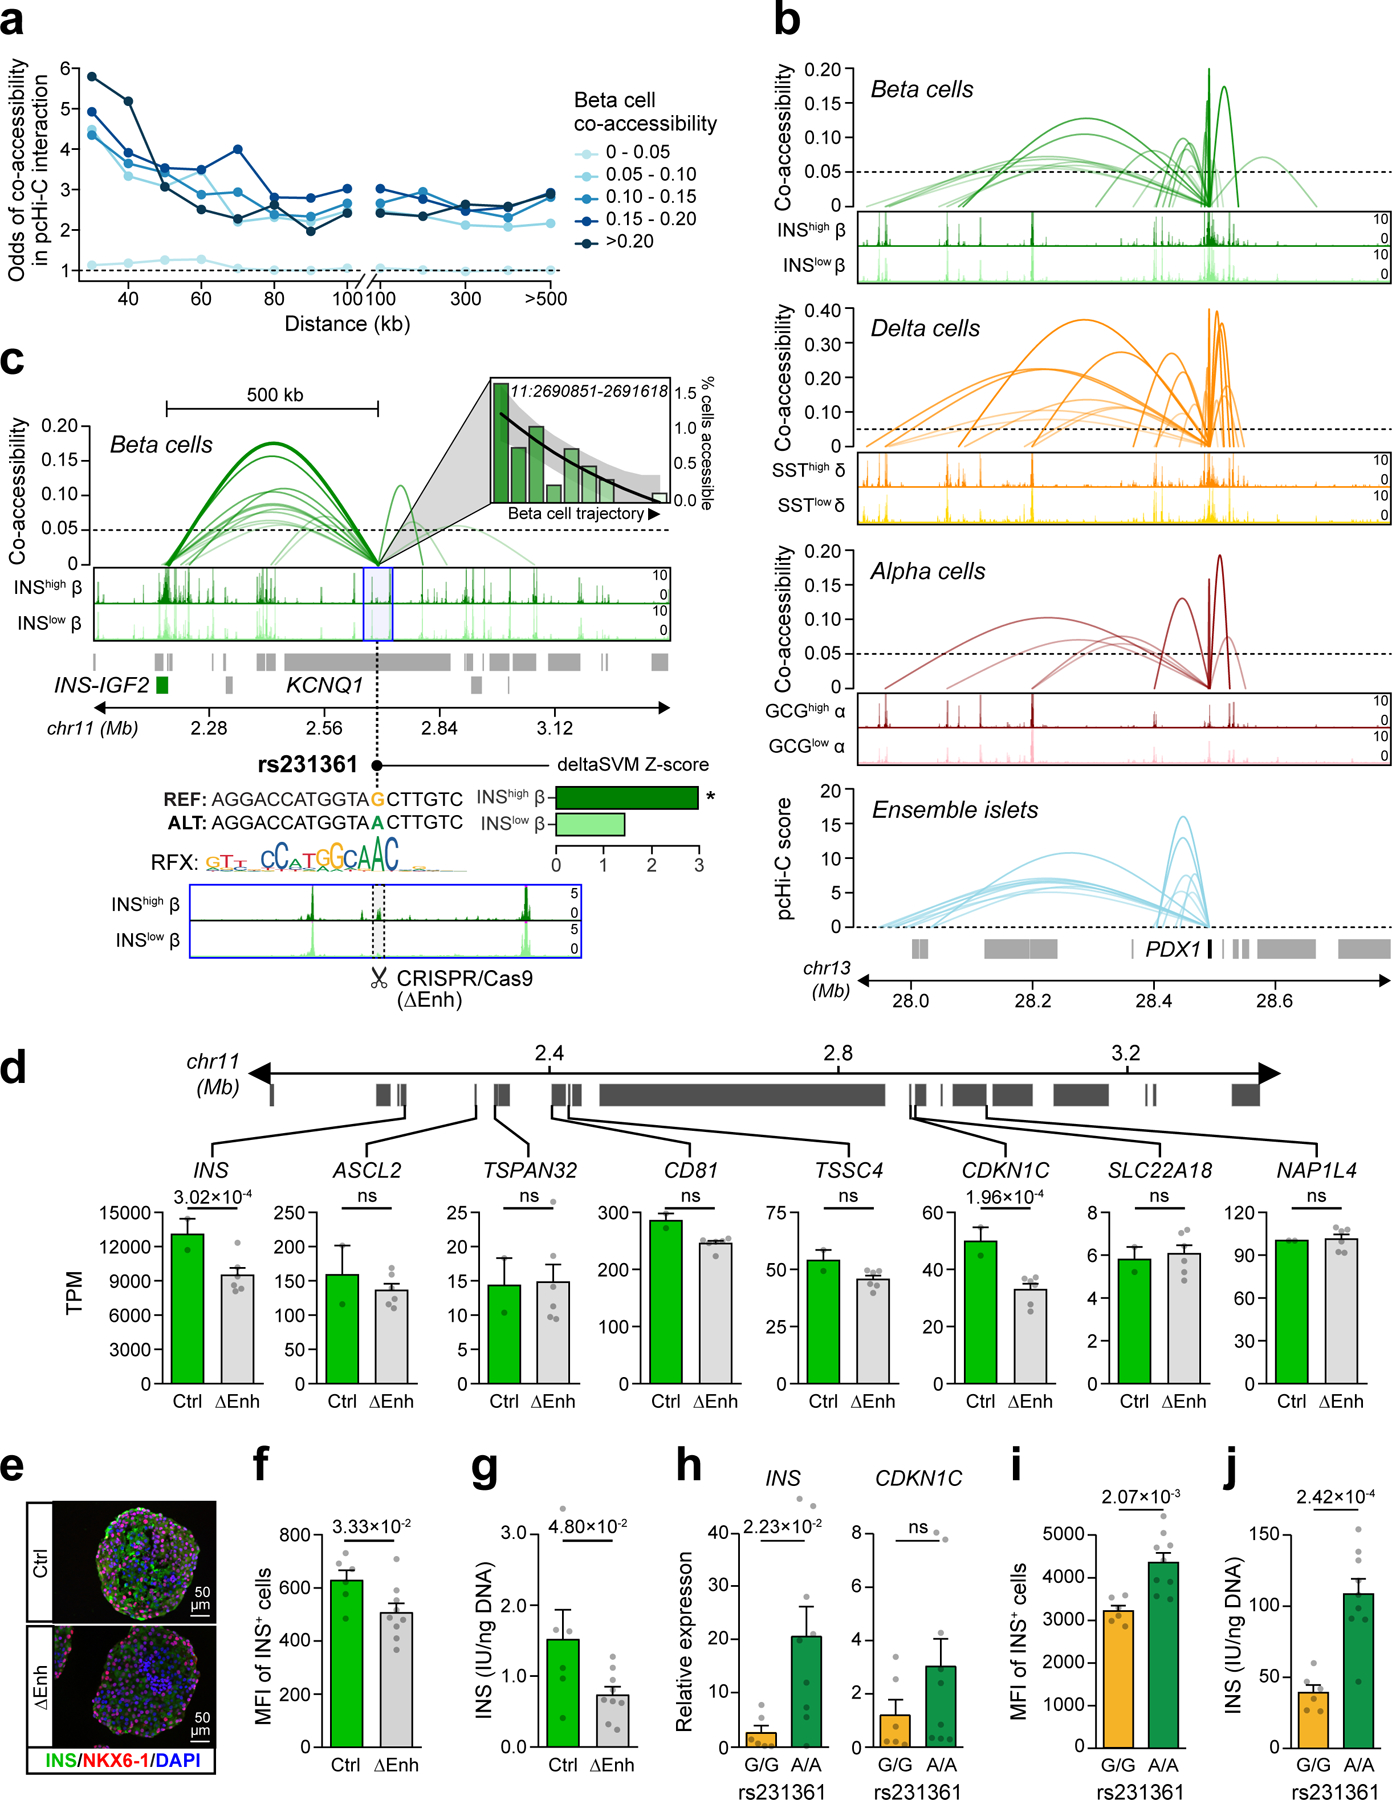
(a) Distance-matched odds that co-accessible sites in beta cells overlap islet pcHi-C interactions at different threshold bins. (b) Single cell co-accessibility and islet pcHi-C interactions at the PDX1 promoter. (c) Enhancer harboring T2D variant rs231361 shows distal beta cell co-accessibility to the INS promoter and other non-promoter sites. The enhancer is accessible in INShigh but not INSlow beta and has decreasing accessibility across the beta cell trajectory. rs231361 disrupts an RFX motif and has predicted effects in INShigh beta. *FDR<0.1. CRISPR/Cas9 deletion of a 2.6 kb region (highlighted, ∆Enh) around the enhancer. (d) Expression (transcripts per million, TPM±SEM) of genes within 2 Mb of the enhancer in beta cell stage cultures for ∆Enh (n=6; 3 clones × 2 differentiations) and control (n=2; 1 clone × 2 differentiations), p-values from DESeq2, ns not significant. (e) Representative immunofluorescence staining for INS (green), NKX6–1 (red), and DAPI (blue) in beta cell stage cultures for ∆Enh (n=3 independent experiments) and control (n=3 experiments) (f) Quantification of INS median fluorescence intensity (MFI) and (g) INS content in beta cell stage cultures for ∆Enh (n=9; 3 clones × 3 differentiations) and control (n=6; 2 clones × 3 differentiations). (h) Relative expression of INS and CDKN1C, (i) Quantification of INS MFI, and (j) INS content in beta cell stage cultures for KCNQ1A/A (n=9; 3 clones × 3 differentiations) and KCNQ1G/G (n=6; 2 clones × 3 differentiations). Data shown are mean±SEM, p-values by two-sided Student’s T-test, ns, not significant.
Distal sites with co-accessibility links to gene promoters harbored risk variants for T2D at many loci. At the KCNQ1 locus, an islet chromatin site located in intron 3 of KCNQ1 had beta cell-specific co-accessibility with the INS promoter over 500 kb distal and harbored a causal T2D variant rs231361:G>A (PPA=1) (Figure 5c). The site containing rs231361 was more accessible in INShigh compared to INSlow beta cells, and rs231361 was predicted to have state-specific effects on beta cell chromatin accessibility (INShigh beta FDR=0.060; INSlow beta FDR=0.40). Furthermore, rs231361 disrupted an RFX motif, which itself was enriched in INShigh beta cells (Figure 5c). Published 4C data from the EndoC-βH1 human beta cell line72 revealed physical proximity between this site and the INS promoter (Extended Data Figure 9), but there was not similar evidence in Hi-C or other 3C-based data from EndoC-βH1 and primary islets27,71,73.
Although we observed physical proximity between rs231361 and the INS promoter in beta cells, the absence of a canonical chromatin loop necessitated further validation. We therefore deleted a 2.6 kb region flanking the site in hESCs by CRISPR/Cas9-mediated genome editing in three bi-allelic clones (KCNQ1∆Enh) (Figure 5c, Extended Data Figure 10a,b), and differentiated KCNQ1∆Enh clones and unedited control clones into beta cells using a modified version of an established protocol74. Analysis of cultures at the beta cell stage revealed similar numbers of INS+/NKX6–1+ cells in KCNQ1∆Enh and control clones (47.1±13.4% vs 56.5±7.6%) (Extended Data Figure 10c), suggesting that the enhancer deletion had no effect on beta cell differentiation. We determined effects of the enhancer deletion on expression of all genes within 2 Mb of the enhancer and observed a significant decrease in the expression of INS (p=3.02×10⁻⁴; FDR=0.066) and CDKN1C (p=1.96×10⁻⁴; FDR=0.059) in KCNQ1∆Enh compared to control cells, and not for other genes (all P>.05) (Figure 5d). Analysis of INS protein levels by immunofluorescence staining, flow cytometry, and ELISA further revealed reduced INS protein abundance in KCNQ1∆Enh beta cells (Figure 5e-g).
To next determine whether rs231261 itself had distal effects on INS regulation in beta cells, we used targeted base editing to generate hESC lines that were homozygous for either the major allele G (KCNQ1G/G, two clones) or the minor (and T2D risk) allele A (KCNQ1A/A, three clones) (Extended Data Figure 10d-f). We then differentiated the KCNQ1A/A and KCNQ1G/G clones into beta cells using the same protocol as for KCNQ1∆Enh with additional modifications. We determined effects of the variant alleles on expression of the two genes INS and CDKN1C with significant changes in the enhancer deletion (in Figure 5d) using qPCR. We observed a significant difference in INS expression between alleles (p=0.022), as well as evidence for a difference in CDKN1C expression although this was not significant (p>0.05) (Figure 5h). Analysis of insulin protein levels by flow cytometry and ELISA revealed significant differences in insulin abundance between variant alleles (Figure 5i,j).
DISCUSSION
Over 400 known risk signals for T2D have been identified, yet only a handful have been characterized molecularly16,17,27,75–81. Our findings provide a roadmap demonstrating how single cell accessible chromatin derived from disease-relevant primary tissue can be utilized to define cell types, cell states, cis regulatory elements and genes involved in the genetic basis of T2D and other complex disease.
The KCNQ1 locus has a complex contribution to T2D involving at least 10 independent signals9. Among these was causal T2D variant rs231361, where genome editing in hESC beta cell models revealed effects on insulin transcript and protein levels. Chromatin conformation from 4C in EndoC-βH1 cells72 revealed physical proximity between the enhancer and INS promoter, although we did not find corresponding evidence for an interaction in other 3C-based data from EndoC-βH1 cells73, hESC beta cells or primary islets27,71. Thus, while our results support a possible cis-regulatory effect of rs231361 on INS expression, we cannot currently rule out that the observed effects instead occur in trans, secondary to other effects. We anticipate that future studies to resolve phase between variant alleles and INS allelic expression in heterozygous samples will further clarify the nature of these effects.
Single cell accessible chromatin uncovered heterogeneity in the regulatory programs of endocrine cell types, pointing to TFs that likely drive cell state-specific functions. Integrating single cell heterogeneity with large-scale genetic association data revealed that genetic variants modulating fasting glucose levels likely act through the high insulin-producing beta cell state, whereas genetic risk of T2D is mediated through effects on both the high insulin-producing state and other functional beta cell state(s) likely related to stress and signaling responses. Moreover, given similar heterogeneity in the epigenomes of alpha and delta cells, our results reveal that endocrine cell regulation involves both lineage-specific programs as well as an additional layer of state-specific programs common across endocrine cell types. Our results also implicate these other endocrine cell types in genetic risk of T2D independent of beta cells, most prominently delta cells.
Previous studies have characterized heterogeneity in beta cell physiological function, cell surface markers, and gene expression22,44,82–84. We found that heterogeneity in the beta cell epigenome mapped to cellular states related to insulin production and stress-related signaling response and was tightly linked to heterogeneity in beta cell gene expression23 and electrophysiology44. However, there is often not perfect correspondence between sub-clusters identified by different techniques and/or studies, and we anticipate that using multi-omic methods will help to further clarify these differences. Regardless of the technology used, heterogeneity defined from single cell data is by nature dependent on computational clustering or ordering. Separating true heterogeneity from other sub-structure therefore ultimately requires experimental validation, for example by profiling cell populations sorted using sub-type markers. As the sub-clusters described in our study have not been linked directly to functional differences, experiments will be necessary to determine the relationship between epigenomic heterogeneity and cellular function. Furthermore, while we observed heterogeneity in endocrine cells from cryopreserved tissue in addition to purified islets, determining the true extent and nature of heterogeneity in vivo will require more extensive studies across a broader range of samples and conditions.
In summary, here we present a detailed characterization of islet cell type and state regulatory programs. When combined with genetic fine-mapping and whole genome sequencing, as well as additional cell type-specific data in islets85, this resource will greatly enhance efforts to define molecular mechanisms of T2D risk. More broadly, our study provides a framework for using single cell chromatin from disease-relevant tissues to interpret the genetic mechanisms of complex disease.
ONLINE METHODS
Islet processing and nuclei isolation
We obtained islet preparations for three donors from the Integrated Islet Distribution Program (Supplementary Table 1). Islet preparations were further enriched using zinc-dithizone staining followed by hand picking. For experiments performed with whole pancreas tissue, a cryopreserved tissue sample was obtained from the Network for Pancreatic Organ Donors with Diabetes (nPOD) biorepository. Studies were given exempt status by the Institutional Review Board (IRB) of the University of California San Diego.
Generation of snATAC-seq libraries
Combinatorial barcoding single nucleus ATAC-seq was performed as described previously2,4 with several modifications (described in Supplementary Note). Libraries were quantified using a Qubit fluorimeter (Life technologies) and the nucleosomal pattern was verified using a Tapestation (High Sensitivity D1000, Agilent). Libraries were sequenced on a HiSeq 2500 sequencer (Illumina) using custom sequencing primers, 25% spike-in library and following read lengths: 50+43+40+50 (Read1+Index1+Index2+Read2).
Pancreas tissue preparation is described in the Supplementary Note. Droplet-based single cell ATAC-seq libraries were generated using the Chromium Chip E Single Cell ATAC kit (10x Genomics, 1000086) and indexes (Chromium i7 Multiplex Kit N, Set A, 10x Genomics, 1000084) following manufacturer instructions. Final libraries were quantified using a Qubit fluorimeter (Life Technologies) and the nucleosomal pattern was verified using a Tapestation (High Sensitivity D1000, Agilent). Libraries were sequenced on a NextSeq 500 and HiSeq 4000 sequencer (Illumina) with following read lengths: 50+8+16+50 (Read1+Index1+Index2+Read2).
Raw data processing and quality control
For each read, we first appended the cell barcode metadata to the read name. The cell barcode consisted of four pieces (P7, I7, I5, P5) which were derived from the index read files. We first corrected for sequencing errors by calculating the Levenshtein distance between each of the four pieces and a whitelist of possible sequences. If the piece did not perfectly match a whitelisted sequence, we took the best matching sequence if it was within 2 edits and the next matching sequence was at least 2 additional edits away. If none of these conditions were met, we discarded the read from further analyses. Sequence processing steps provided in the Supplementary Note.
Cluster analysis for snATAC-seq
We split the genome into 5 kb windows and removed windows overlapping blacklisted regions (v2) from ENCODE86,87. For each experiment, we created a sparse m x n matrix containing read depth for m cells passing read depth thresholds at n windows. Using scanpy88 (v.1.4.4.post1), we extracted highly variable windows using mean read depth and normalized dispersion (‘min_mean=0.01, min_disp=0.25’). After normalization to uniform read depth and log-transformation, for each experiment, we regressed out the log-transformed read depth within highly variable windows for each cell. We then performed principal component analysis (PCA) and extracted the top 50 principal components. We used Harmony24 to correct the principal components and remove batch effects across experiments, using donor-of-origin as a covariate. We used Harmony-corrected components to calculate the nearest 30 neighbors using the cosine metric, which were subsequently used for UMAP dimensionality reduction (‘min_dist=0.3’) and Leiden clustering89 (‘resolution=1.5’).
We performed iterative clustering to identify and remove cells with abnormal features prior to the final clustering results (see Supplementary Note). After removing these cells, we ended up with 15,298 cells mapping to 12 clusters. We used chromatin accessibility at windows overlapping promoters for marker hormones to assign cell types for the endocrine islet cell types and chromatin accessibility at windows around marker genes from scRNA-seq to assign cluster labels for non-endocrine islet clusters.
Comparison to bulk and sorted islet ATAC-seq
We processed sequence data of bulk islet ATAC-seq14,27–29 and bulk pancreas from ENCODE86 (see Supplementary Note). We calculated the Spearman correlation between normalized read coverages and used hierarchical clustering to assess similarity between bulk islet samples. To check peak call overlap between aggregated snATAC-seq and bulk ATAC-seq, we split peaks based into promoter proximal (±500 bp from TSS) and distal peaks based on promoter overlap. For each cluster, we calculated the percentage of aggregate peaks that overlapped merged autosomal bulk peaks and individual sample-level autosomal bulk peaks. We processed raw sequence data of ATAC-seq from flow-sorted pancreatic cells from two prior studies90,91 (see Supplementary Note). We calculated Spearman correlations between read coverages and used hierarchical clustering to assess similarity between sorted and snATAC-seq samples.
Identifying marker peaks of chromatin accessibility
To identify peaks for each cell type, we aggregated reads for all cells within a cluster. We shifted reads aligning to the positive strand +4bp and reads aligning to the negative strand −5 bp, extended reads to 200 bp, and centered the reads. We used MACS232 to call peaks for each cluster (‘--nomodel --keep-dup all’). We removed peaks that overlapped the ENCODE blacklist v286,87. We then used bedtools92 (v.2.26.0) to merge peaks from clusters and create a set of merged peaks. We generated a sparse m x n matrix containing binary overlap between m peaks in the merged set of islet regulatory peaks and n cells. We calculated t-statistics of peak specificity for each cluster using linear regression models. For each peak and each cluster, we used binary encoding of read overlap with the peak as the outcome and whether a cell was in the cluster as the predictor, and included the log read depth of each cell as a covariate in the model.
Matching islet snATAC-seq with scRNA-seq clusters
To verify that clusters definitions and labels from single cell chromatin accessibility data matched those from single cell expression data, we obtained published scRNA-seq data from 12 non-diabetic islet donors23. Because cluster definitions for all cell types were not available, we re-analyzed the data and performed clustering analyses. We used the Spearman correlation between t-statistics from islet snATAC-seq and islet scRNA-seq data to verify cluster labels. See Supplementary Note for additional details.
Single cell motif enrichment
We used chromVAR33 (v.1.5.0) to estimate TF motif enrichment z-scores for each cell. First, we constructed a merged peak by cell sparse binary matrix as the input for chromVAR. We corrected for GC bias based on hg19 (BSgenome.Hsapiens.UCSC.hg19) using the ‘addGCBias’ function. For TF motifs within the non-redundant JASPAR 2018 CORE vertebrate set, we calculated bias-corrected deviation z-scores for each cell. Across all cell types, we selected variable TF motifs (N=141) with variability>1.2. For each cell type, we then computed the average TF motif enrichment z-score across single cells, collapsing values for cell types with more than one state. We compared motif enrichment z-scores between single cells using Benjamini-Hochberg corrected p-values (FDR<0.01) from 2 sample T-tests.
Ordering alpha, beta, and delta cells along a pseudo-state trajectory
We used Cicero8 (v.1.3.3 with Monocle 3) to order alpha, beta, and delta cells along separate trajectories. Starting from the merged peak by cell sparse binary matrix, we extracted beta cells and filtered out peaks that were not present in beta cells. We then preprocessed the data with latent semantic indexing (LSI) and continued onto dimensionality reduction, cell clustering, and trajectory graph learning using default parameters. We then chose the root state (i.e. the start of the trajectory) based on the highest average INS promoter accessibility. We repeated the same procedure for beta and delta cells, instead choosing the root state based on GCG or SST promoter accessibility respectively.
Comparison of endocrine cell states
To identify TF motifs variable between cell states, we performed one-sided Student’s T-test on motif z-scores between cells in each state. We adjusted p-values with the Benjamini-Hochberg procedure and defined motifs with FDR<0.05 and absolute difference in z-score>0.5 as differential. To analyze differential promoter accessibility between cell states, we performed two-sided Fisher’s exact tests between hormone-high and hormone-low states for each promoter against the null hypothesis that the promoter had similar accessibility across states. We used the Benjamini-Hochberg adjusted p-values (FDR<0.01 for alpha or beta cells and FDR<0.1 for delta cells) to identify gene promoters with differential accessibility across states. Differentially-accessible promoters were used to perform GO term enrichment on biological processes (2018 version) using Enrichr93 (v.1.0). We filtered for terms that contained <150 genes. Details of trajectory analysis of motifs and promoters provided in Supplementary Note.
We collected gene sets from Xin et al.23, Mawla & Huising43, and Camunas-Soler et al44 (details in Supplementary Note). For each gene list, we performed gene set enrichment analysis94 (GSEA) using log2 odds ratios from previous Fisher’s exact tests. We also performed GSEA using significantly differential promoters from Figure 2a as the gene sets to assess whether cell states showed concordant differences across cell types.
GWAS enrichment genome-wide with aggregate peak annotations
We used stratified LD score regression60–62 (v.1.0.1) to calculate enrichment for GWAS traits. We obtained GWAS summary statistics for quantitative traits11,12,48–51, diabetes9,47, and control traits52–59. To create custom LD score files, we annotated variants using peaks for each cluster as a binary annotation. In addition to the annotations included in the baseline-LD model v2.2, we included LD scores estimated from merged peaks across all clusters as the background. For each trait, we used stratified LD score regression to estimate the enrichment z-scores of each annotation relative to background. We computed one-sided p-values for enrichment based on the z-scores and corrected for multiple tests using the Benjamini-Hochberg procedure.
GWAS enrichment with single cell annotations
We determined genetic enrichment of accessible chromatin profiles in individual cells for fasting glucose level12, T2D10, and control traits major depressive disorder56 and systemic lupus erythematosus54 GWAS using polyTest95. Additional details are provided in the Supplementary Note.
To identify TFs correlated with trait enrichments, we regressed out log read depth, fraction of reads in peaks, and fraction of promoters used from the single cell enrichments. We calculated the Spearman correlation between the residuals of fasting glucose or T2D enrichment z-scores and motif enrichment z-scores using all cells or only beta cells. We used Bonferroni correction to correct p-values for multiple tests. To identify motifs directly enriched for T2D or FG association in beta cells, we identified all variants mapping in a beta cell site and using fimo96 predicted instances of each motif in JASPAR34 using sequence surrounding each allele. We considered variants disrupting motifs where there was a motif prediction for only one allele. We tested for enrichment of variants in a predicted motif or disrupting the motif for T2D or FG using polyTest95.
GWAS enrichment at known T2D loci using aggregate peak annotations
We identified primary T2D risk signals10 where the highest causal probability variant was associated with fasting glucose level12 at genome-wide significance. We annotated variants at each signal with INShigh and INSlow beta cell sites and tested for enrichment using fgwas64 (v0.3.6) 71 (‘-fine’). For alpha, delta and gamma cells, we retained sites that did not overlap a beta cell site and annotated variants at all T2D risk signals9. To exclude the possibility that enrichments could be driven by other relevant tissues, we annotated variants in liver and adipose ATAC-seq from ENCODE86. We tested for enrichment using fgwas64 (‘-fine’) including other tissue annotations in the model. We considered annotations with positive enrichment estimates enriched for T2D risk.
Predicting genetic variant effects on chromatin accessibility
We used deltaSVM65 to predict the effects of non-coding variants on chromatin accessibility in each cell type and cell state (details in Supplementary Note). From variant z-scores we calculated p-values and FDR and considered variants significant at FDR<0.1.
Luciferase gene reporter assays
We cloned sequences containing reference alleles in the forward orientation upstream of the minimal promoter of firefly luciferase vector pGL4.23 (Promega) using KpnI and SacI restriction sites. For rs34584161:A>G, we cloned the alternative allele in the same manner as the reference alleles. For other variants, we introduced the alternative alleles via site-directed mutagenesis (SDM) using the NEB Q5 Site-Directed Mutagenesis kit (New England Biolabs). SDM and reporter assay details provided in Supplementary Note. We normalized Firefly activity to Renilla activity and compared it to empty vector, and normalized results were expressed as fold change compared to control per allele. We used a two-sided Student’s T-test to compare the two alleles.
Mapping allelic imbalance within clusters
We extracted genomic DNA either from spare islet nuclei (donors 1 and 2), or acinar cells (donor 3). We used the DNeasy Blood & Tissue Kits (Qiagen) according to manufacturer’s protocol for purification of total DNA and performed genotyping on the Infinium Omni2.5–8 v1.4 array (Illumina). Additional details provided in Supplementary Note. Using cluster assignments for each cell, we split mapped reads for each donor into cluster-specific reads. We used WASP97 (v.0.3.0) to correct for reference mapping bias at heterozygous variants. We then used a two-sided binomial test to assess imbalance assuming a null hypothesis where both alleles were equally likely to be observed. For each variant, we combined imbalance z-scores across donors using Stouffer’s z-score method with sequencing depth as a weight for each sample.
Grouping of predicted effect variants and enrichment for islet caQTLs
We categorized variants with predicted effects on alpha or beta cells based on effects across cell type and states: “alpha” (n=8,552), “beta” (n=11,650), “hormone-high” (n=12,874), and “hormone-low” (n=10,808), and “shared” (n=27,140). We also determined the concordance in the direction of effect for variants across cell states. For the set of variants with significant effects in each state, we calculated the fraction of variants where the effect allele had predicted effect in other states. We determined significance using a two-sided binomial test assuming an expected fraction of 50%. We assessed enrichment of predicted effect variants in alpha or beta cell states for islet caQTLs28 compared to any caQTL in alpha or beta cell sites using two-sided Fisher’s exact tests. We stratified variants with predicted effects by category and assessed enrichment of caQTLs with predicted effects within each category with two-sided Fisher’s exact tests.
TF motif enrichment within predicted effect variant categories
For each cell- or state-resolved category of variants with predicted effects, we extracted 29bp sequences (± 14bp around variant) corresponding to the higher or lower predicted effect allele. We used AME96 in MEME (v.4.12.0) to predict motif enrichment, using position weight matrices from JASPAR 201834. We used sequences from the higher or lower effect alleles as the test or background set respectively. We used TFClass (http://tfclass.bioinf.med.uni-goettingen.de/) to group motifs by family. To determine TFs most likely driving the enrichment, we checked normalized promoter accessibility within family members in alpha or beta cells.
Enrichment of predicted variants for lower frequency variants
We obtained summary statistics of T2D9 and performed LD pruning (details in Supplementary Note). We identified variants that had significant effects in any endocrine cell type, as well as for each cell type for either state. We created a background set of variants without significant effects in any endocrine cell type (FDR>0.1). We created thresholds based on T2D association p-values (5×10⁻⁸, 1×10⁻⁷, 1×10⁻⁶, 1×10⁻⁵, 1×10⁻⁴, 1×10⁻³). For each threshold, we calculated fold enrichment of predicted effect variants as compared to the background and determined significance using two-sided binomial tests.
Single cell chromatin co-accessibility
We used Cicero8 to calculate co-accessibility for pairs of peaks for alpha, beta, and delta cells. As in the trajectory analysis, we started from the merged peak by cell sparse binary matrix, extracted beta cells, and filtered out peaks that were not present in beta cells. We used ‘make_cicero_cds’ to aggregate cells based on 50 nearest neighbors. We then used Cicero to calculate co-accessibility using a window size of 1 Mb and a distance constraint of 500 kb. We repeated the same procedure for alpha and delta cells. We used co-accessibility>0.05 to define pairs of peaks as co-accessible.
Enrichment of islet Hi-C and pcHi-C loops in co-accessible peaks
We obtained islet promoter capture Hi-C (pcHi-C) and merged Hi-C loops27,71. For both datasets, we used coordinates for anchors directly from the loop calls. To compare co-accessibility with pcHi-C or Hi-C, we used direct overlap of peaks with anchors. For binned thresholds of co-accessibility in 0.05 increments, we calculated distance-matched odds ratios for alpha, beta or delta cell co-accessible peaks containing pcHi-C or Hi-C loops versus non-co-accessible peaks (co-accessibility<0). We used two-sided Fisher’s exact tests to assess significance.
Hi-C library construction and data analysis
We performed in situ Hi-C as previously described using MboI on two batches of hESC-derived beta cells using the differentiation protocol described below cultured in high glucose (20mM mg/mL) or low glucose (5mM mg/mL). Hi-C libraries were sequenced to read counts of 1,509,428,732 and 1,918,698,012, respectively. We analyzed Hi-C using Juicer98 with default settings and visualized with HiGlass99. Unless otherwise indicated, interaction frequencies were normalized using iterative matrix balancing. We generated virtual 4C tracks by extracting normalized interaction frequencies from an anchor bin of interest from the contact matrix. We performed Aggregate Peak Analysis (APA) using juicer tools with settings “-u -r 10000”.
Annotating fine-mapped diabetes risk variants
We annotated risk signals in compiled fine-mapping data for T2D (additional details in Supplementary Note). For each signal, we identified variants that were in the 99% credible set with PPA>0.01. We intersected these candidate variants with sites for each islet cell type and cell state, and then identified variants with predicted effects on the overlapping cell types/states. We annotated variants based on overlap with sites co-accessible to gene promoters. For target genes linked to diabetes risk variants we determined enriched gene sets using GSEA94.
Analysis of INS promoter 4C data
We downloaded and re-analyzed published 4C of the INS promoter for EndoC-βH172 with 4C-ker100. We created a reduced genome using 25bp flanking sequences of BglII cutting sites. For the 3 replicates, we aligned reads to this reduced genome using bowtie2101 (v.2.2.9; ‘-N 0 −5 20’). We extracted counts for each fragment after removing self-ligated and undigested fragments and input bedGraph files to R.4Cker. We generated normalized counts and called high interaction regions using ‘nearBaitAnalysis’ (‘k=10’).
CRISPR/Cas9-mediated genome editing in human embryonic stem cells
H1 hESCs (WA01; purchased from WiCell; NIH registration number: 0043) were seeded onto Matrigel®-coated six-well plates at a density of 50,000 cells/cm2 and maintained in mTeSR1 media (StemCell Technologies) for 3–4 days with media changed daily. Details for the generation of clonal hESC lines for enhancer deletion and allele-specific are provided in the Supplementary Note. sgRNA oligos and genotyping primers are listed in Supplementary Table 12. hESC research was approved by the University of California, San Diego, Institutional Review Board and Embryonic Stem Cell Research Oversight Committee.
Pancreatic differentiation of hESC clones
KCNQ1 enhancer-deleted hESC lines were differentiated in a suspension-based format using rotational culture with modifications to a published protocol74 KCNQ1 base-edited hESC lines were differentiated in a suspension-based format using rotational culture with modifications to a published protocol102. Details on modifications are provided in the Supplementary Note. For the experimental analysis of clones, we performed flow cytometry, immunofluorescence staining, mRNA sequencing, quantitative PCR, and insulin content measurement (details of each assay in Supplementary Note).
Extended Data
Extended Data Fig. 1. Quality control metrics and aggregate comparison to bulk islet ATAC.
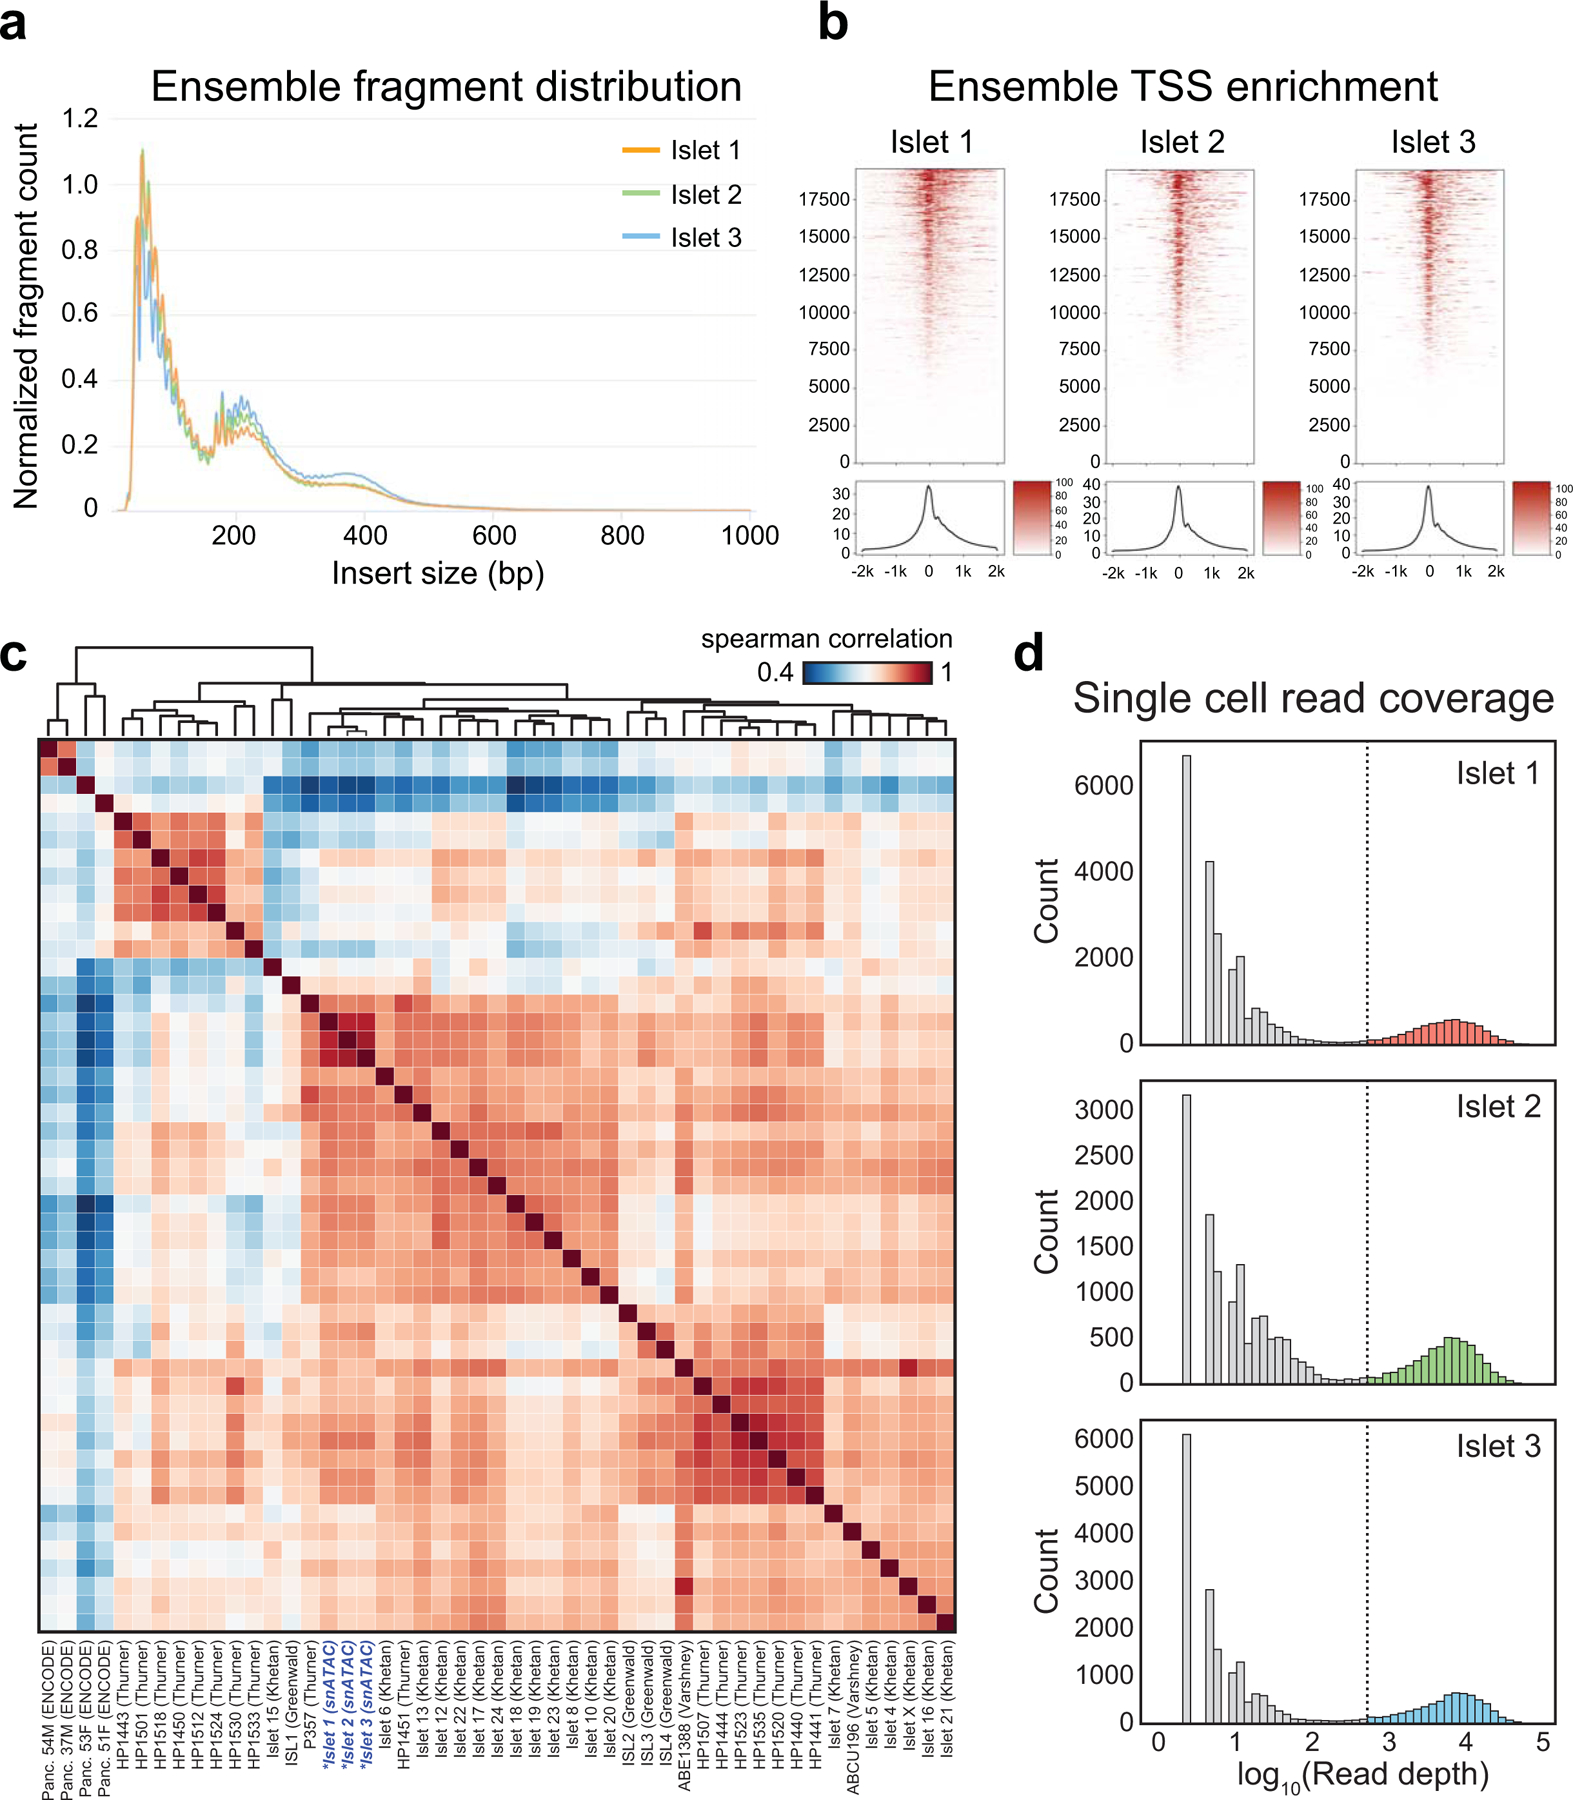
(a) Insert size distribution for aggregate reads from each snATAC-seq experiment. (b) Aggregated read coverage from each snATAC-seq experiment in a ±2 kb window around individual promoters (top) and averaged across all promoters (bottom). (c) Spearman correlation between normalized read coverage within a merged set of peaks from 3 aggregated islet snATAC-seq, 42 bulk islet ATAC-seq, and 4 bulk pancreas ATAC-seq datasets. Names of samples are from the original sources of the data. (d) Binned log10 read depth distribution for each experiment.
Extended Data Fig. 2. Flowchart of the snATAC-seq data processing pipeline.
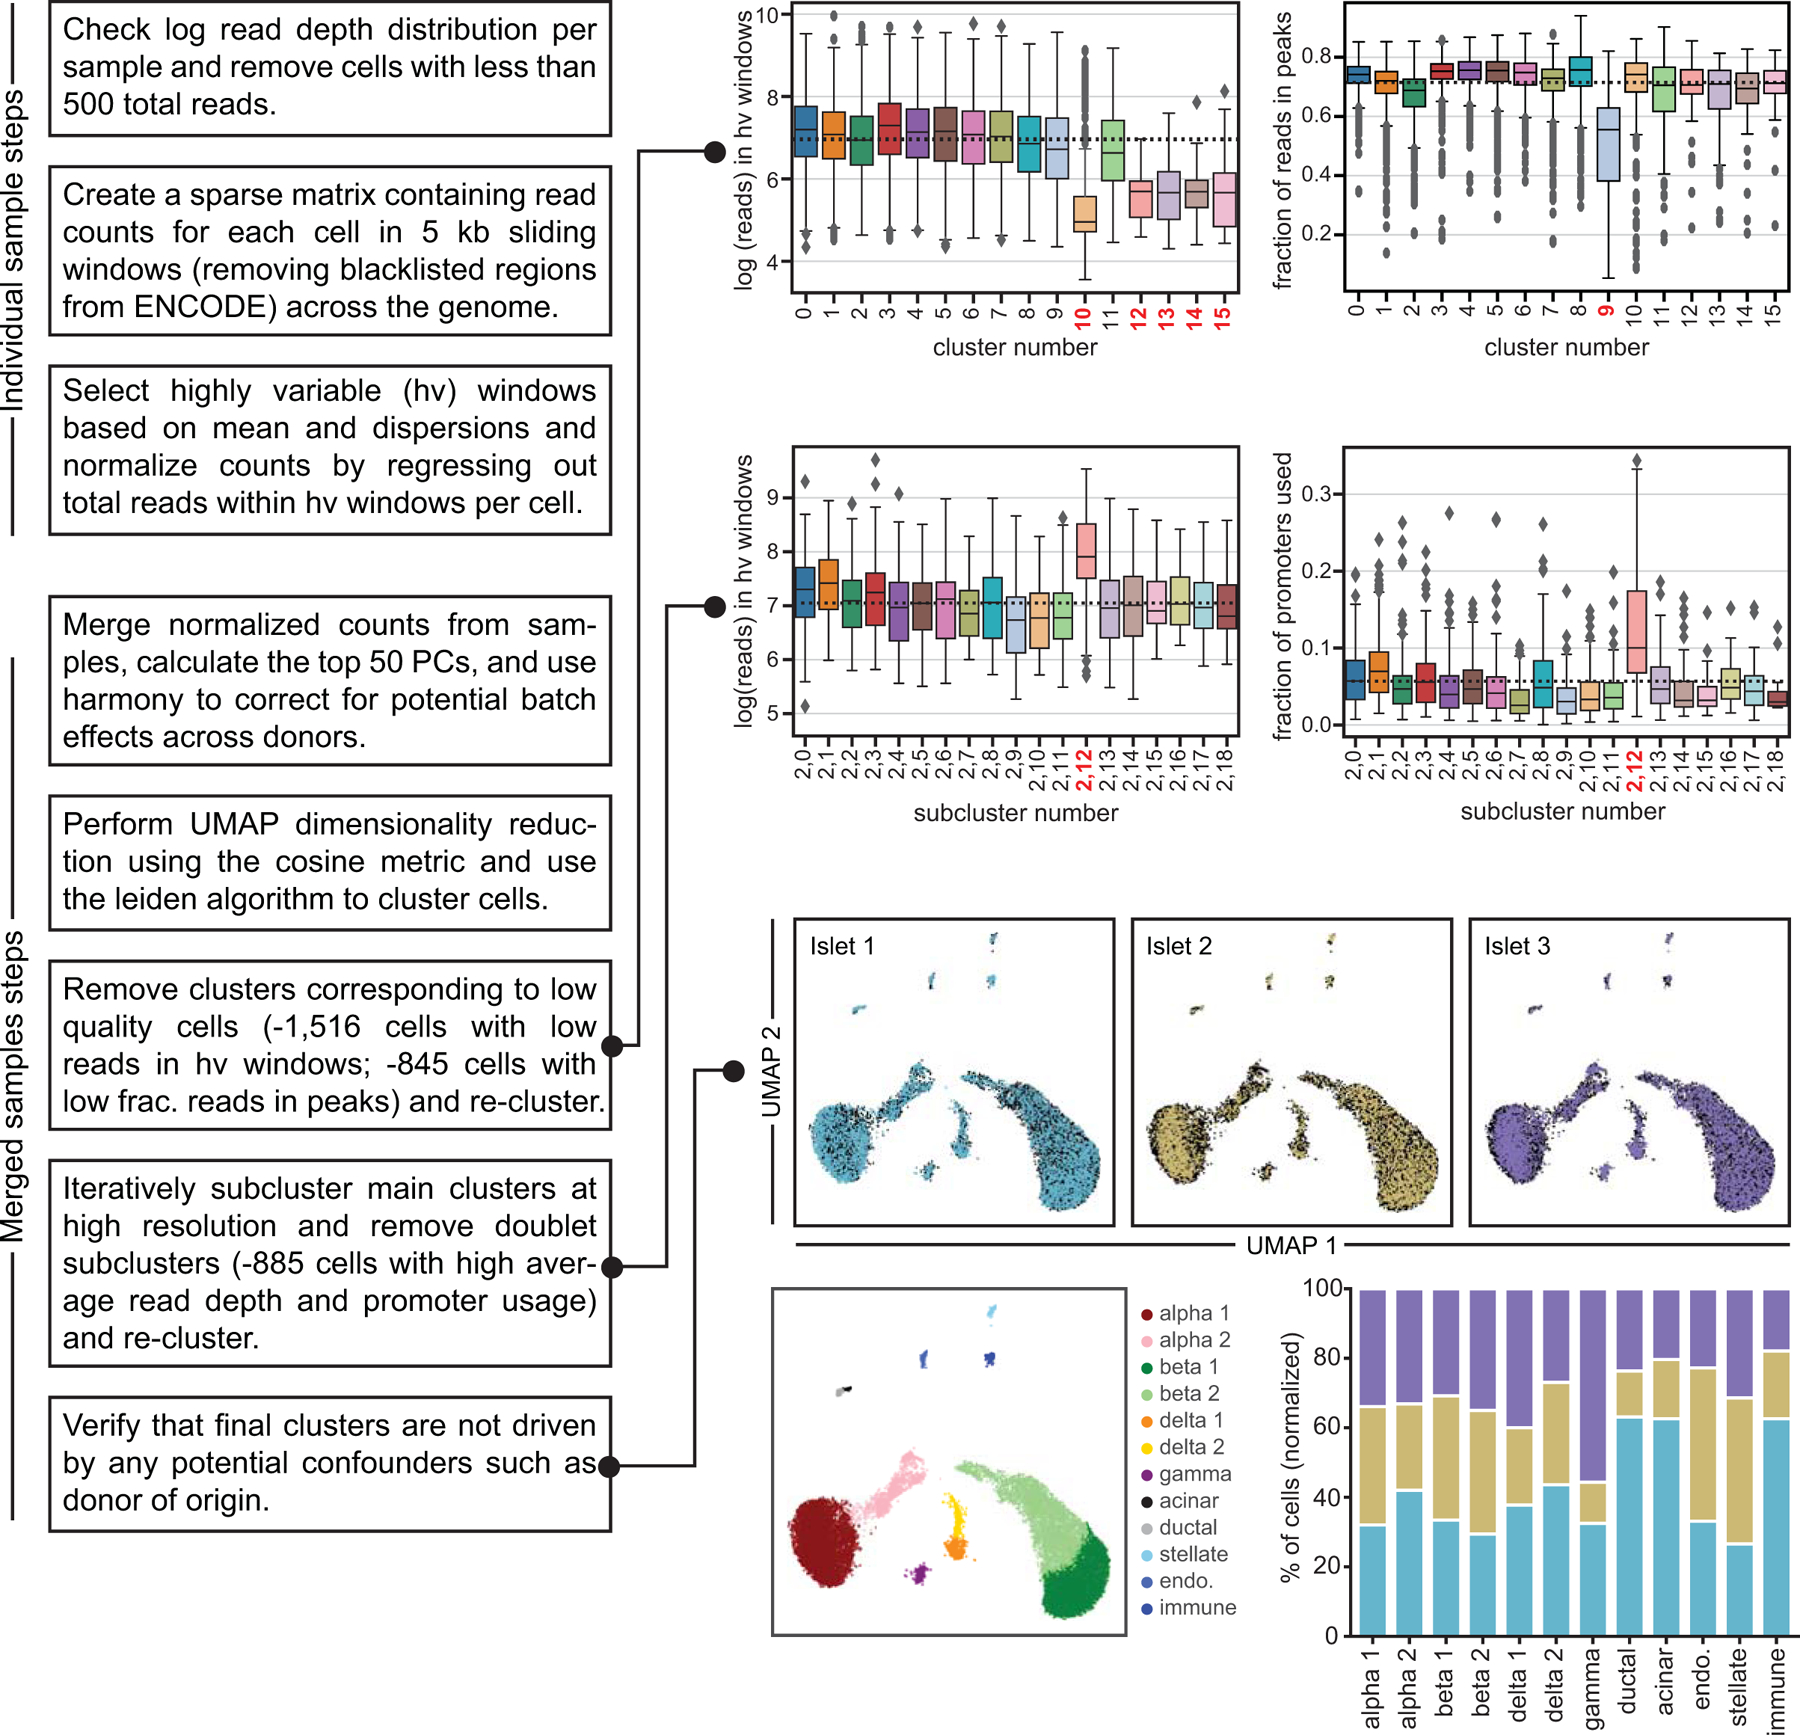
(a) Flowchart summarizing key steps of the snATAC-seq processing pipeline, including the various steps where cells were filtered out. Samples were first processed individually. All samples were then combined using a batch correction method. Clusters corresponding to cells from low quality cells, including those with low read depth in highly variable windows and low fraction of reads in peaks were then removed. After re-clustering, iterative subclustering of the main clusters at high resolution was used to identify and remove doublet subclusters. The final clusters are not driven by potential confounders such as donor of origin. Boxplot center lines, limits, and whiskers represent median, quartiles, and 1.5 IQR respectively.
Extended Data Fig. 3. Analysis of islet single cell gene expression data.
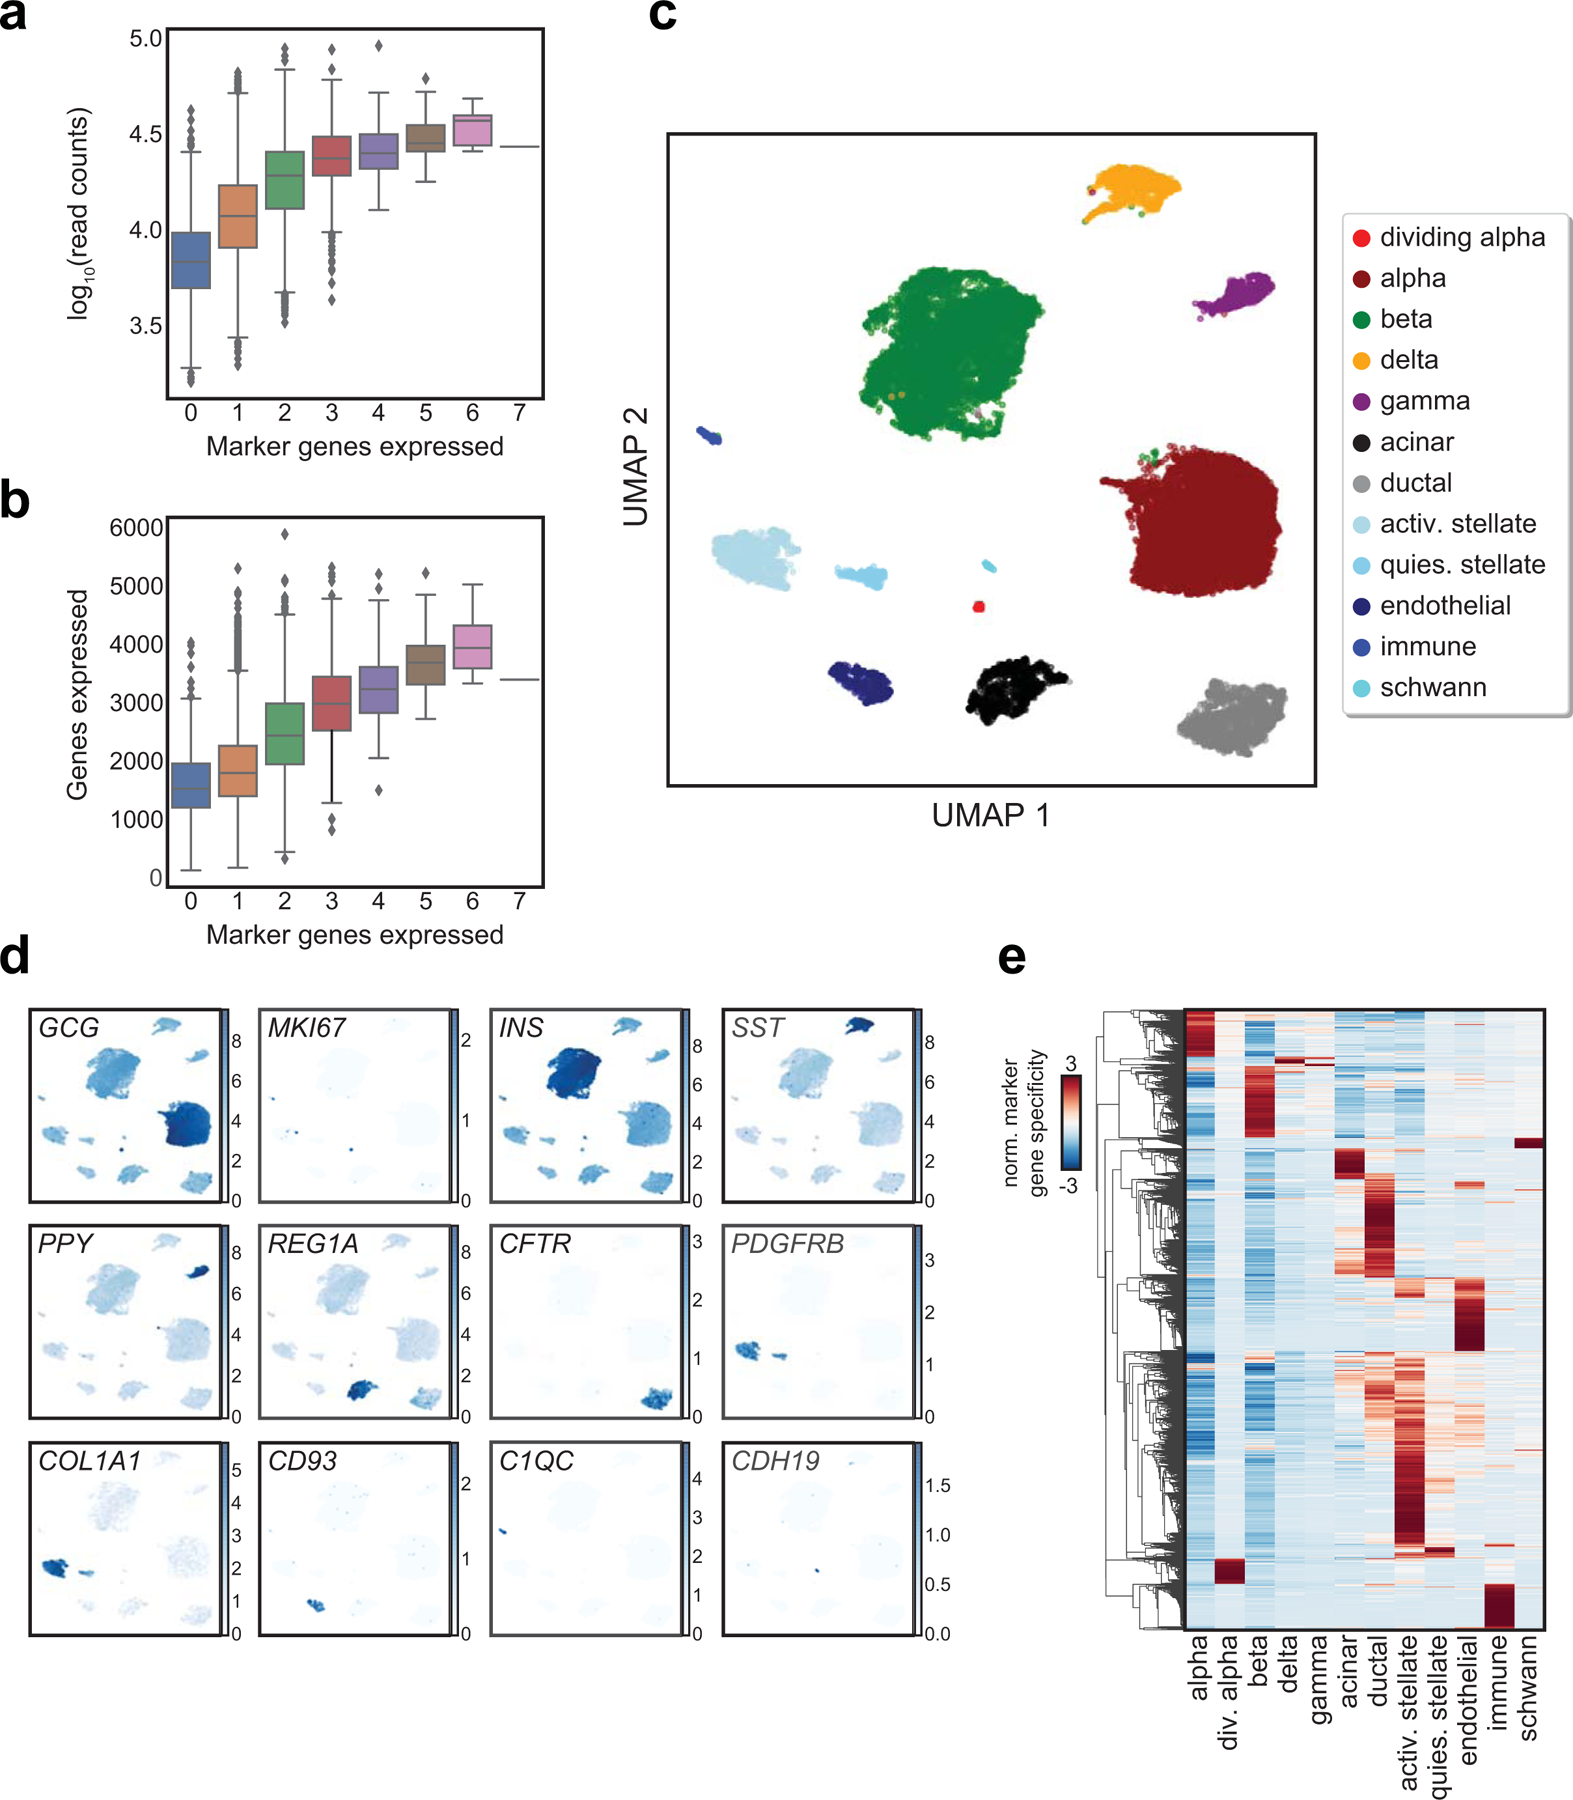
(a) log10 transformed read depth or (b) total number of genes expressed compared with number of marker genes expressed per cell from scRNA-seq data. Boxplot center lines, limits, and whiskers represent median, quartiles, and 1.5 IQR respectively. Cells expressing more than one marker gene (defined by mixture models) were marked as doublets and filtered out. (c) Clusters of islet cells from single cell RNA-seq data plotted on UMAP coordinates. quies. stellate, quiescent stellate. activ. stellate, activated stellate. (d) Selected marker gene log2(expression) for each cluster plotted on UMAP coordinates. (e) Row-normalized t-statistics of marker gene specificity showing the most specific genes (t-statistic>20) for each cluster.
Extended Data Fig. 4. Comparison of motif enrichment between alpha and gamma cells.
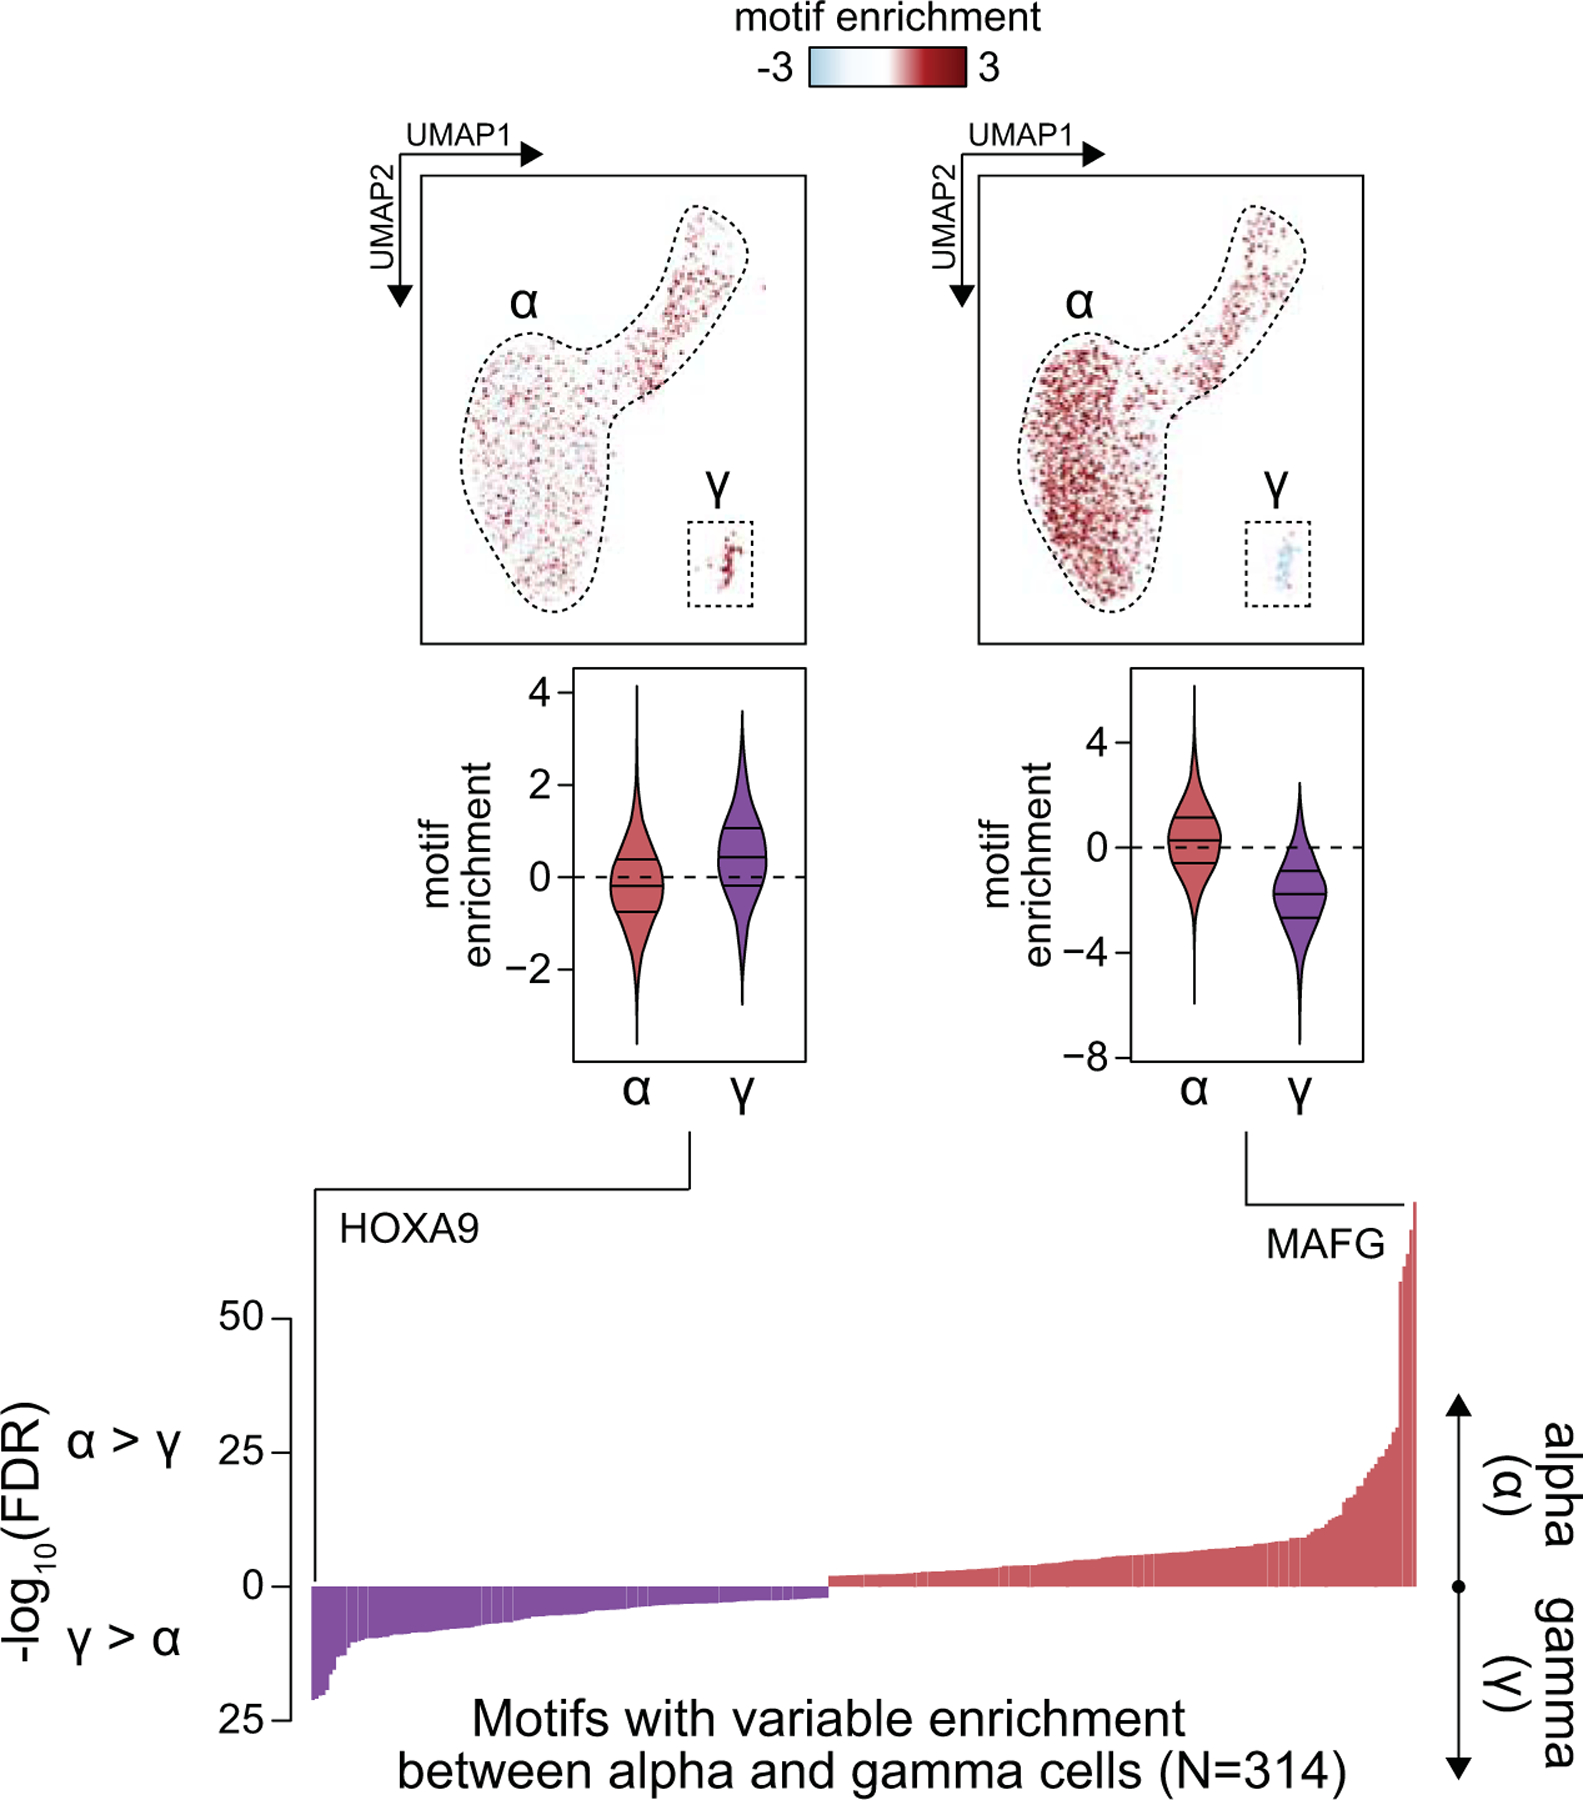
Differential enrichment of motifs between alpha cell open chromatin regions and gamma cell open chromatin regions as measured by a 2-sided T-test, with FDR calculated by the Benjamini-Hochberg procedure. Examples are highlighted of motifs enriched in alpha cells and gamma cells, respectively (MAFG, HOXA9). UMAP plots show enrichment z-scores for the indicated motifs in alpha and gamma cells. Violin plots below show the distribution of enrichment z-scores across alpha or gamma cells, where the lines represent median and quartiles.
Extended Data Fig. 5. Differentially accessible promoters across pseudo-states.
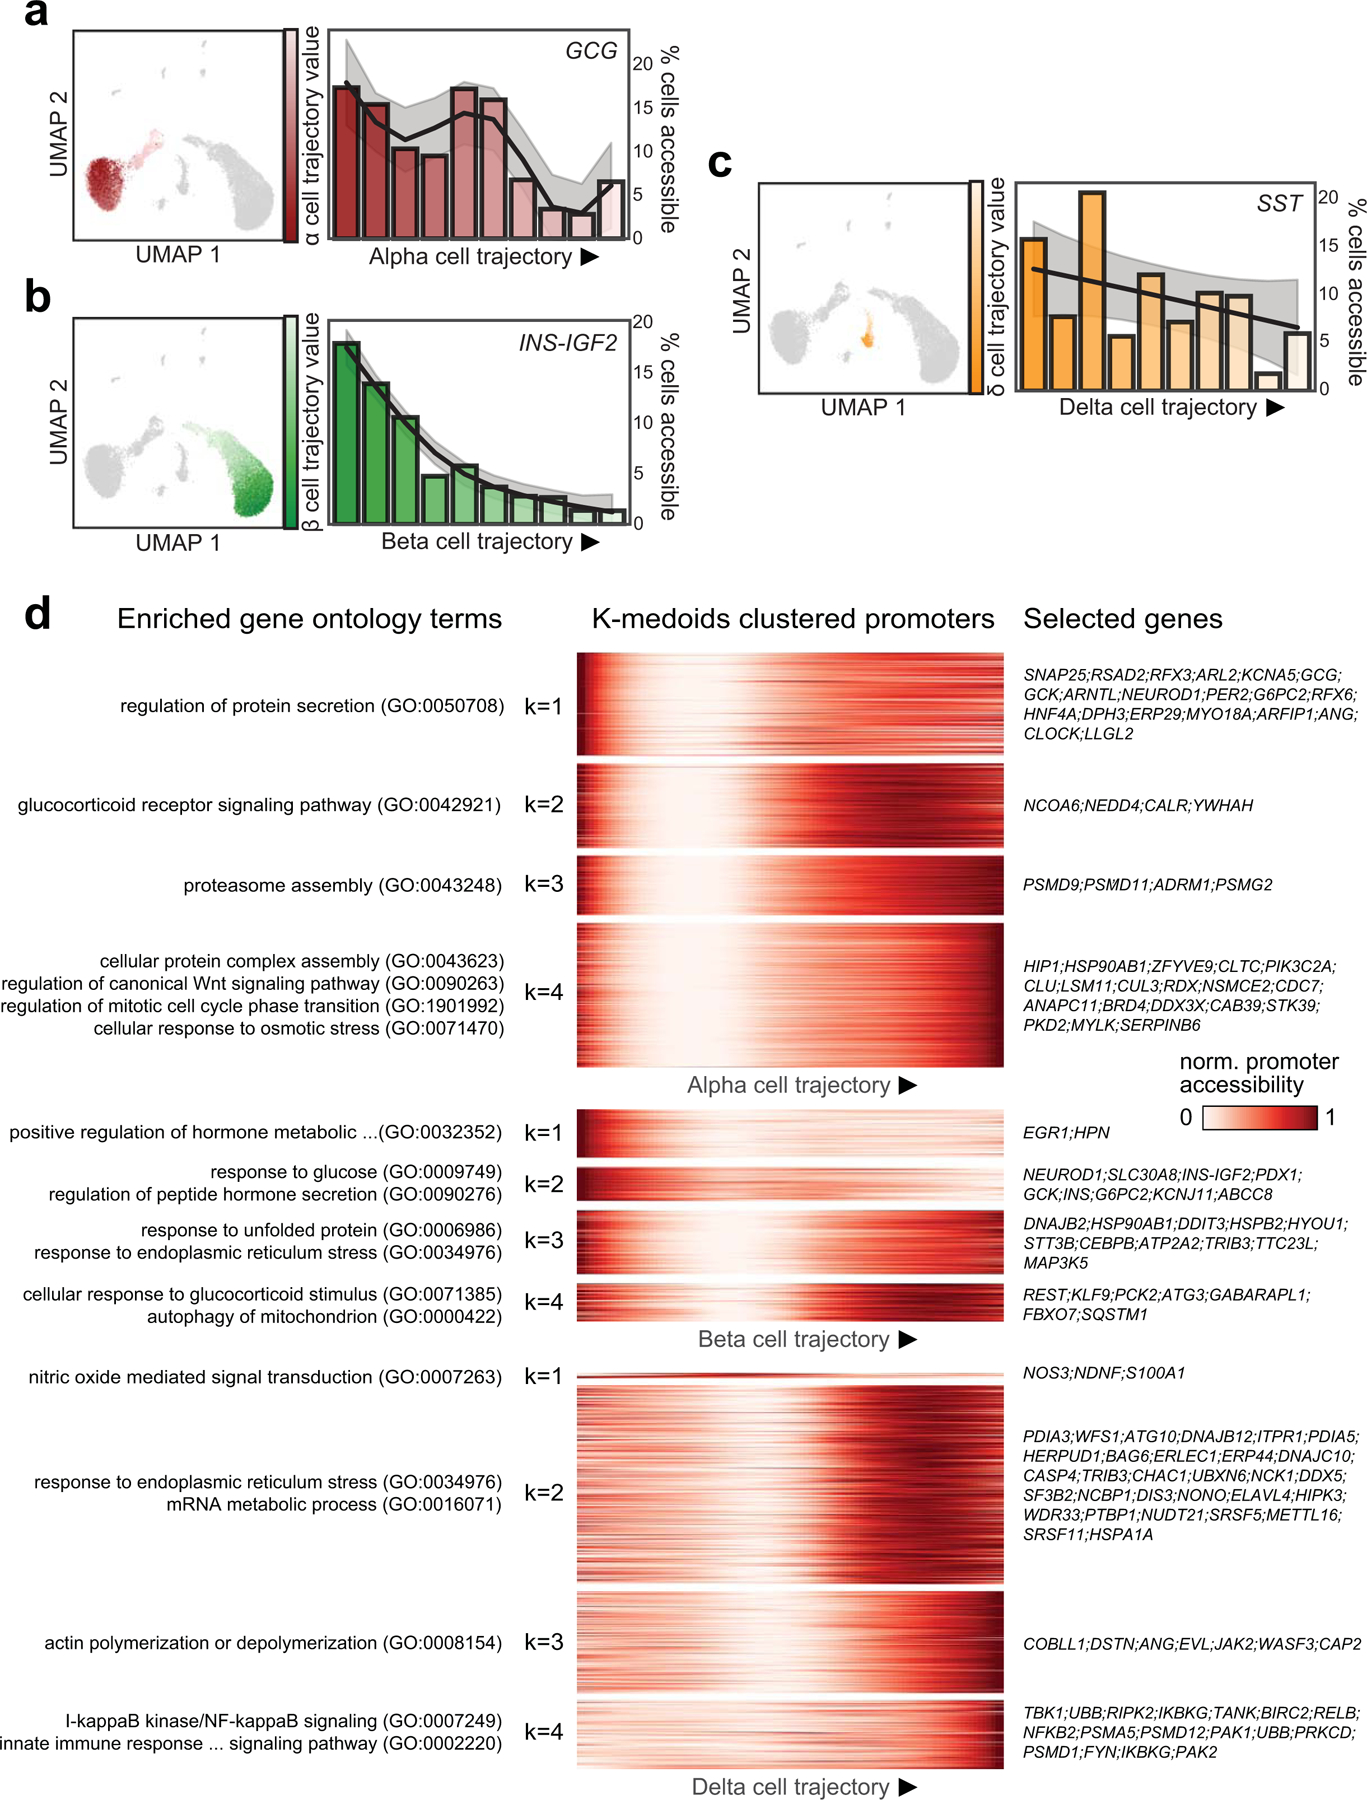
(a) Pseudo-state (trajectory) values for alpha cells plotted on UMAP coordinates (left) and percentage of cells with GCG promoter accessibility decreases across 10 bins along the alpha (α) cell trajectory (right). (b) Pseudo-state (trajectory) values for beta (β) cells plotted on UMAP coordinates (left) and percentage of cells with INS promoter accessibility decreases across 10 bins along the beta cell trajectory (right). (c) Pseudo-state (trajectory) values for delta (δ) cells plotted on UMAP coordinates (left) and percentage of cells with SST promoter accessibility decreases across 10 bins along the beta cell trajectory (right). (d) Heatmaps showing promoters with dynamic accessibility across trajectories for alpha (top), beta (middle) and delta (bottom) cell trajectories. Gene promoters are clustered into 4 groups for each trajectory with k-medoids clustering. Enriched gene ontology for each k-medoid cluster (left) and selected genes present in at least one enriched gene ontology.
Extended Data Fig. 6. Single cell GWAS enrichment and correlation with TF motifs.
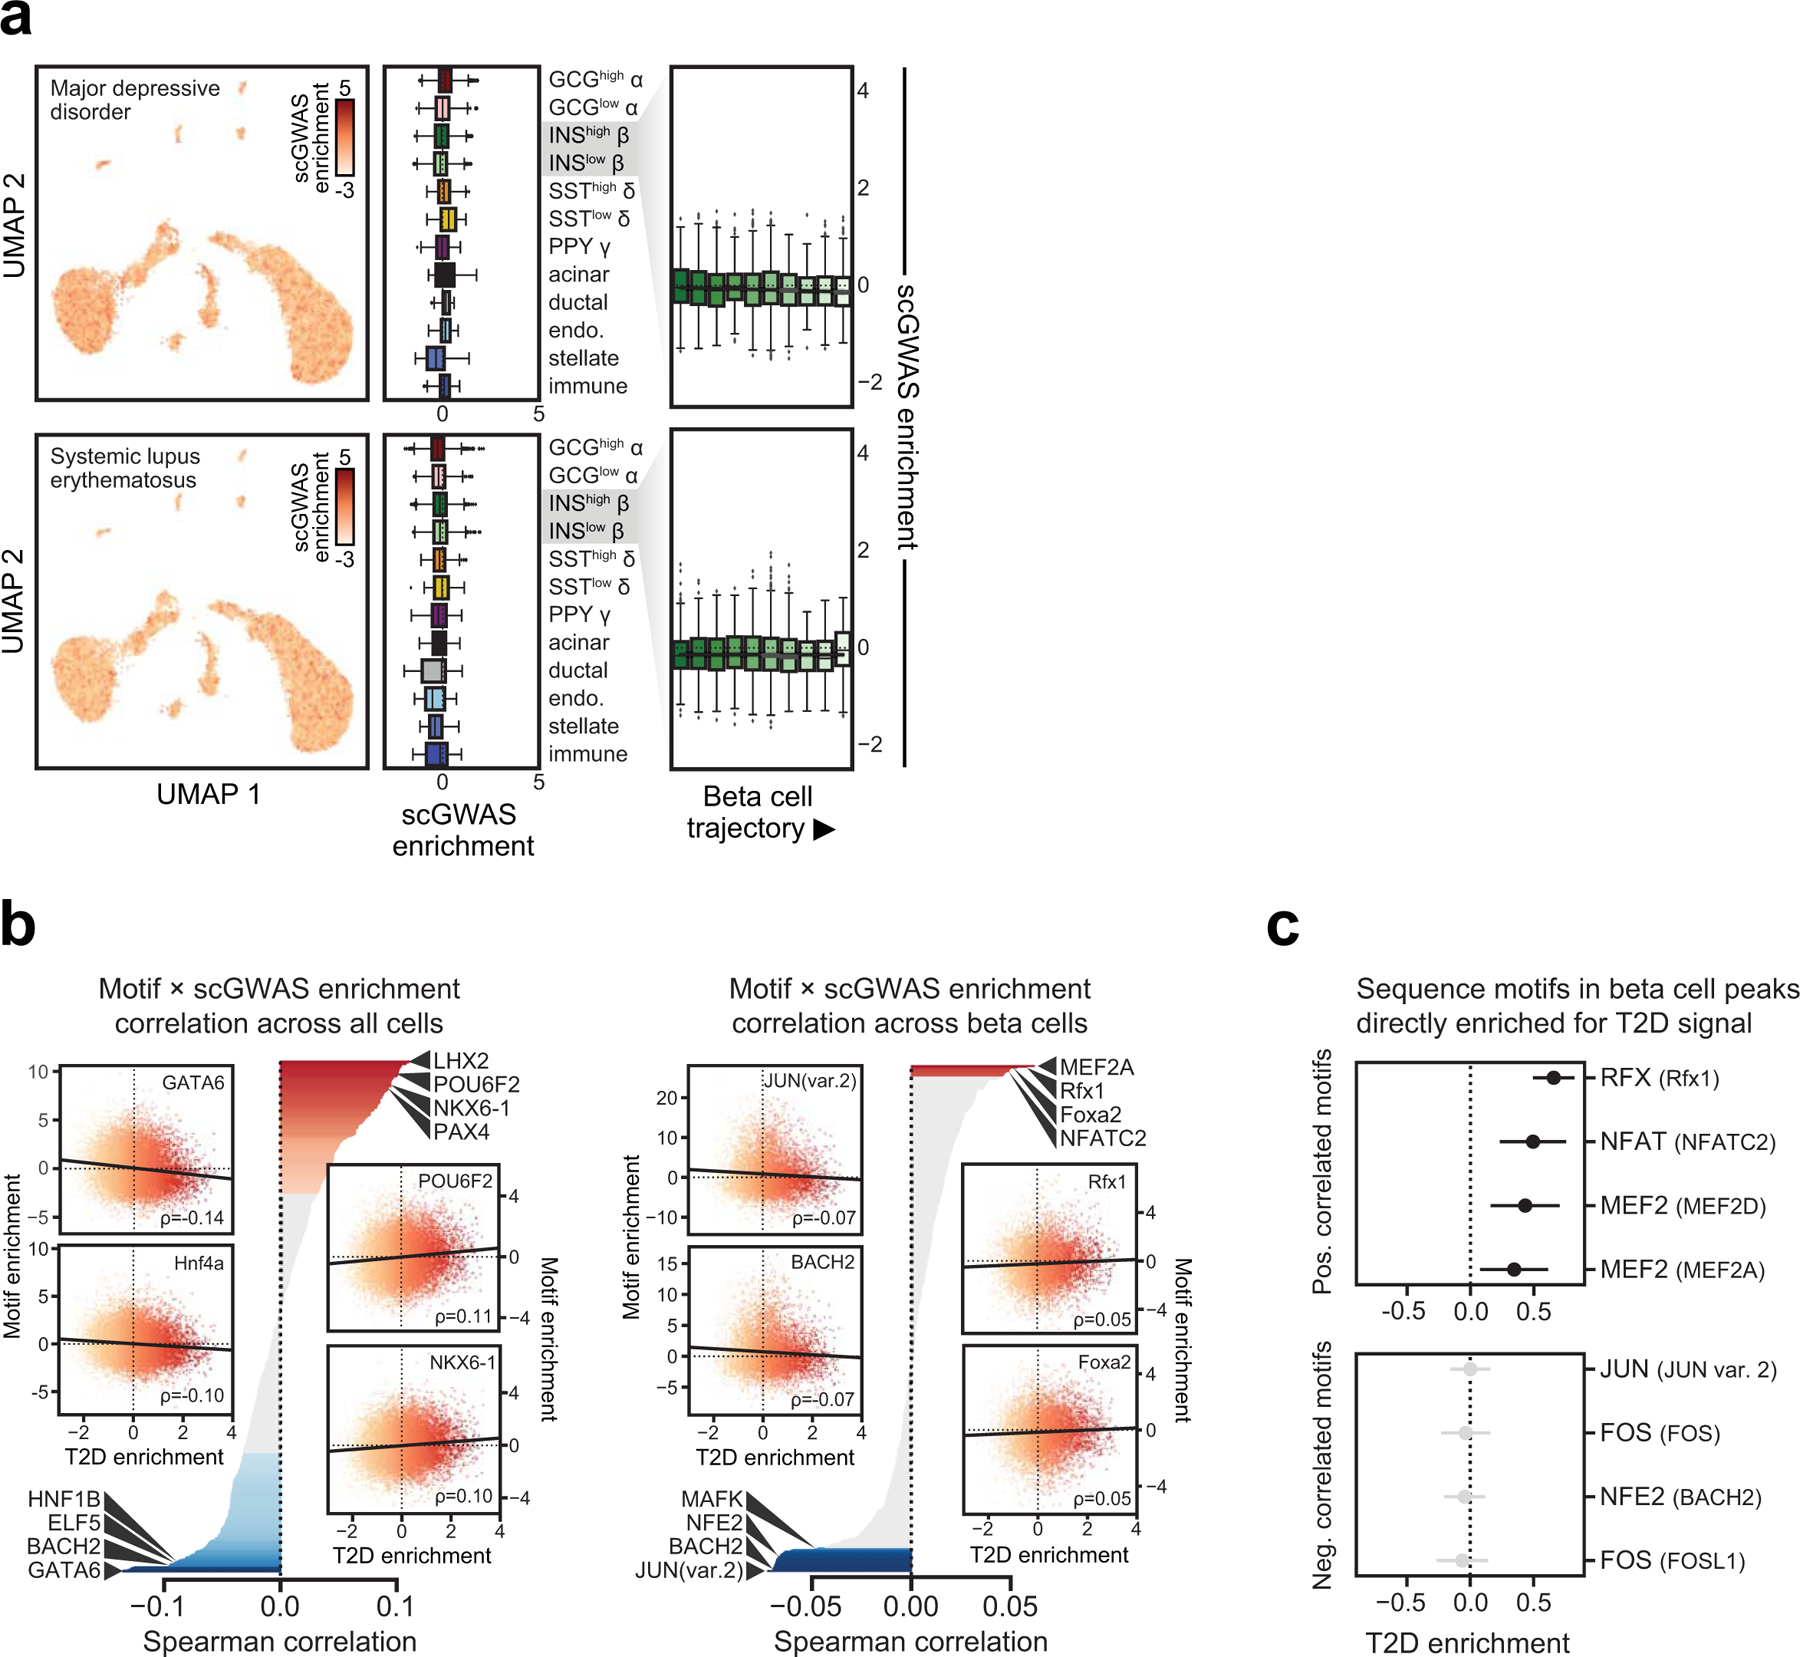
(a) Single cell GWAS enrichment z-scores for Major depressive disorder and Systemic lupus erythematosus projected onto UMAP coordinates (left panels), z-score enrichment distribution per cell type and state (middle panels) and z-score enrichment distribution split into 10 bins based on beta cell trajectory values (right panels). Boxplot center lines, limits, and whiskers represent median, quartiles, and 1.5 IQR respectively. (b) Correlation between single cell GWAS enrichment z-scores for Type 2 Diabetes and chromVAR TF motif enrichment z-scores across either all cells (left) or beta cells (right). Inset scatterplots highlight the top correlated motifs in either direction. (c) Variants mapping directly in sequence motifs positively correlated with T2D risk in beta cells are enriched for T2D association, whereas variants mapping in motifs negatively correlated with T2D risk in beta cells show no such enrichment. Values represent effect size and SE.
Extended Data Fig. 7. Single cell co-accessibility analyses in islet cell types.
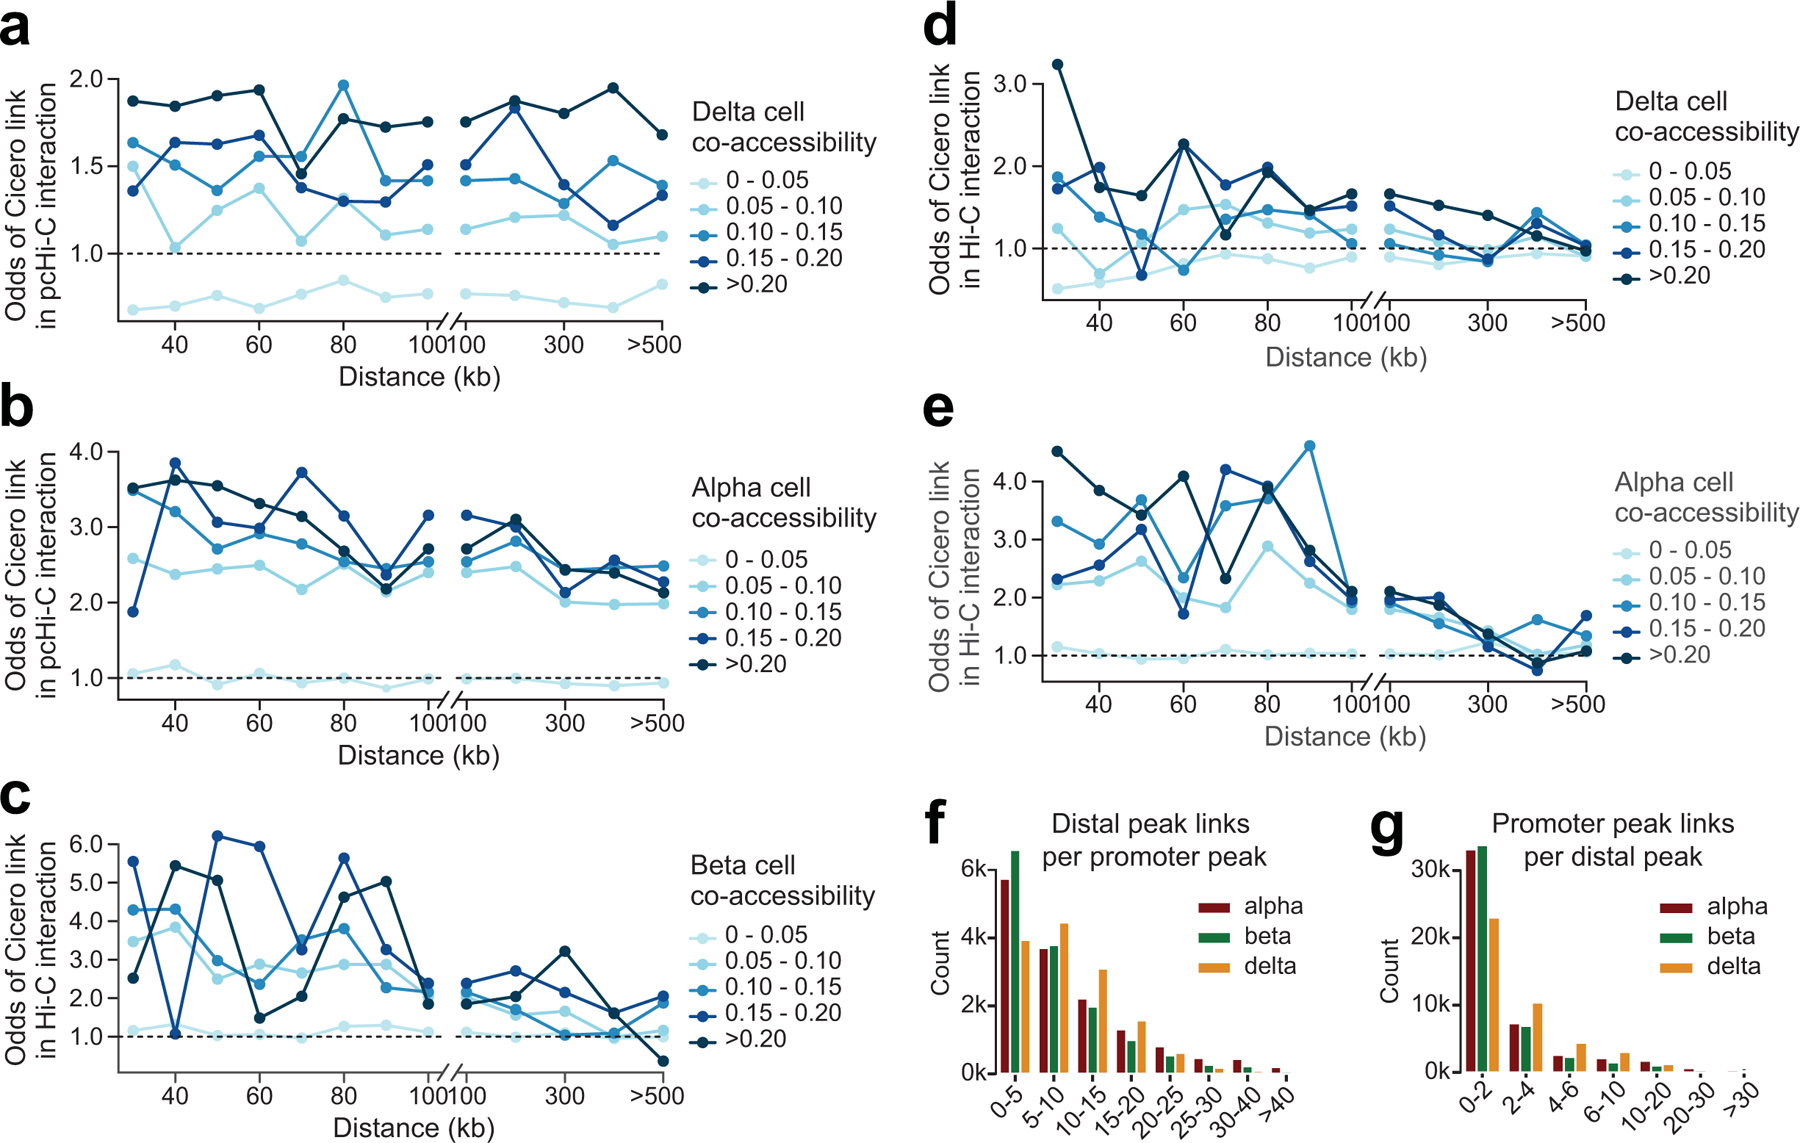
(a) Distance-matched odds that delta cell co-accessibility links overlap islet pcHi-C chromatin loops at different co-accessibility threshold bins in 0.05 intervals demonstrate that co-accessible links are enriched for chromatin interactions. (b) Same analysis as in (a) but with alpha cell co-accessibility. (c) Same analysis as in (a) but with beta cell co-accessibility and Hi-C loops. (d) Same analysis as in (a) but with delta cell co-accessibility and Hi-C loops. (e) Same analysis as in (a) but with alpha cell co-accessibility and Hi-C loops. (f) Number of distal sites linked to each promoter peak for alpha, beta, and delta cells. (g) Number of promoters linked to each distal site for alpha, beta, and delta cells.
Extended Data Fig. 8. Cell type-specific and shared co-accessible sites.
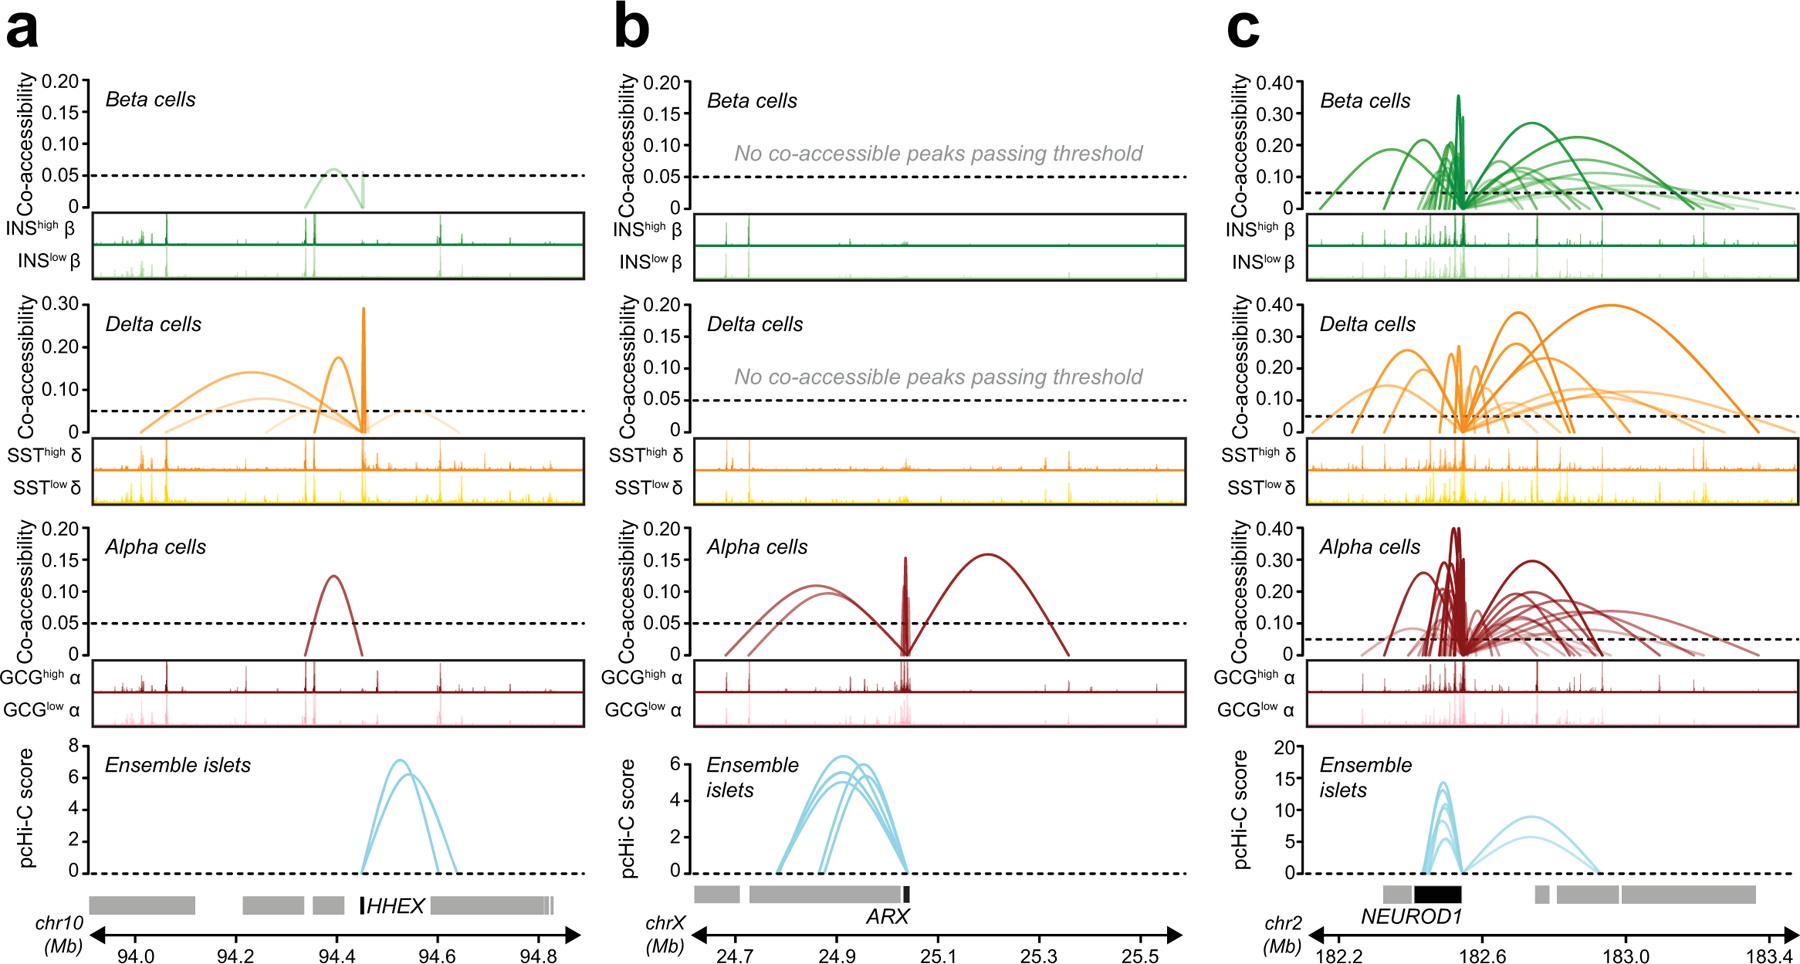
(a) An example of co-accessibility anchored at the promoter for the delta cell identity TF HHEX. Co-accessibility for beta, delta, and alpha cells are shown compared to high-confidence pcHi-C loops from ensemble islets. Genome browser plots scale: 0–10. (b) An example of co-accessibility anchored at the promoter for the alpha cell identity TF ARX. (c) An example of shared co-accessibility anchored at the promoter for the shared islet identity TF NEUROD1.
Extended Data Fig. 9. 3D chromatin interactions at the T2D-associated KCNQ1 locus.
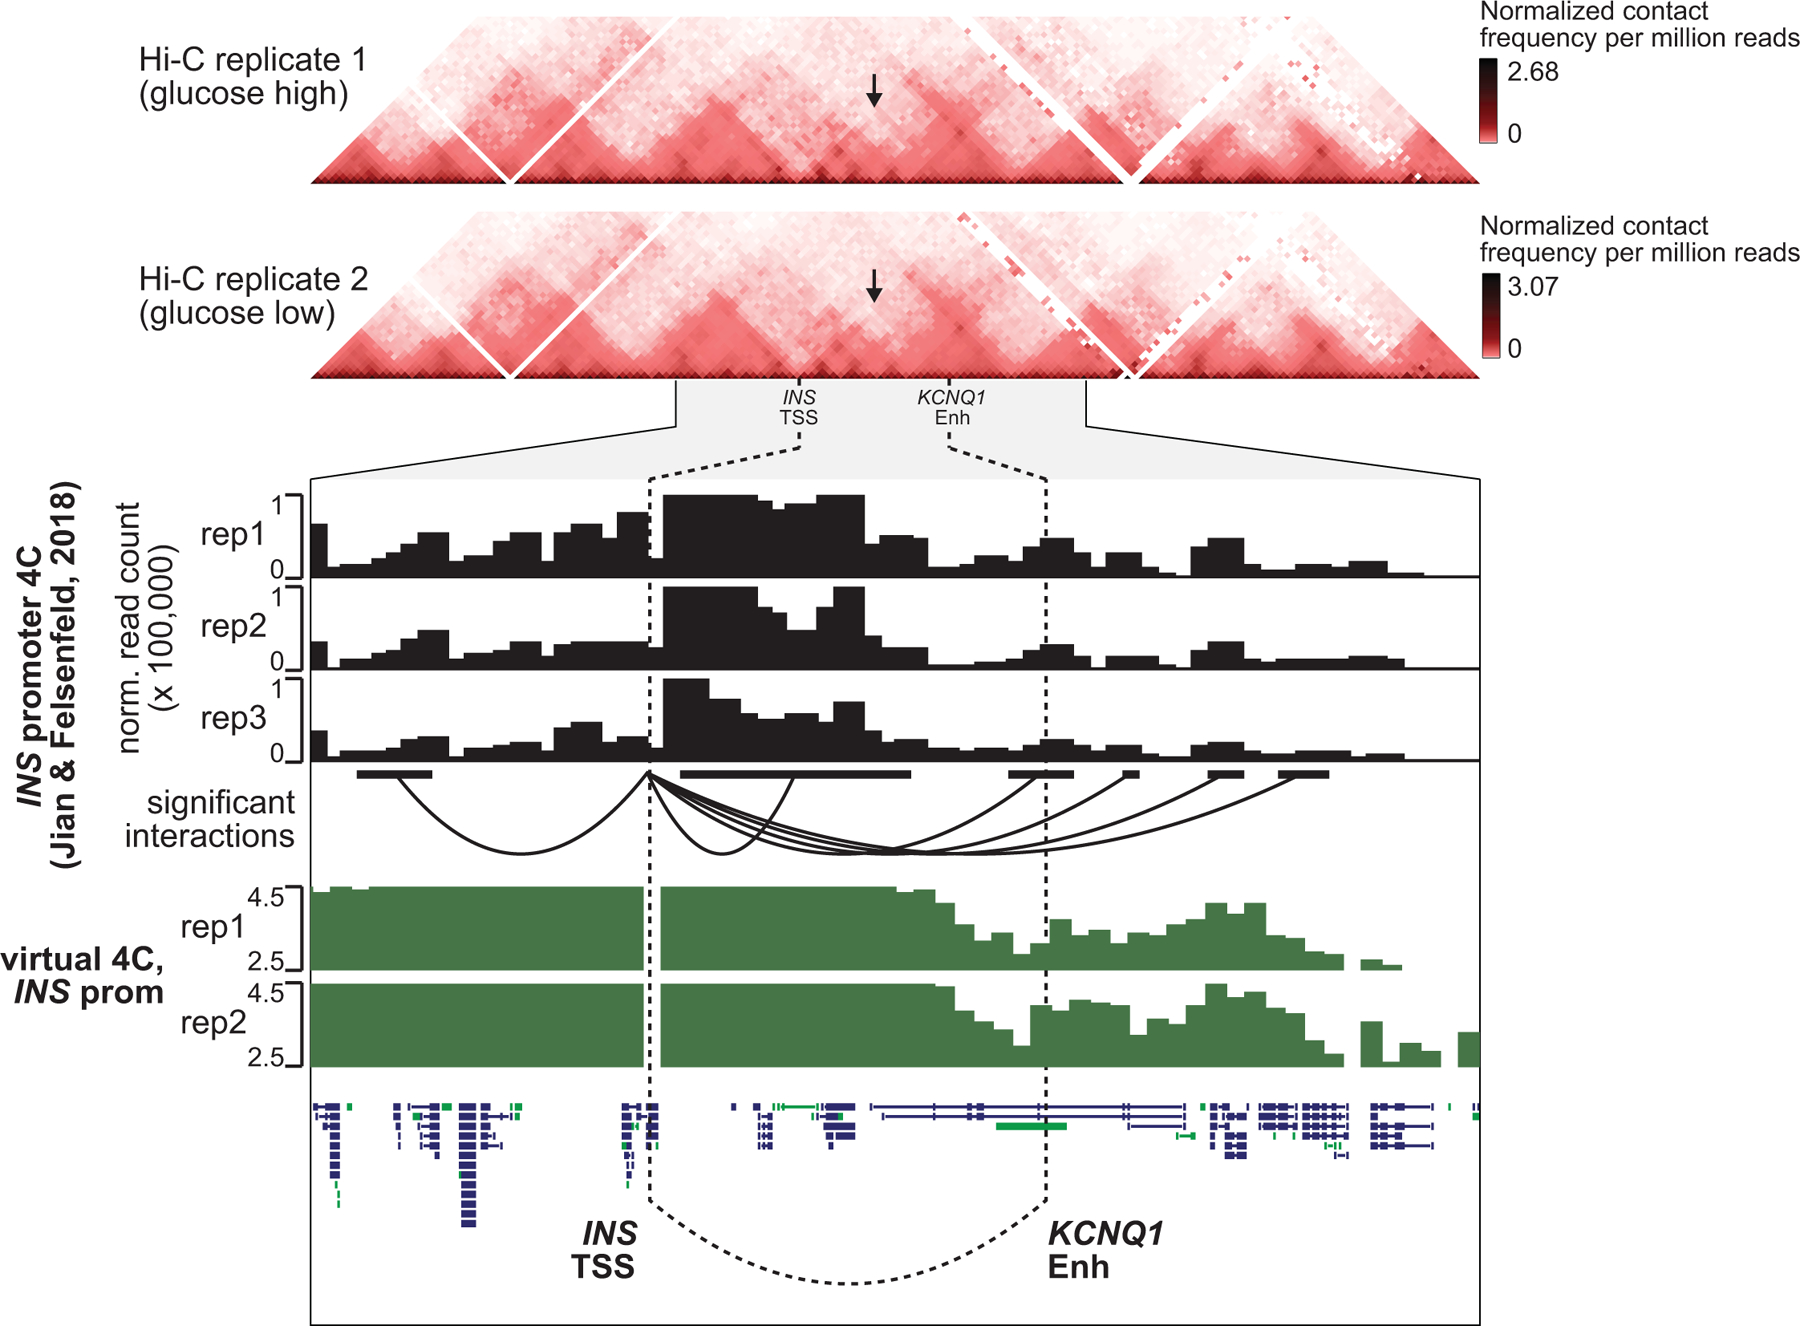
Top panels show Hi-C contact matrices from hESC-derived beta cells, visualized at 25 kb resolution. Region shown is chr11:500,00–4,500,000, hg19. Black arrows indicate putative interaction point of INS TSS and KCNQ1 enhancer. Genome browser plot below shows a zoomed view of chr11:1,750,000–3,250,000. Data from 4C-seq anchored on the INS promoter in EndoC-βH1 cells (Jian & Felsenfeld 2018) is shown, as analyzed with the 4C-ker package. Normalized read counts are shown in black from 3 biological replicates. Significant interactions from INS promoter are shown as arcs below read counts tracks. Interactions calls are from data pooled across 3 replicates are shown here. The region containing the KCNQ1 enhancer was called as a significant interaction region with INS promotor independently in each 4C replicate. Virtual 4C plots in green show log(normalized Hi-C interaction frequency) from INS promoter.
Extended Data Fig. 10. Genome editing of the KCNQ1 locus in hESCs.
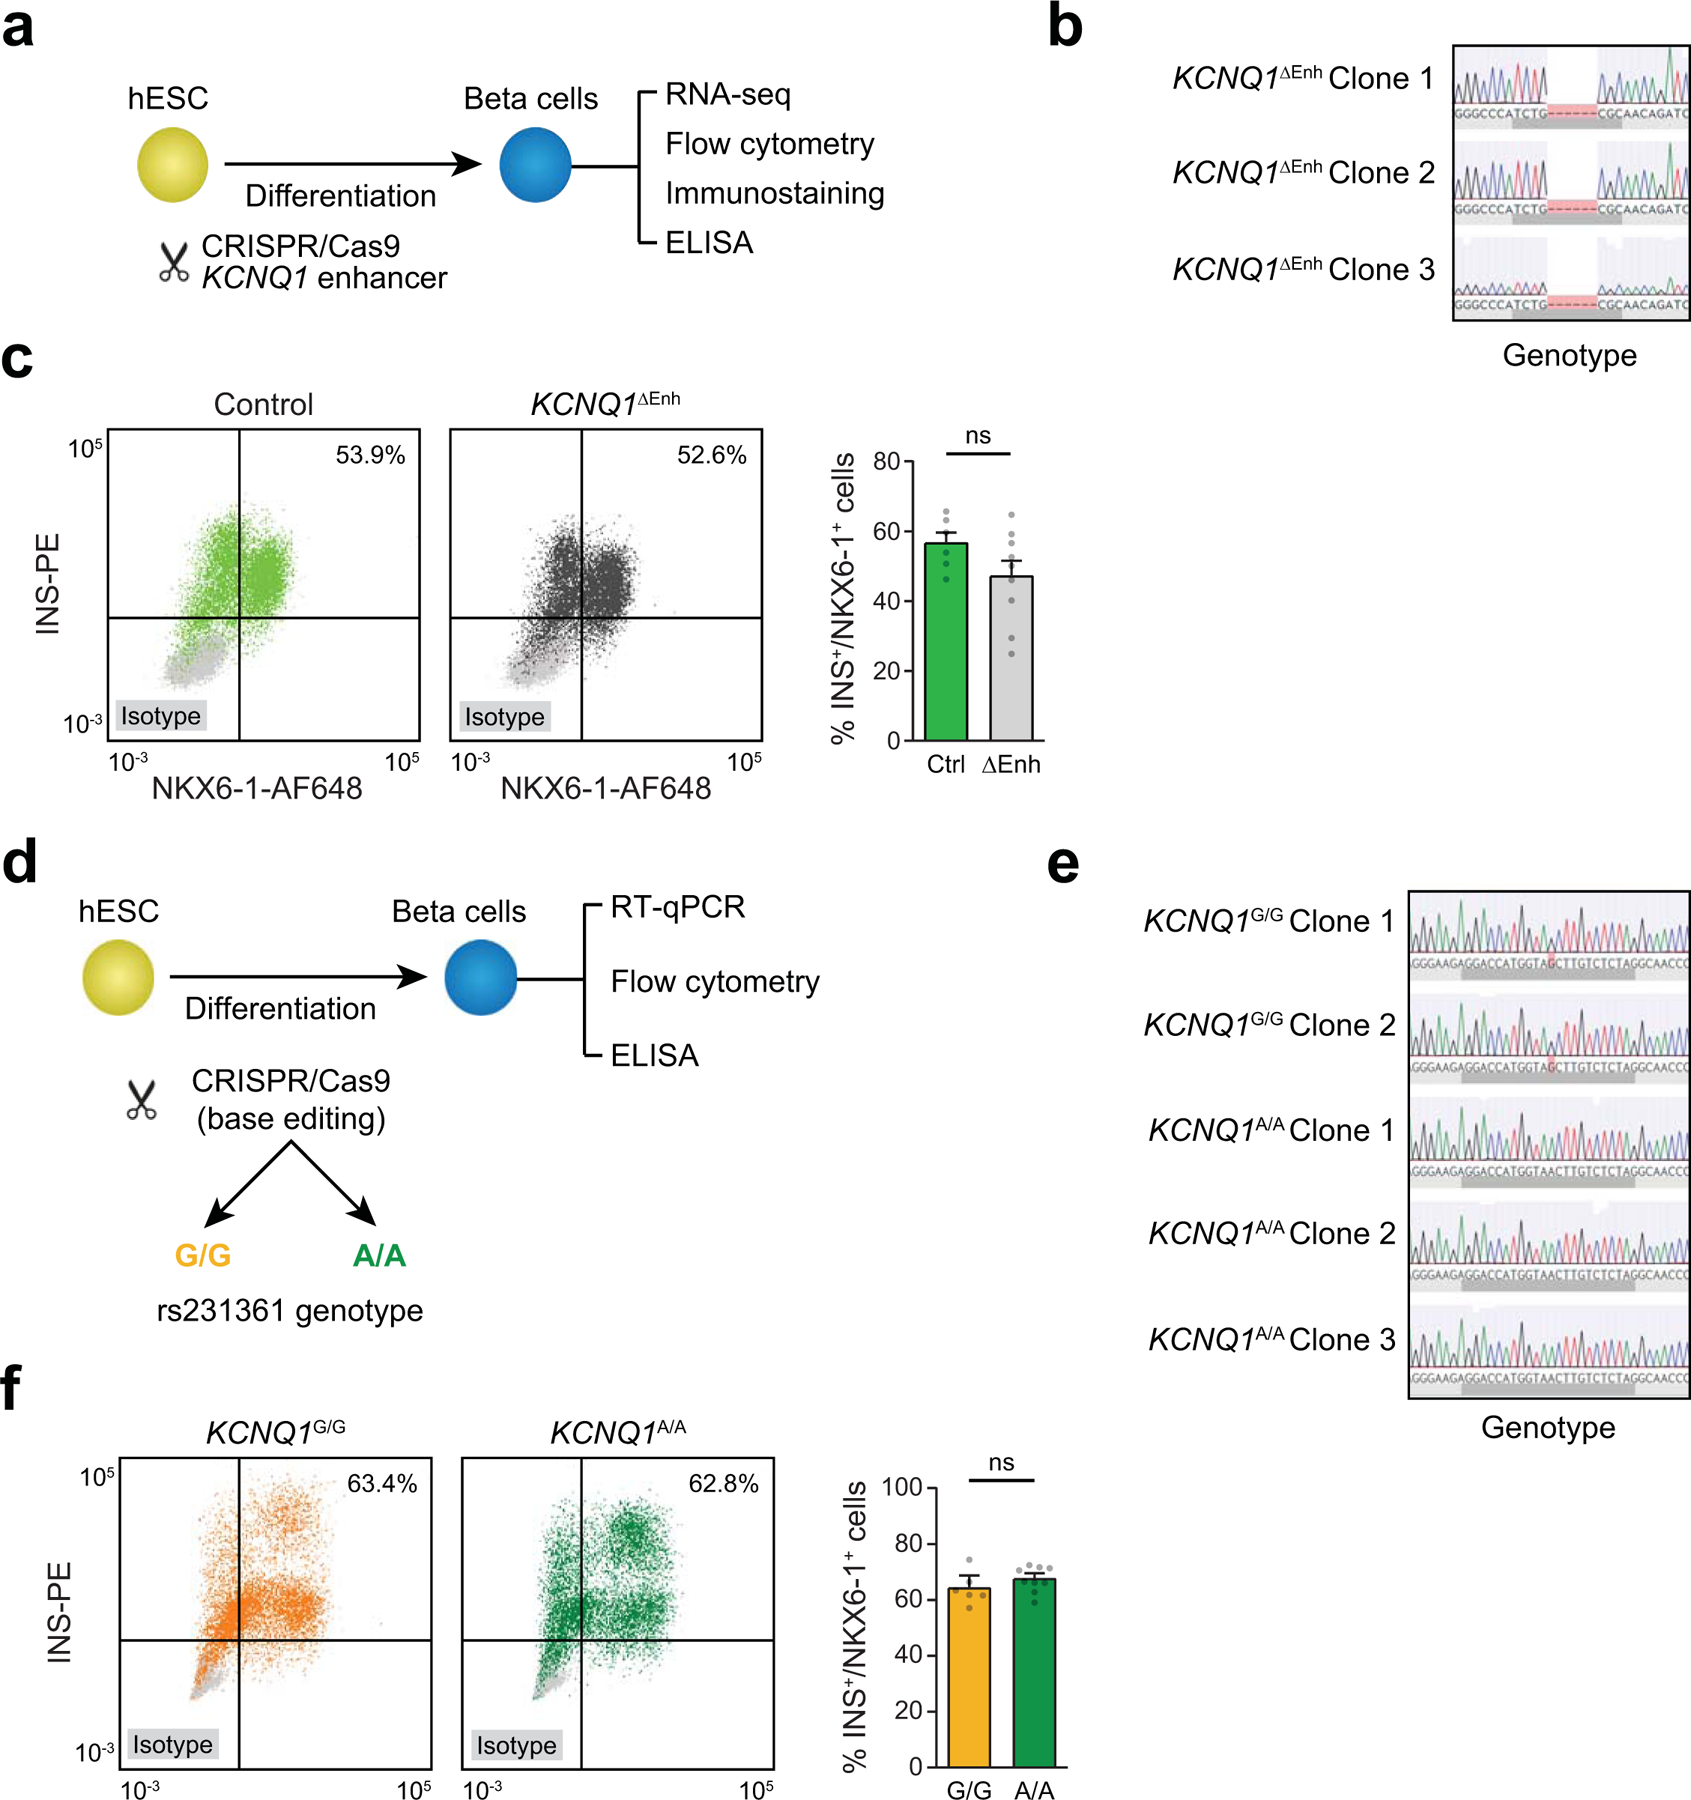
(a) Schematic of the workflow and (b) Sanger sequencing for KCNQ1 enhancer deletion in three independent hESC clones. (c) Representative figures of flow cytometry analysis for NKX6–1 and INS comparing control and KCNQ1ΔEnh cells (left). Quantification of the percentage of NKX6–1+/INS+ cells in beta cell stage cultures from control (n=6; 2 clones × 3 differentiations) and KCNQ1∆Enh (n=9; 3 clones × 3 differentiations) cells (right). Values represent mean and SEM. ns, not significant by two-sided Student’s T-test without adjustment for multiple comparisons. (d) Schematic of the workflow and (e) Sanger sequencing for two independent KCNQ1G/G clones and three KCNQ1A/A clones. (f) Representative figures of flow cytometry analysis for NKX6–1 and INS comparing KCNQ1G/G and KCNQ1A/A clones (left). of the percentage of NKX6–1+/INS+ cells in beta cell stage cultures from KCNQ1G/G (n=6; 2 clones × 3 differentiations) and KCNQ1A/A (n=9; 3 clones × 3 differentiations) cells (right). ns, not significant by two-sided Student’s T-test without adjustment for multiple comparisons. Values represent mean and SEM.
Supplementary Material
ACKNOWLEDGEMENTS
This work was supported by NIH R01DK114650 and U01DK105554 (sub-award) to K.G., R01DK068471 and U01DK105541 to M.S., U01DK120429 to K.G. and M.S., and by the UC San Diego School of Medicine to the Center for Epigenomics. We thank the QB3 Macrolab at UC Berkeley for purification of the Tn5 transposase. We thank K. Jepsen, UCSD IGM Genomics Center, and S. Kuan for sequencing and B. Li for bioinformatics support. Data from the UK Biobank was accessed under application 24058. We thank I. Matta for preparation of RNA-seq libraries.
Footnotes
CODE AVAILABILITY
Code for processing and clustering the snATAC-seq datasets is available at:https://github.com/kjgaulton/pipelines/tree/master/islet_snATAC_pipeline.
COMPETING INTERESTS STATEMENT
K.J.G. does consulting for Genentech and holds stock in Vertex Pharmaceuticals, neither of which is related to the work in this study. No other authors have competing interests to disclose.
DATA AVAILABILITY
Raw sequencing data have been deposited into the NCBI Gene Expression Omnibus (GEO) with accession numbers GSE160472, GSE160473, and GSE163610. Processed data files and annotations for snATAC-seq are available through the Diabetes Epigenome Atlas (https://www.diabetesepigenome.org/). All other data are either contained within the article or available upon request to the corresponding author.
REFERENCES
- 1.Maurano MT et al. Systematic Localization of Common Disease-Associated Variation in Regulatory DNA. Science 337, 1190–1195 (2012). [DOI] [PMC free article] [PubMed] [Google Scholar]
- 2.Cusanovich DA et al. Multiplex Single Cell Profiling of Chromatin Accessibility by Combinatorial Cellular Indexing. Science 348, 910–914 (2015). [DOI] [PMC free article] [PubMed] [Google Scholar]
- 3.Buenrostro JD et al. Single-cell chromatin accessibility reveals principles of regulatory variation. Nature 523, 486–490 (2015). [DOI] [PMC free article] [PubMed] [Google Scholar]
- 4.Preissl S et al. Single-nucleus analysis of accessible chromatin in developing mouse forebrain reveals cell-type-specific transcriptional regulation. Nat. Neurosci 21, 432–439 (2018). [DOI] [PMC free article] [PubMed] [Google Scholar]
- 5.Litzenburger UM et al. Single-cell epigenomic variability reveals functional cancer heterogeneity. Genome Biol 18, 15 (2017). [DOI] [PMC free article] [PubMed] [Google Scholar]
- 6.Buenrostro JD et al. Integrated Single-Cell Analysis Maps the Continuous Regulatory Landscape of Human Hematopoietic Differentiation. Cell 173, 1535–1548.e16 (2018). [DOI] [PMC free article] [PubMed] [Google Scholar]
- 7.Ulirsch JC et al. Interrogation of human hematopoiesis at single-cell and single-variant resolution. Nat. Genet 51, 683–693 (2019). [DOI] [PMC free article] [PubMed] [Google Scholar]
- 8.Pliner HA et al. Cicero Predicts cis-Regulatory DNA Interactions from Single-Cell Chromatin Accessibility Data. Mol. Cell 71, 858–871.e8 (2018). [DOI] [PMC free article] [PubMed] [Google Scholar]
- 9.Mahajan A et al. Fine-mapping type 2 diabetes loci to single-variant resolution using high-density imputation and islet-specific epigenome maps. Nat. Genet 50, 1505–1513 (2018). [DOI] [PMC free article] [PubMed] [Google Scholar]
- 10.Wood AR et al. A Genome-Wide Association Study of IVGTT-Based Measures of First-Phase Insulin Secretion Refines the Underlying Physiology of Type 2 Diabetes Variants. Diabetes 66, 2296–2309 (2017). [DOI] [PMC free article] [PubMed] [Google Scholar]
- 11.Dupuis J et al. New genetic loci implicated in fasting glucose homeostasis and their impact on type 2 diabetes risk. Nat. Genet 42, 105–116 (2010). [DOI] [PMC free article] [PubMed] [Google Scholar]
- 12.Manning AK et al. A genome-wide approach accounting for body mass index identifies genetic variants influencing fasting glycemic traits and insulin resistance. Nat. Genet 44, 659–669 (2012). [DOI] [PMC free article] [PubMed] [Google Scholar]
- 13.Scott RA et al. Large-scale association analyses identify new loci influencing glycemic traits and provide insight into the underlying biological pathways. Nat. Genet 44, 991–1005 (2012). [DOI] [PMC free article] [PubMed] [Google Scholar]
- 14.Thurner M et al. Integration of human pancreatic islet genomic data refines regulatory mechanisms at Type 2 Diabetes susceptibility loci. eLife 7, (2018). [DOI] [PMC free article] [PubMed] [Google Scholar]
- 15.Fuchsberger C et al. The genetic architecture of type 2 diabetes. Nature 536, 41–47 (2016). [DOI] [PMC free article] [PubMed] [Google Scholar]
- 16.Gaulton KJ et al. A map of open chromatin in human pancreatic islets. Nat. Genet 42, 255–259 (2010). [DOI] [PMC free article] [PubMed] [Google Scholar]
- 17.Gaulton KJ et al. Genetic fine mapping and genomic annotation defines causal mechanisms at type 2 diabetes susceptibility loci. Nat. Genet 47, 1415–1425 (2015). [DOI] [PMC free article] [PubMed] [Google Scholar]
- 18.Pasquali L et al. Pancreatic islet enhancer clusters enriched in type 2 diabetes risk-associated variants. Nat. Genet 46, 136–143 (2014). [DOI] [PMC free article] [PubMed] [Google Scholar]
- 19.van der Meulen T et al. Urocortin3 mediates somatostatin-dependent negative feedback control of insulin secretion. Nat. Med 21, 769–776 (2015). [DOI] [PMC free article] [PubMed] [Google Scholar]
- 20.Caicedo A Paracrine and autocrine interactions in the human islet: more than meets the eye. Semin. Cell Dev. Biol 24, 11–21 (2013). [DOI] [PMC free article] [PubMed] [Google Scholar]
- 21.DiGruccio MR et al. Comprehensive alpha, beta and delta cell transcriptomes reveal that ghrelin selectively activates delta cells and promotes somatostatin release from pancreatic islets. Mol. Metab 5, 449–458 (2016). [DOI] [PMC free article] [PubMed] [Google Scholar]
- 22.Dorrell C et al. Human islets contain four distinct subtypes of β cells. Nat. Commun 7, ncomms11756 (2016). [DOI] [PMC free article] [PubMed] [Google Scholar]
- 23.Xin Y et al. Pseudotime Ordering of Single Human β-Cells Reveals States of Insulin Production and Unfolded Protein Response. Diabetes db180365 (2018) doi: 10.2337/db18-0365. [DOI] [PubMed] [Google Scholar]
- 24.Korsunsky I et al. Fast, sensitive and accurate integration of single-cell data with Harmony. Nat. Methods 16, 1289–1296 (2019). [DOI] [PMC free article] [PubMed] [Google Scholar]
- 25.Bader E et al. Identification of proliferative and mature β-cells in the islets of Langerhans. Nature 535, 430–434 (2016). [DOI] [PubMed] [Google Scholar]
- 26.Liu JSE & Hebrok M All mixed up: defining roles for β-cell subtypes in mature islets. Genes Dev 31, 228–240 (2017). [DOI] [PMC free article] [PubMed] [Google Scholar]
- 27.Greenwald WW et al. Pancreatic islet chromatin accessibility and conformation reveals distal enhancer networks of type 2 diabetes risk. Nat. Commun 10, 1–12 (2019). [DOI] [PMC free article] [PubMed] [Google Scholar]
- 28.Khetan S et al. Type 2 Diabetes-Associated Genetic Variants Regulate Chromatin Accessibility in Human Islets. Diabetes 67, 2466–2477 (2018). [DOI] [PMC free article] [PubMed] [Google Scholar]
- 29.Varshney A et al. Genetic regulatory signatures underlying islet gene expression and type 2 diabetes. Proc. Natl. Acad. Sci. U. S. A 114, 2301–2306 (2017). [DOI] [PMC free article] [PubMed] [Google Scholar]
- 30.Baron M et al. A Single-Cell Transcriptomic Map of the Human and Mouse Pancreas Reveals Inter- and Intra-cell Population Structure. Cell Syst 3, 346–360.e4 (2016). [DOI] [PMC free article] [PubMed] [Google Scholar]
- 31.Galvagni F et al. CD93 and dystroglycan cooperation in human endothelial cell adhesion and migration adhesion and migration. Oncotarget 7, 10090–10103 (2016). [DOI] [PMC free article] [PubMed] [Google Scholar]
- 32.Zhang Y et al. Model-based analysis of ChIP-Seq (MACS). Genome Biol 9, R137 (2008). [DOI] [PMC free article] [PubMed] [Google Scholar]
- 33.Schep AN, Wu B, Buenrostro JD & Greenleaf WJ chromVAR: inferring transcription-factor-associated accessibility from single-cell epigenomic data. Nat. Methods 14, 975–978 (2017). [DOI] [PMC free article] [PubMed] [Google Scholar]
- 34.Khan A et al. JASPAR 2018: update of the open-access database of transcription factor binding profiles and its web framework. Nucleic Acids Res 46, D1284 (2018). [DOI] [PMC free article] [PubMed] [Google Scholar]
- 35.Wilson ME, Scheel D & German MS Gene expression cascades in pancreatic development. Mech. Dev 120, 65–80 (2003). [DOI] [PubMed] [Google Scholar]
- 36.Conrad E et al. The MAFB transcription factor impacts islet α-cell function in rodents and represents a unique signature of primate islet β-cells. Am. J. Physiol. Endocrinol. Metab 310, E91–E102 (2016). [DOI] [PMC free article] [PubMed] [Google Scholar]
- 37.Katoh MC et al. MafB Is Critical for Glucagon Production and Secretion in Mouse Pancreatic α Cells In Vivo. Mol. Cell. Biol 38, (2018). [DOI] [PMC free article] [PubMed] [Google Scholar]
- 38.Nishimura W, Takahashi S & Yasuda K MafA is critical for maintenance of the mature beta cell phenotype in mice. Diabetologia 58, 566–574 (2015). [DOI] [PubMed] [Google Scholar]
- 39.Ozato K, Tailor P & Kubota T The interferon regulatory factor family in host defense: mechanism of action. J. Biol. Chem 282, 20065–20069 (2007). [DOI] [PubMed] [Google Scholar]
- 40.De Val S & Black BL Transcriptional Control of Endothelial Cell Development. Dev. Cell 16, 180–195 (2009). [DOI] [PMC free article] [PubMed] [Google Scholar]
- 41.Segerstolpe Å et al. Single-Cell Transcriptome Profiling of Human Pancreatic Islets in Health and Type 2 Diabetes. Cell Metab 24, 593–607 (2016). [DOI] [PMC free article] [PubMed] [Google Scholar]
- 42.Lawlor N et al. Single-cell transcriptomes identify human islet cell signatures and reveal cell-type–specific expression changes in type 2 diabetes. Genome Res 27, 208–222 (2017). [DOI] [PMC free article] [PubMed] [Google Scholar]
- 43.Mawla AM & Huising MO Navigating the Depths and Avoiding the Shallows of Pancreatic Islet Cell Transcriptomes. Diabetes 68, 1380–1393 (2019). [DOI] [PMC free article] [PubMed] [Google Scholar]
- 44.Camunas-Soler J et al. Patch-Seq Links Single-Cell Transcriptomes to Human Islet Dysfunction in Diabetes. Cell Metab 31, 1017–1031.e4 (2020). [DOI] [PMC free article] [PubMed] [Google Scholar]
- 45.Trapnell C et al. Pseudo-temporal ordering of individual cells reveals dynamics and regulators of cell fate decisions. Nat. Biotechnol 32, 381 (2014). [DOI] [PMC free article] [PubMed] [Google Scholar]
- 46.Parker SCJ et al. Chromatin stretch enhancer states drive cell-specific gene regulation and harbor human disease risk variants. Proc. Natl. Acad. Sci. U. S. A 110, 17921–17926 (2013). [DOI] [PMC free article] [PubMed] [Google Scholar]
- 47.Aylward A, Chiou J, Okino M-L, Kadakia N & Gaulton KJ Shared genetic risk contributes to type 1 and type 2 diabetes etiology. Hum. Mol. Genet (2018) doi: 10.1093/hmg/ddy314. [DOI] [PubMed] [Google Scholar]
- 48.Strawbridge RJ et al. Genome-wide association identifies nine common variants associated with fasting proinsulin levels and provides new insights into the pathophysiology of type 2 diabetes. Diabetes 60, 2624–2634 (2011). [DOI] [PMC free article] [PubMed] [Google Scholar]
- 49.Locke AE et al. Genetic studies of body mass index yield new insights for obesity biology. Nature 518, 197–206 (2015). [DOI] [PMC free article] [PubMed] [Google Scholar]
- 50.Saxena R et al. Genetic variation in GIPR influences the glucose and insulin responses to an oral glucose challenge. Nat. Genet 42, 142–148 (2010). [DOI] [PMC free article] [PubMed] [Google Scholar]
- 51.Wheeler E et al. Impact of common genetic determinants of Hemoglobin A1c on type 2 diabetes risk and diagnosis in ancestrally diverse populations: A transethnic genome-wide meta-analysis. PLoS Med 14, e1002383 (2017). [DOI] [PMC free article] [PubMed] [Google Scholar]
- 52.Schizophrenia Working Group of the Psychiatric Genomics Consortium. Biological insights from 108 schizophrenia-associated genetic loci. Nature 511, 421–427 (2014). [DOI] [PMC free article] [PubMed] [Google Scholar]
- 53.de Lange KM et al. Genome-wide association study implicates immune activation of multiple integrin genes in inflammatory bowel disease. Nat. Genet 49, 256–261 (2017). [DOI] [PMC free article] [PubMed] [Google Scholar]
- 54.Bentham J et al. Genetic association analyses implicate aberrant regulation of innate and adaptive immunity genes in the pathogenesis of systemic lupus erythematosus. Nat. Genet 47, 1457–1464 (2015). [DOI] [PMC free article] [PubMed] [Google Scholar]
- 55.Lambert JC et al. Meta-analysis of 74,046 individuals identifies 11 new susceptibility loci for Alzheimer’s disease. Nat. Genet 45, 1452–1458 (2013). [DOI] [PMC free article] [PubMed] [Google Scholar]
- 56.Wray NR et al. Genome-wide association analyses identify 44 risk variants and refine the genetic architecture of major depression. Nat. Genet 50, 668–681 (2018). [DOI] [PMC free article] [PubMed] [Google Scholar]
- 57.Nelson CP et al. Association analyses based on false discovery rate implicate new loci for coronary artery disease. Nat. Genet 49, 1385–1391 (2017). [DOI] [PubMed] [Google Scholar]
- 58.Nielsen JB et al. Biobank-driven genomic discovery yields new insight into atrial fibrillation biology. Nat. Genet 50, 1234–1239 (2018). [DOI] [PMC free article] [PubMed] [Google Scholar]
- 59.Cordell HJ et al. International genome-wide meta-analysis identifies new primary biliary cirrhosis risk loci and targetable pathogenic pathways. Nat. Commun 6, 8019 (2015). [DOI] [PMC free article] [PubMed] [Google Scholar]
- 60.Bulik-Sullivan B et al. An atlas of genetic correlations across human diseases and traits. Nat. Genet 47, 1236–1241 (2015). [DOI] [PMC free article] [PubMed] [Google Scholar]
- 61.Bulik-Sullivan BK et al. LD Score regression distinguishes confounding from polygenicity in genome-wide association studies. Nat. Genet 47, 291–295 (2015). [DOI] [PMC free article] [PubMed] [Google Scholar]
- 62.Finucane HK et al. Partitioning heritability by functional annotation using genome-wide association summary statistics. Nat. Genet 47, 1228–1235 (2015). [DOI] [PMC free article] [PubMed] [Google Scholar]
- 63.Scott RA et al. An Expanded Genome-Wide Association Study of Type 2 Diabetes in Europeans. Diabetes (2017) doi: 10.2337/db16-1253. [DOI] [PMC free article] [PubMed] [Google Scholar]
- 64.Pickrell JK Joint analysis of functional genomic data and genome-wide association studies of 18 human traits. Am. J. Hum. Genet 94, 559–573 (2014). [DOI] [PMC free article] [PubMed] [Google Scholar]
- 65.Lee D et al. A method to predict the impact of regulatory variants from DNA sequence. Nat. Genet 47, 955–961 (2015). [DOI] [PMC free article] [PubMed] [Google Scholar]
- 66.McCarthy S et al. A reference panel of 64,976 haplotypes for genotype imputation. Nat. Genet 48, 1279–1283 (2016). [DOI] [PMC free article] [PubMed] [Google Scholar]
- 67.Wingender E, Schoeps T, Haubrock M & Dönitz J TFClass: a classification of human transcription factors and their rodent orthologs. Nucleic Acids Res 43, D97–102 (2015). [DOI] [PMC free article] [PubMed] [Google Scholar]
- 68.Shlyueva D, Stampfel G & Stark A Transcriptional enhancers: from properties to genome-wide predictions. Nat. Rev. Genet 15, 272–286 (2014). [DOI] [PubMed] [Google Scholar]
- 69.Schmitt AD, Hu M & Ren B Genome-wide mapping and analysis of chromosome architecture. Nat. Rev. Mol. Cell Biol 17, 743–755 (2016). [DOI] [PMC free article] [PubMed] [Google Scholar]
- 70.Thurman RE et al. The accessible chromatin landscape of the human genome. Nature 489, 75–82 (2012). [DOI] [PMC free article] [PubMed] [Google Scholar]
- 71.Miguel-Escalada I et al. Human pancreatic islet three-dimensional chromatin architecture provides insights into the genetics of type 2 diabetes. Nat. Genet 51, 1137–1148 (2019). [DOI] [PMC free article] [PubMed] [Google Scholar]
- 72.Jian X & Felsenfeld G Insulin promoter in human pancreatic β cells contacts diabetes susceptibility loci and regulates genes affecting insulin metabolism. Proc. Natl. Acad. Sci. U. S. A 115, E4633–E4641 (2018). [DOI] [PMC free article] [PubMed] [Google Scholar]
- 73.Lawlor N et al. Multiomic Profiling Identifies cis-Regulatory Networks Underlying Human Pancreatic β Cell Identity and Function. Cell Rep 26, 788–801.e6 (2019). [DOI] [PMC free article] [PubMed] [Google Scholar]
- 74.Rezania A et al. Reversal of diabetes with insulin-producing cells derived in vitro from human pluripotent stem cells. Nat. Biotechnol 32, 1121–1133 (2014). [DOI] [PubMed] [Google Scholar]
- 75.Claussnitzer M et al. FTO Obesity Variant Circuitry and Adipocyte Browning in Humans. N. Engl. J. Med 373, 895–907 (2015). [DOI] [PMC free article] [PubMed] [Google Scholar]
- 76.Fogarty MP, Cannon ME, Vadlamudi S, Gaulton KJ & Mohlke KL Identification of a regulatory variant that binds FOXA1 and FOXA2 at the CDC123/CAMK1D type 2 diabetes GWAS locus. PLoS Genet 10, e1004633 (2014). [DOI] [PMC free article] [PubMed] [Google Scholar]
- 77.Rusu V et al. Type 2 Diabetes Variants Disrupt Function of SLC16A11 through Two Distinct Mechanisms. Cell 170, 199–212.e20 (2017). [DOI] [PMC free article] [PubMed] [Google Scholar]
- 78.Carrat GR et al. Decreased STARD10 Expression Is Associated with Defective Insulin Secretion in Humans and Mice. Am. J. Hum. Genet 100, 238–256 (2017). [DOI] [PMC free article] [PubMed] [Google Scholar]
- 79.Claussnitzer M et al. Leveraging cross-species transcription factor binding site patterns: from diabetes risk loci to disease mechanisms. Cell 156, 343–358 (2014). [DOI] [PMC free article] [PubMed] [Google Scholar]
- 80.Roman TS et al. A Type 2 Diabetes-Associated Functional Regulatory Variant in a Pancreatic Islet Enhancer at the Adcy5 Locus. Diabetes db170464 (2017) doi: 10.2337/db17-0464. [DOI] [PMC free article] [PubMed] [Google Scholar]
- 81.Kycia I et al. A Common Type 2 Diabetes Risk Variant Potentiates Activity of an Evolutionarily Conserved Islet Stretch Enhancer and Increases C2CD4A and C2CD4B Expression. Am. J. Hum. Genet 102, 620–635 (2018). [DOI] [PMC free article] [PubMed] [Google Scholar]
- 82.Avrahami D, Klochendler A, Dor Y & Glaser B Beta cell heterogeneity: an evolving concept. Diabetologia 60, 1363–1369 (2017). [DOI] [PMC free article] [PubMed] [Google Scholar]
- 83.Modi H et al. Ins2 gene bursting activity defines a mature β-cell state. bioRxiv 702589 (2019) doi: 10.1101/702589. [DOI] [Google Scholar]
- 84.Farack L et al. Transcriptional Heterogeneity of Beta Cells in the Intact Pancreas. Dev. Cell 48, 115–125.e4 (2019). [DOI] [PubMed] [Google Scholar]
- 85.Rai V et al. Single-cell ATAC-Seq in human pancreatic islets and deep learning upscaling of rare cells reveals cell-specific type 2 diabetes regulatory signatures. Mol. Metab (2019) doi: 10.1016/j.molmet.2019.12.006. [DOI] [PMC free article] [PubMed] [Google Scholar]
- 86.ENCODE Project Consortium. An integrated encyclopedia of DNA elements in the human genome. Nature 489, 57–74 (2012). [DOI] [PMC free article] [PubMed] [Google Scholar]
- 87.Amemiya HM, Kundaje A & Boyle AP The ENCODE Blacklist: Identification of Problematic Regions of the Genome. Sci. Rep 9, 1–5 (2019). [DOI] [PMC free article] [PubMed] [Google Scholar]
- 88.Wolf FA, Angerer P & Theis FJ SCANPY: large-scale single-cell gene expression data analysis. Genome Biol 19, 15 (2018). [DOI] [PMC free article] [PubMed] [Google Scholar]
- 89.Traag VA, Waltman L & van Eck NJ From Louvain to Leiden: guaranteeing well-connected communities. Sci. Rep 9, 1–12 (2019). [DOI] [PMC free article] [PubMed] [Google Scholar]
- 90.Arda HE et al. A Chromatin Basis for Cell Lineage and Disease Risk in the Human Pancreas. Cell Syst 7, 310–322.e4 (2018). [DOI] [PMC free article] [PubMed] [Google Scholar]
- 91.Ackermann AM, Wang Z, Schug J, Naji A & Kaestner KH Integration of ATAC-seq and RNA-seq identifies human alpha cell and beta cell signature genes. Mol. Metab 5, 233–244 (2016). [DOI] [PMC free article] [PubMed] [Google Scholar]
- 92.Quinlan AR & Hall IM BEDTools: a flexible suite of utilities for comparing genomic features. Bioinformatics 26, 841–842 (2010). [DOI] [PMC free article] [PubMed] [Google Scholar]
- 93.Kuleshov MV et al. Enrichr: a comprehensive gene set enrichment analysis web server 2016 update. Nucleic Acids Res 44, W90–97 (2016). [DOI] [PMC free article] [PubMed] [Google Scholar]
- 94.Subramanian A et al. Gene set enrichment analysis: a knowledge-based approach for interpreting genome-wide expression profiles. Proc. Natl. Acad. Sci. U. S. A 102, 15545–15550 (2005). [DOI] [PMC free article] [PubMed] [Google Scholar]
- 95.Li YI et al. RNA splicing is a primary link between genetic variation and disease. Science 352, 600–604 (2016). [DOI] [PMC free article] [PubMed] [Google Scholar]
- 96.Bailey TL et al. MEME SUITE: tools for motif discovery and searching. Nucleic Acids Res 37, W202–208 (2009). [DOI] [PMC free article] [PubMed] [Google Scholar]
- 97.van de Geijn B, McVicker G, Gilad Y & Pritchard JK WASP: allele-specific software for robust molecular quantitative trait locus discovery. Nat. Methods 12, 1061–1063 (2015). [DOI] [PMC free article] [PubMed] [Google Scholar]
- 98.Durand NC et al. Juicer Provides a One-Click System for Analyzing Loop-Resolution Hi-C Experiments. Cell Syst 3, 95–98 (2016). [DOI] [PMC free article] [PubMed] [Google Scholar]
- 99.Kerpedjiev P et al. HiGlass: web-based visual exploration and analysis of genome interaction maps. Genome Biol 19, 125 (2018). [DOI] [PMC free article] [PubMed] [Google Scholar]
- 100.Raviram R et al. 4C-ker: A Method to Reproducibly Identify Genome-Wide Interactions Captured by 4C-Seq Experiments. PLoS Comput. Biol 12, e1004780 (2016). [DOI] [PMC free article] [PubMed] [Google Scholar]
- 101.Langmead B & Salzberg SL Fast gapped-read alignment with Bowtie 2. Nat. Methods 9, 357–359 (2012). [DOI] [PMC free article] [PubMed] [Google Scholar]
- 102.Velazco-Cruz L et al. Acquisition of Dynamic Function in Human Stem Cell-Derived β Cells. Stem Cell Rep 12, 351–365 (2019). [DOI] [PMC free article] [PubMed] [Google Scholar]
Associated Data
This section collects any data citations, data availability statements, or supplementary materials included in this article.
Supplementary Materials
Data Availability Statement
Raw sequencing data have been deposited into the NCBI Gene Expression Omnibus (GEO) with accession numbers GSE160472, GSE160473, and GSE163610. Processed data files and annotations for snATAC-seq are available through the Diabetes Epigenome Atlas (https://www.diabetesepigenome.org/). All other data are either contained within the article or available upon request to the corresponding author.


