

Abstract
Human embryonic stem cells (hESCs) can be maintained in culture over a large number of passages while maintaining apparently normal colony morphology. However, recent reports describe variability in epigenetic states in comparisons among different human ES cell lines. These epigenetic differences include changes in CpG methylation, expression of imprinted genes, and the status of X chromosome inactivation (XCI). We report here that the status of XCI in the female hESC line H9 (WA09) is hypervariable. We find that XIST expression can differ between individual culture isolates of H9. In addition, we find that XIST expression status can vary even between different colonies present within the same H9 culture, effectively rendering the culture mosaic. H9 cultures that lack XIST expression, but have cytological evidence of completed XCI, can also exhibit altered response to BMP4, a growth factor known to induce differentiation of hESCs to a trophectodermal lineage. In the same cultures we find biallelic expression of X-linked genes suggesting that these lines consist of mixtures of cells that retain inactivation of one of two X chromosomes following random choice. Prolonged culture of the XIST-negative isolates to high passage numbers did not result in changes in global epiproteomic signatures, demonstrating rather stable levels of post-translational nucleosome modifications within the culture-adapted hESC lines. The results show that epigenetic variants arise within human ES cell cultures after cell line derivation. In addition, the results indicate that apparently normal cultures of hESCs may contain mixtures of cells with differing epigenetic states. Assays of epigenetic integrity are warranted as quality control measures for the culture of hESCs.
Keywords: human embryonic stem cells, X chromosome inactivation, XIST, epigenetics, nucleosome-ELISA
Introduction
Since the derivation of the first five human embryonic stem cell (hESC) lines from the inner cell mass (ICM) of human blastocysts,1 more than 200 independent hESC lines have been isolated by using a wide variety of derivation approaches and subsequent culturing procedures. hESCs can proliferate indefinitely in culture while maintaining the capacity to differentiate into cell-types of all three germ layers2 and, as such, hold great promise as models for the study of developmental processes and for future cell-based therapies. Epigenetic mechanisms are emerging as key factors that control the maintenance of pluripotency, self-renewal and lineage specification of hESCs.3 The blastocyst stage, which represents the first event of cellular differentiation in the developing embryo, is characterized by high levels of epigenetic activity. However, the stability of ICM-imposed epigenetic programs in hESCs remains in question.
In general, hESC lines in use today exhibit similar expression profiles for both cell-surface antigens and developmentally-regulated pluripotency genes.4–6 On the other hand, a growing number of reports show that hESCs exhibit considerable variability at an epigenetic level. For instance, the genomic distribution of 5-methylcytosine within CpG dinucleotides varies somewhat between hESC lines, and these patterns drift as the number of passages increase during continued culture.7 In addition, several imprinted genes exhibit variability in their status of imprinted expression in comparisons between different hESC lines.4,8
Yet another example of epigenetic gene regulation in mammalian cells is X chromosome inactivation, a process in which genes are transcriptionally silenced on one of the two X chromosomes present within each female cell. X chromosome inactivation occurs during early mammalian development at about the stage at which ESCs are derived and requires the action of the large non-coding RNA, XIST. XIST is expressed in human preimplantation embryos,9 but at levels that fail to silence X-linked genes. The presence of low amounts of XIST transcript most likely reflects leakiness rather than developmentally-controlled expression. The situation is similar to the mouse model system where ICM-derived, undifferentiated murine ESCs show the presence of two active X chromosomes, with random inactivation of one of them occurring upon differentiation. At least one report has demonstrated random X inactivation during differentiation of hESCs as well,10 but it is clear that X chromosome inactivation is far more variable in hESCs as compared to mouse ESCs.11–13 For instance, levels of expression of XIST RNA vary considerably in hESCs in comparisons among several different female hESC lines.4 Another recent study performed on the female hESC line H9 showed that even in an undifferentiated state, virtually all cells demonstrated robust inactivation of one of the two X chromosomes present.14 This same study found that female hESC line H7 exhibited no demonstrable XIST expression, even when the cells were differentiated into embryoid bodies.
Abundant data exist to show that epigenetic variability exists in preimplantation embryos, especially those that have been produced by in vitro approaches. The in vitro culture of preimplantation mouse embryos can lead to reduced viability after embryo transfer, reduced fetal weight and imprinting defects.15,16 Aberrant imprinting also occurs in the placenta of mouse conceptuses derived by implantation of embryos cultured to the blastocyst stage in vitro.17 In addition, murine preimplantation embryo culture and embryo transfer can lead to alterations in cardiovascular physiology and activity of enzymes that regulate cardiovascular homeostasis.18 In humans, concern exists about the apparent increased incidence of epigenetic disorders in children who are conceived through assisted reproductive technologies (ART).19 Since hESCs are derived after embryo culture to the blastocyst stage after using ART methodologies, human ESCs may harbor epigenetic alterations that can render them potentially risky for use in therapeutics.
Here, we show that variation exists in the X inactivation status of individual colonies present within the same H9 hESC culture. We also report that epigenetic instability is evident when different culture isolates of the same hESC line are compared. These results demonstrate that standard culture conditions for hESCs fail to prevent epigenetic variability. H9 hESCs with altered X chromosome inactivation status can also exhibit unusual responses to BMP4, a growth factor know to induce trophectoderm in hESCs. However, prolonged culture of H9 hESCs to high passage number did not affect global epiproteomic signatures as judged by nucleosome-ELISA assays.20 These results point to the need to develop reliable and expedient approaches to assess the epigenetic quality of hESCs if they are to be used in future cell-based therapeutics.
Results
We examined the status of XCI in hESC cultures grown in different laboratories and for varying passage numbers. To investigate the status of XCI in the female hESC line H9 grown at University of Missouri (MO), we performed RNA FISH analysis for XIST over the course of two passages using Cy3-dCTP-labeled cDNA probe (Fig. S1). XIST RNA FISH signals coincided with DAPI-stained Barr Bodies (Fig. 1A, parts i–iii). We observed colonies of two types: (1) those in which virtually every cell in the colony contained an intense XIST FISH signal corresponding to the inactive X chromosome (Xi) (Fig. 1A, parts iv and vi), and (2) others in which every cell exhibited no apparent X inactivation and whose nuclei were devoid of XIST spots (Fig. 1A, part v). In contrast, we never detected inactive X chromosomes in the female hESC line H7 assessed at two passages (Fig. 1A, part vii). A male hESC line, H1, had no cells with inactive X chromosomes as judged by XIST FISH (data not shown).
Figure 1.
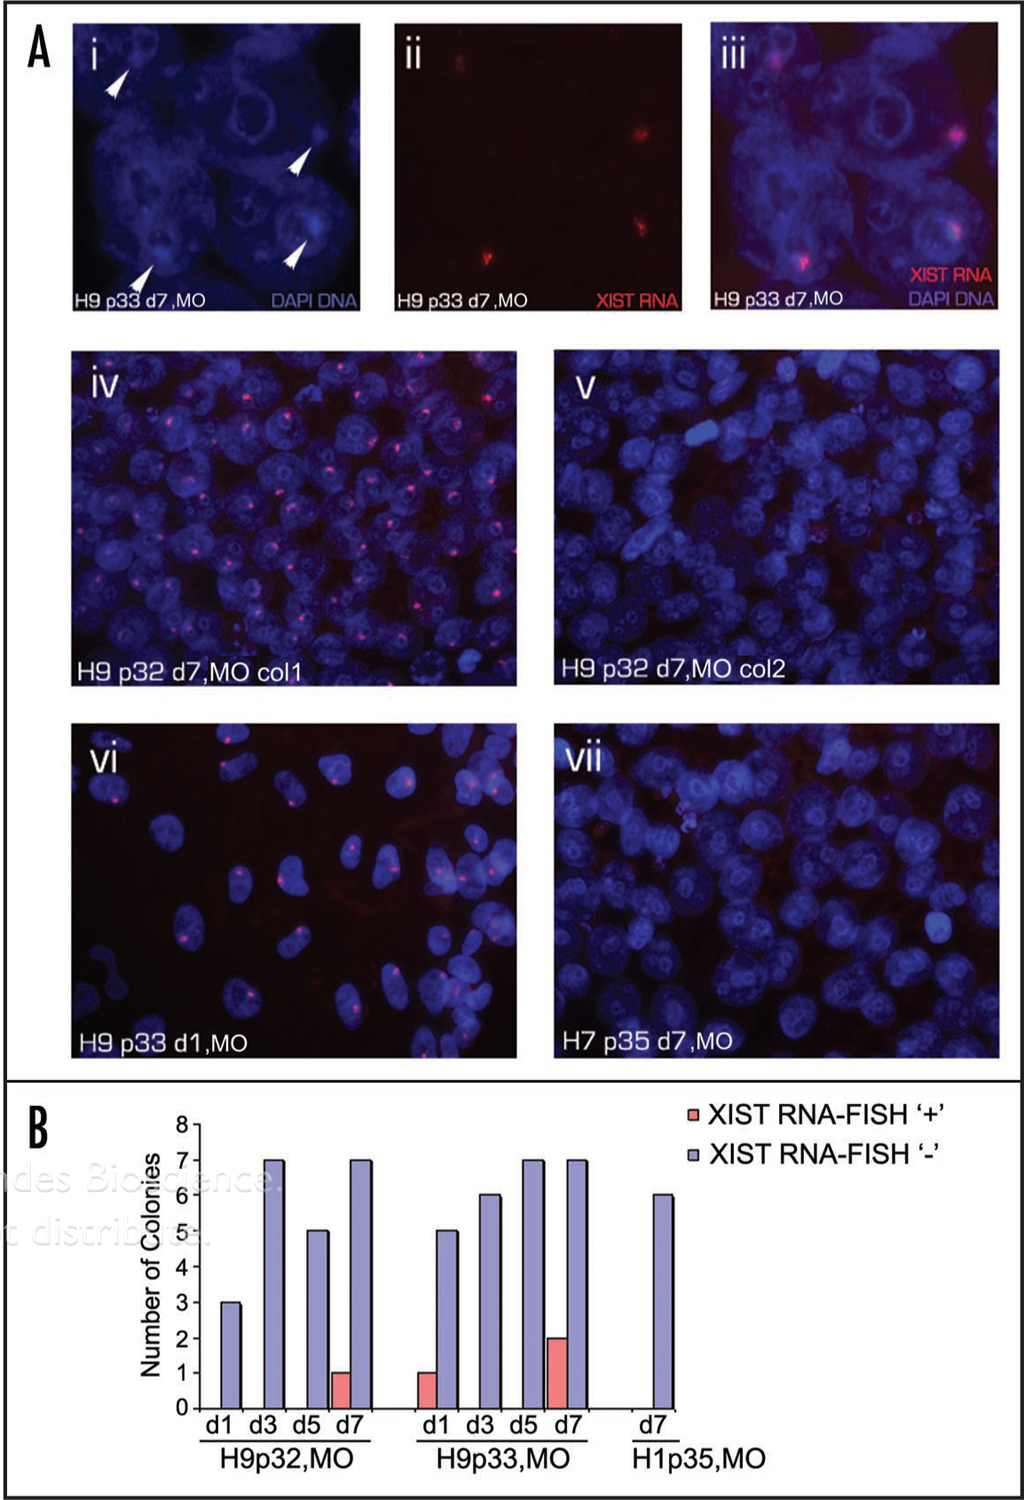
Colony-to-colony variation in XIST expression in H9 MO hESCs. (A) Example of H9 hESCs from passage 33 at day 7 showing DAPI stained Barr Body (i, arrows) that coincide with a single XIST RNA FISH signal marking the inactive X chromosome (ii and iii). A colony from H9 p32 d7 with an XIST RNA FISH signal in nearly every cell (iv) and an adjacent colony from the same culture that lacks XIST FISH signals (v). H9 cells from a colony from p33 at d1, with an XIST RNA FISH signal in each cell (vi) and a representative colony from another female line H7 with no Xi as judged by the lack of XIST RNA painting (vii) are also shown. (B) The number of H9 colonies that had XIST RNA FISH signals in virtually all cells (red bars) and colonies with no XIST (blue bars) counted in identically-prepared coverslip cultures at days 1, 3, 5 and 7 across two consecutive passages. Colonies of male hESC line H1 were used as a negative control for XIST FISH since male cells lack inactive X chromosomes.
We then performed RNA FISH for XIST on H9 cell cultures fixed at days 1, 3, 5 and 7 after passage over the course of two consecutive passages. On some coverslips, we detected colonies in which virtually every cell within that colony had a single XIST spot (Fig. 1B). However, other colonies (on the same coverslip) were devoid of XIST FISH signals. Overall, the XIST-negative colonies were by far the more frequent type. As expected, none of the analyzed colonies from hESC line H1 showed detectable XIST RNA-FISH signals, as expected for male cells.
To assess the variability of XCI in independent isolates of hESC line H9, we grew an isolate of H9 obtained from the University of Connecticut Stem Cell Core Lab (CT). We assayed the expression of XIST in hESC cultures from MO for both female cell lines (H9 and H7) and for the male hESC line H1. We detected robust expression of XIST in two samples of H9 (MO), while H7 and H1 lines showed much lower, but still detectable, levels of XIST expression during the course of the experiment (Fig. 2A). In contrast, none of the three CT-H9 isolates expressed detectable levels of XIST. Furthermore, the H9 isolate obtained from MO then grown in CT had lost the robust XIST expression (most likely at some point during the course of ~10 passages) (Fig. 2A). Expression of pluripotency marker OCT4 (encoded by the gene POU5F1) was strong and uniform in all samples throughout the experiment, as was ubiquitously expressed β-Actin (encoded by the ACTB gene) (Fig. 2A).
Figure 2.
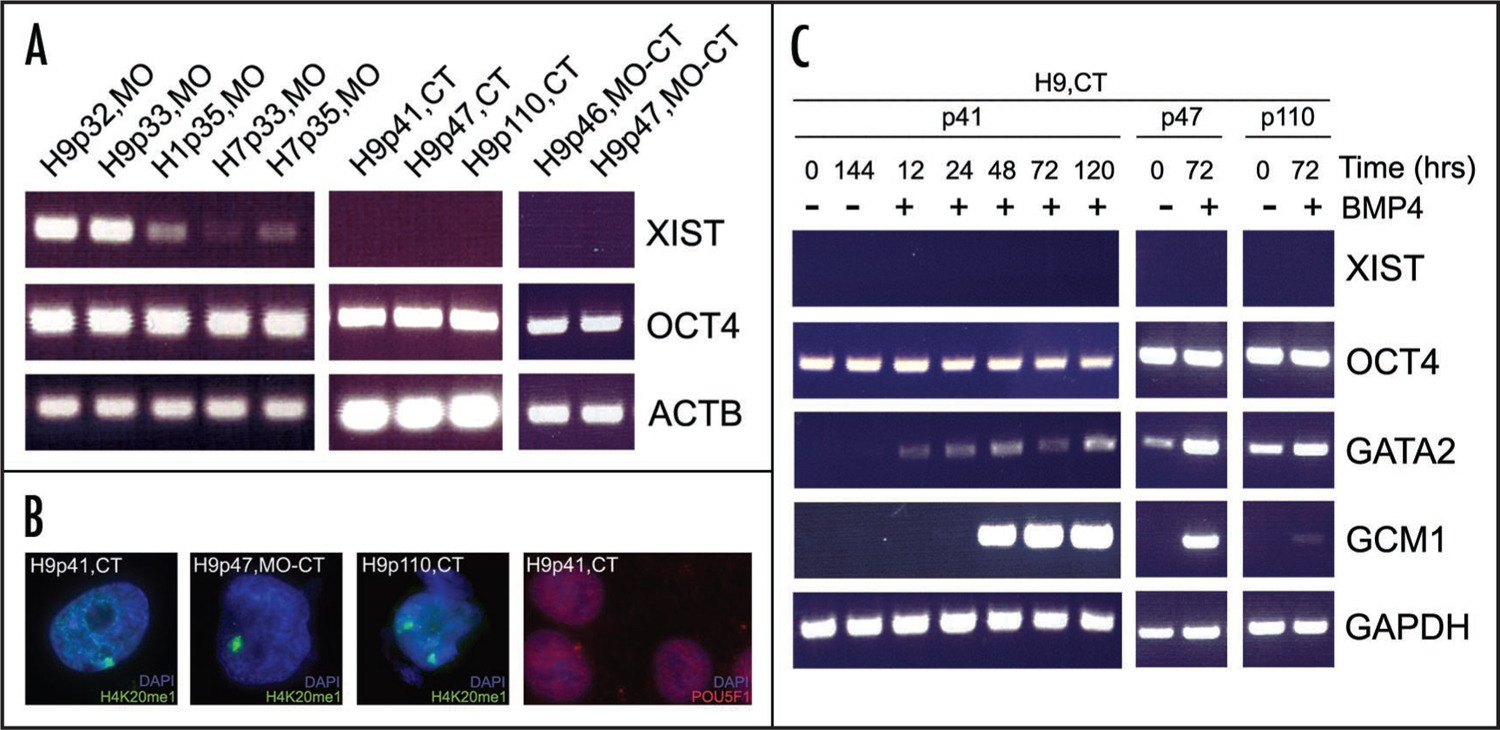
XIST expression variants arise during subculture of H9, and acquire altered response to BMP4. (A) RT-PCR demonstrated robust expression of XIST in low passage H9 MO hESCs during two consecutive passages. An assay from male hESC line H1 and samples from another female hESC line H7 showed lower, but detectable XIST expression levels across two passages. No XIST expression was detected in any of the H9 subcultures from CT. H9 isolates obtained from MO then subcultured in CT had lost the robust XIST expression. Pluripotency gene OCT4 was constitutively expressed in all samples, as was ubiquitously expressed ACTB control. (B) Immunocytochemistry in the XIST-negative isolates showed distinct foci enriched for the inactive X chromosome-specific post-translational histone modification, H4K20me1, while maintaining robust expression of the pluripotency marker OCT4. (C) BMP4 treatment of the XIST negative isolates of the CT-H9 hESCs induced differentiation into trophoblast, as judged by the upregulation of the trophoblast specific markers GATA2 and GCM1, with no detectable upregulation of XIST expression. Cultures were treated with BMP4 (+BMP4) for the indicated time periods, while the untreated cultures (-BMP4) were used as controls.
Early and late passage XIST-negative H9 isolates from CT (p41 and p110, respectively) showed cytological evidence of XCI as judged by immunofluorescence staining for the histone modification H4K20me1 (Fig. 2B), suggesting that these cells had progressed through the entire process of dosage compensation and subsequently lost XIST expression. A single subnuclear site of H4K20me1 enrichment was also detected in the H9 isolate from MO subsequently subcultured in CT (Fig. 2B). H4K20me1 staining in late passage (p110) H9 cells from CT showed two distinct foci (Fig. 2B). This isolate had apparently acquired an additional X chromosome, as judged by karyotype data (see below). Immunofluorescence for the pluripotency marker OCT4 in the H9 CT isolate showed robust signal with strict nuclear localization, demonstrating that OCT4 expression can be maintained in hESCs after precocious X chromosome inactivation has occurred (Fig. 2B).
To assess whether the unusual dosage compensation states had impaired the developmental potential of the XIST negative subcultures of H9, we performed targeted differentiation of hESCs with BMP4.21 All of the three XIST-negative H9 isolates from CT readily differentiated into cells with trophoblast-like morphology when treated with BMP4 (results not shown). In general, morphological changes in the BMP4 treated cells were accompanied by upregulation of the trophoblast lineage-specific markers GATA2 and GCM1 (Fig. 2C). However, late passage H9 cells (p110) showed markedly lower levels of GCM1 upregulation when treated with BMP4 and higher levels of GATA2 expression in the undifferentiated state as compared to samples from earlier passages.
We also investigated the expression of XIST at time points spanning two passages. To do this we used quantitative real-time PCR to provide accurate comparisons of XIST and OCT4 transcripts in samples from H1, H9 and H7 lines (Fig. 3). We normalized XIST RNA expression to that of GAPDH, while OCT4 expression was normalized to the expression of ACTB so as to match primer amplification efficiencies. Consistent with the FISH data reported above, XIST was expressed robustly in H9 cells of MO origin and weakly in the male line H1 (Fig. 3A). There was a slight increase in XIST expression immediately before and after passage (days 1 and 7, respectively), which correlated with lower expression of the pluripotency marker OCT4 on those days (Fig. 3A). In contrast, XIST expression in the female line H7 remained very low, while OCT4 expression remained uniformly high over the course of the experiment (Fig. 3B). In a third quantitative comparison, we found that XIST expression was lower in the female hESC line H7 than in the male line H1, a result consistent with a previous report that also found unexpectedly low levels of XIST in female line H7 cells.14 OCT4 expression was uniform throughout the course of this experiment (Fig. 3C).
Figure 3.
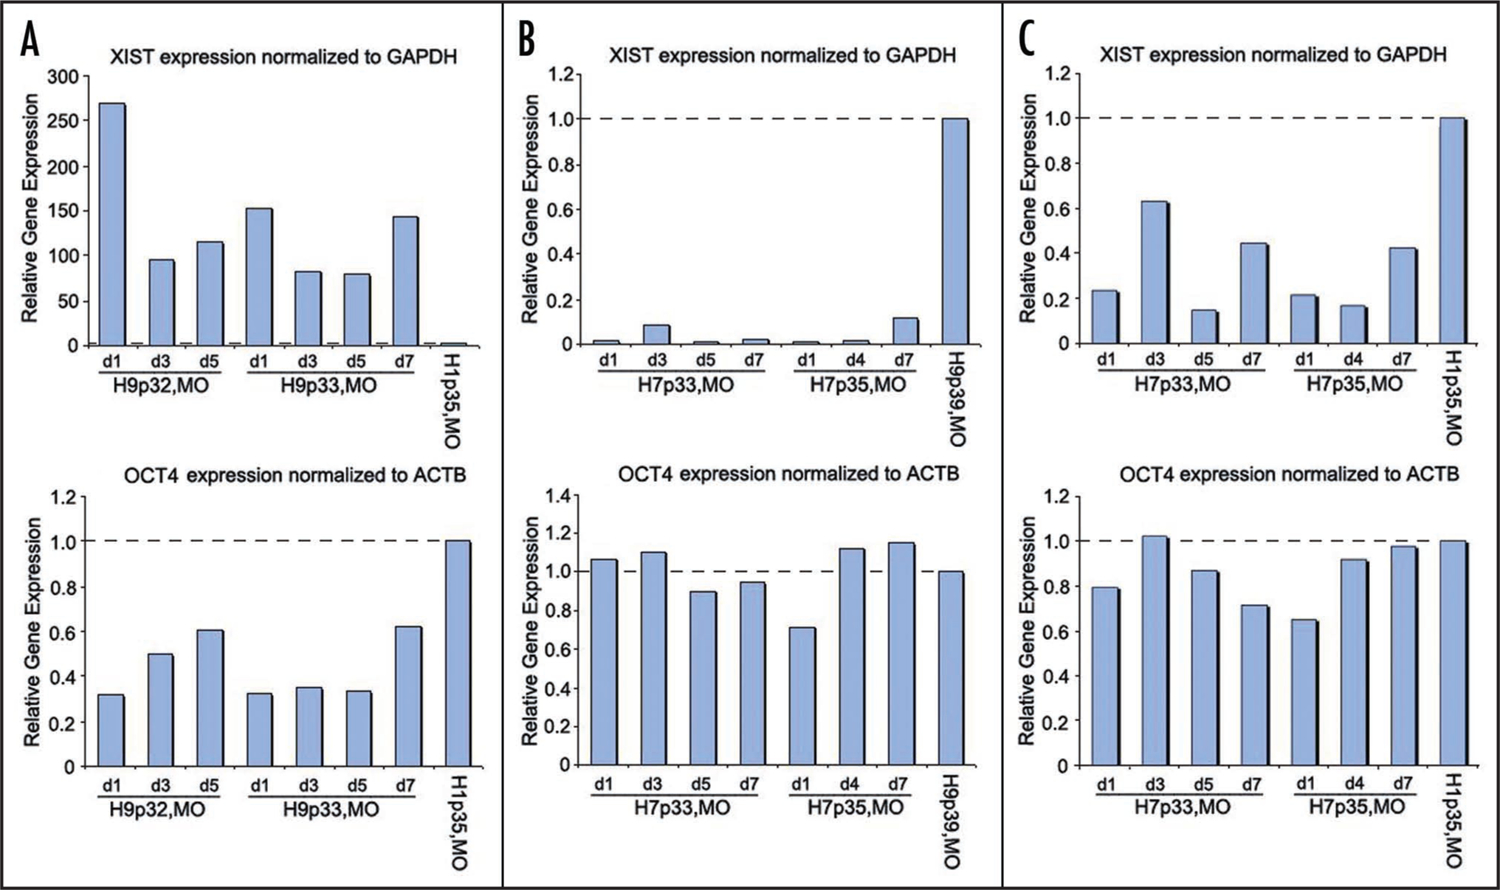
Relative expression levels of XIST and OCT4 in lines H9 and H7. (A) Quantitative real-time PCR assays of XIST and OCT4 expression from female hESC line H9 (University of Missouri subculture, MO) normalized to GAPDH and ACTB (respectively) and calibrated to an H1 p35 d7 reference sample set to a value of one. (B) Normalized XIST and OCT4 expression in female hESC line H7 calibrated to sample from H9 p39 d7 (set to a value of one). (C) Normalized XIST and OCT4 expression from female line H7 as compared to male line H1 (set to a value of one). All samples were run in technical triplicate.
We failed to detect XIST expression in H9 of CT origin (Fig. 2A). Furthermore, a large number of colonies of H9 of MO origin lacked XIST expression as judged by RNA FISH. Such results could be due either to very low or absent levels of transcription of the XIST gene itself, or by loss of an X chromosome, thus alleviating the need for dosage compensation. To distinguish between these possibilities, we performed assays to determine the number of X chromosomes present within female ES cell cultures. Karyotypes were prepared from 20 G-banded chromosome spreads from H9 cells from both sources (p55, MO and p42, CT). All cells from both isolates had two X chromosomes (Fig. 5A). Cytogenetic analyses for MO-H1 and H7 hESC cultures yielded normal male (46, XY) and female (46, XX) karyotypes, respectively (results not shown). An early passage (p37) CT-H9 isolate also had a normal female karyotype. However, a late passage isolate of H9-CT (>p100) yielded karyotypes with an additional X chromosome (47, XXX) in approximately two-thirds of the cells (results not shown). In addition, we confirmed the presence of single nucleotide polymorphisms (SNPs) for two X-linked genes (DMD and WDR44) in preparations of H9 DNA from multiple passages (Fig. 4B and Table S2), further supporting the stable presence of two X chromosomes in H9 cultures of both MO and CT origin. Stable XX sex chromosome content was also maintained in H9 cells grown under physiological oxygen conditions (4% O2) (Table S2). We conclude that lack of XIST expression is not simply due to the loss of the X chromosome.
Figure 5.
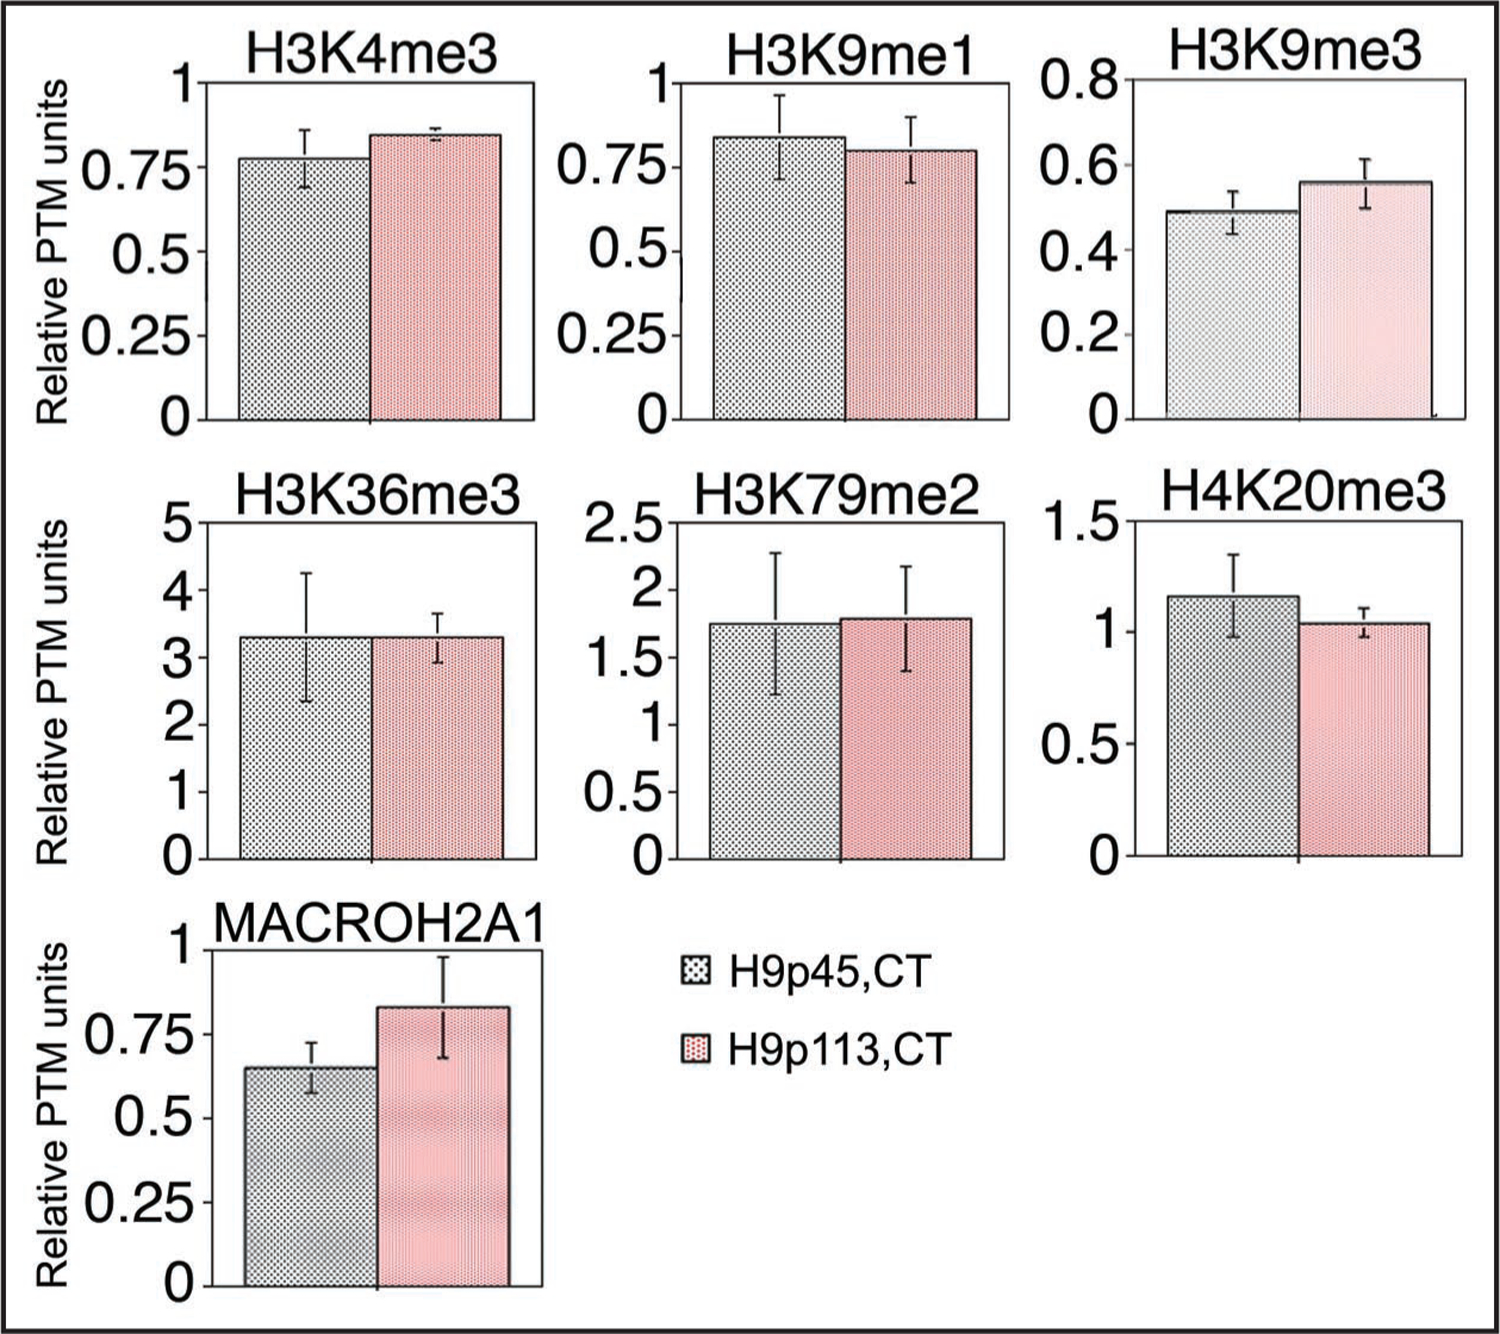
NU-ELISA profiles show little change in global histone modification levels in H9 hESCs subjected to prolonged culture. Steady-state levels of the six post-translational histone modification (PTMs) were determined for early and late passage (p45 and p113, respectively) isolates of the CT-H9 hESCs, as well as for the heterochromatin-specific histone variant MACROH2A1. Error bars represent standard deviations of four independent assays.
Figure 4.
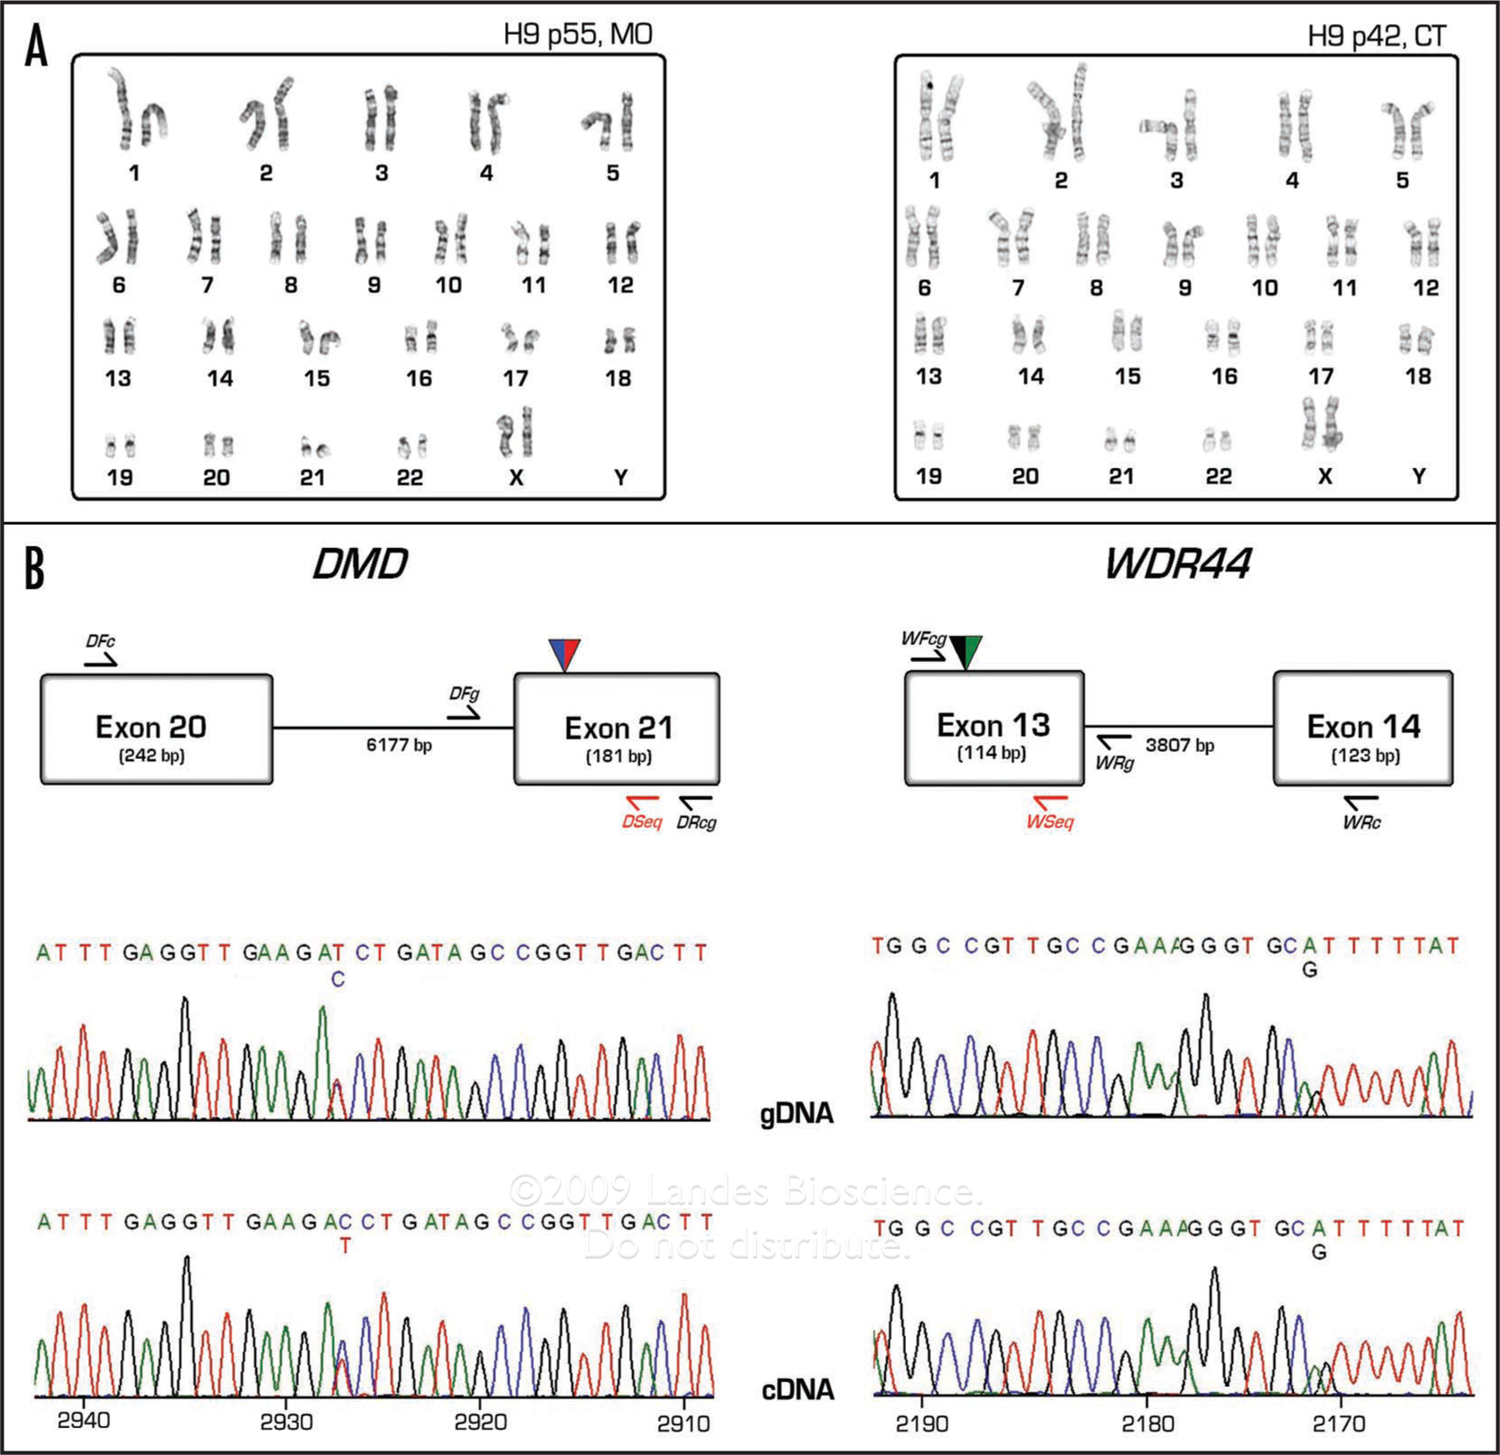
Cytogenetic analysis, SNP genotyping and SNP expression analysis of two X-linked genes from two isolates of H9 hESCs. (A) Karyotype analysis performed on 20 G-banded metaphase spreads of H9 hESCs from both MO and CT subcultures. (B) Partial exon/intron diagram of the two X-linked genes (DMD and WDR44) for regions containing the expressed SNPs (designated as dual colored triangles). Strategies used for PCR amplification of fragments encompassing SNPs from both genomic and complementary DNA are shown, with approximate primer locations depicted. Primers designated with “Seq” (in red) are used for direct sequencing of the PCR products. Also shown, examples of chromatogram traces for DMD and WDR44 (Numbers at the bottom of the cDNA traces represent nucleotide position relative to transcriptional start site).
The SNPs present within the X-linked DMD and WDR44 genes were also useful in allele-specific assays of X-linked gene expression since both of these SNPs reside in exons retained in mature RNAs. To perform allele-specific expression assays, we prepared RNA from H9 cells and amplified cDNA products using primers that flanked the expressed SNPs. Because these primers also span large introns, we could be confident that sequence-based detection of the expressed SNPs within purified RT-PCR products was not due to contaminating genomic DNA. The results indicated that both alleles of the DMD and WDR44 genes are transcribed in all H9 cultures analyzed (Fig. 4B and Table S2).
In order to test for the possibility of accumulation of aberrant epigenetic modifications during prolonged cultures of hESCs, we assessed global epiproteomic signatures in early (p45) and late (p113) H9 isolates (Fig. 5). We found no significant changes in the levels of transcriptionally-permissive (H3K4me3, H3K36me3) or repressive (H3K9me1, H3K9me3, H3K79me2, H4K20me3, MACROH2A1) epigenetic marks. We conclude that hESCs can be cultured to high passage number without major alterations in the relative levels of post-translational nucleosome modifications (PTMs) present in their chromatin.
Discussion
This study and others show that considerable variability exists for XIST expression in different hESC lines. In theory, this epigenetic variability could arise in two ways. First, hESCs are derived from preimplantation embryos, which normally execute rapid and dynamic changes in modification states of chromatin and cytosine methylation.22,23 Therefore, epigenetic variation among hESC lines could be caused by the retention of variable epigenetic states originally present among different preimplantation embryos. Alternatively, epigenetic variability in hESC lines could arise at the time of derivation, during the process of adaptation of ICM cells and their progeny to culture conditions, or in response to repeated passage, sub-cloning, freezing or exposure to sub-optimal culture conditions. This notion is supported by a recent study that found that XIST is expressed in early passage isolates of female cell line H7, but absent from later passage (adapted) cells, even when differentiated.24 Our results indicate that post-derivation effects are important contributors to epigenetic variability observed in hESCs since we observe differences in the status of XCI even within a single hESC culture and in H9 subcultures grown in different laboratories.
In this study, we confirmed that XIST is expressed in a culture isolate of undifferentiated H9 hESCs maintained at the University of Missouri (MO). A closer examination of the cells showed that this isolate of H9 contains a mixture of colony types: those in which virtually every cell within a colony contains a single XIST spot, and colonies in which every cell within a colony is devoid of apparent XIST expression (Fig. 1A). This mixed culture phenotype was maintained over the course of two passages examined at several time-points (Fig. 1). Analysis of three different culture isolates of H9, obtained from the University of Connecticut Stem Cell Core Lab (CT) revealed that each had extremely low XIST expression. We also attempted to isolate and subculture the XIST-positive colonies from early passage H9-MO cultures, but found that these lost XIST expression during continued culture (Fig. 2A), showing that hESCs can proceed from an XIST-positive to an XIST-negative state. In theory, the loss of one X chromosome in ES cells could alleviate the need for XIST expression and dosage compensation, but it is clear that differences in XIST expression observed in H9 isolates from MO and CT cannot be attributed to chromosome loss (Fig. 4A). Furthermore, we found heterozygosity for SNPs in two X-linked genes (DMD and WDR44) in all H9 samples analyzed, whether they originated from MO or from CT (Fig. 4B and Table S2). We also found no change in X chromosome content, as judged by SNP analysis, when cells were cultured under physiological as opposed to atmospheric oxygen conditions (Table S2). In addition, uniformly low levels of XIST expression observed in H7 female hESCs could not be ascribed to chromosome loss, since these cells also yielded normal female karyotypes (data not shown).
XIST-negative isolates exhibited subnuclear enrichment of the histone modification H4K20me1, a marker for the Xi. H9 CT isolates that had acquired an extra X chromosome during prolonged culture (47, XXX) contained two H4K20me1-dense regions in the majority of the cells (Fig. 2B), indicating the presence of two inactive X chromosomes and an advanced state of dosage compensation. These late passage cells may be somewhat compromised in their ability to differentiate since lower expression of the trophoblast marker GCM1 was observed when these cells were exposed to BMP4.
We also found that the X-linked genes DMD and WDR44 exhibit biallelic expression in all H9 isolates analyzed. In the case of the H9 MO subclone, the lack of monoallelic expression is not surprising since our expressed SNP analyses were conducted on RNA from cultures with colonies in which some are XIST-positive and others XIST-negative. We also found biallelic expression of DMD and WDR44 in H9 CT subcultures in which we never observed high level XIST expression. In a recent study, cultures of XIST-positive H9 cells exhibited monoallelic expression of DMD, while XIST negative cultures of the same cell line exhibited biallelic DMD expression. In contrast to our results, the same study demonstrated monoallelic expression of WDR44 regardless of the status of XIST expression.12 In another recent study, H9 subclones have been described that lacked detectable XIST RNA signals, but that apparently maintained X chromosome inactivation as judged by a Cot-1 RNA FISH exclusion zone (indicative of a region devoid of nascent transcription) centered over one of two X chromosomes.13 Together, the results show that XIST RNA expression and X chromosome inactivation status varies widely in different cultures of H9, and that some hESC cultures are effectively mosaic for XCI states.
Prolonged culture of the H9 hESCs that have spontaneously completed the process of XCI does not affect the global epiproteomic signatures of these cells (Fig. 5). In contrast, DNA methylation profiles can drift with continued culture of various hESC lines,7 and the degree of change in DNA methylation levels is roughly proportional to the number of passages. More studies are needed to determine if nucleosome modifications are more stable than CpG methylation in hESCs subjected to prolonged culture.
The presence of numerous epigenetic variants of line H9 proves that significant epigenetic drift can accumulate in hESC lines after cell line derivation. In the future, X chromosome inactivation status may serve as a useful biomarker to assess the effect of hESC culture conditions and cryopreservation methods on cellular epigenetic states. In addition, this study and others point to the need to derive and maintain new hESC lines that are monitored frequently for their epigenetic status. Furthermore, it would be useful to develop cell culture “pedigrees” for hESCs that accurately document passages, subcloning events, cryopreservation and distributions to independent laboratories in order to mitigate the use of undetected epigenetic variants. Epigenetic mosaicism in hESC cultures might render them problematic for future cell-based therapeutics since the implications of epigenetic lability for clinical applications are presently unknown.
Materials and Methods
Culture of hES cells, karyotype analyses and RNA extraction.
hESC lines H1 (NIH code WA01), H7 (WA07) and H9 (WA09) were purchased from WiCell Research Institute (Madison, WI). For the experiments described, cells were maintained in feeder-free culture on medium [20% Knockout Serum Replacement in DMEM/F12, supplemented with 1% nonessential amino acids, 1 mM L-glutamine, 0.1 mM β-mercaptoethanol (β-ME) and 4 ng/ml of basic fibroblast growth factor (bFGF) (PeproTech)] conditioned by mouse embryonic fibroblasts (MEFs),25 and grown on coverslips placed in a 6-well tissue culture plates (Nunc) coated with poly-D-lysine plus Matrigel (Becton Dickinson) diluted 1:30 in Dulbecco’s Modified Eagle Medium Nutrient Mix F12 (DMEM/F12) (Invitrogen). Cultures were maintained under a humidified atmosphere at settings of 4% O2/5% CO2/91% N2 in a HERAcell 150 Tri-Gas Cell Culture Incubator (Thermo Electron Corporation) at 37°C in order to minimize spontaneous differentiation in the culture.26 Oxygen levels, measured by using a Bacharach CO2/O2 Analyzer (Bacharach, Model 2830, New Kensington, PA), were 3.1–3.4% O2 throughout the course of experiments. Colonies were dispersed by using 1 mg/ml collagenase IV (Invitrogen) at 1:6 ratio at day 7 from the previous passage. RNA was isolated from hESCs growing on coverslips by using RNA STAT-60 reagent (Tel-Test Inc., Friendswood, TX) according to the manufacturer’s instructions. Coverslips were removed from tissue culture plates immediately before the RNA extraction so that hESCs growing on plastic surfaces were excluded. Total purified RNA was quantified on a Nanodrop ND-1000 Spectrophotometer (Nanodrop).
H9 hESC isolates (obtained from University of Connecticut Stem Cell Core Lab) were cultured on the layer of DR4 MEFs mitotically-inactivated with Mitomycin C (Sigma) in hESC medium containing 20% Knockout Serum Replacement in DMEM/F12, supplemented with 1% nonessential amino acids, 1 mM L-glutamine, 0.1 mM β-ME and 5 ng/ml of basic fibroblast growth factor (bFGF) (all from Invitrogen, except β-ME (Sigma)). Cells were maintained in a 37°C humidified atmosphere at 5% CO2 in air. Total RNA was isolated from each of the three CT isolates using RNeasy Mini Kit (Qiagen) following manufacturer’s instructions. Total purified RNA was quantified on a Nanodrop ND-1000 Spectrophotometer.
Karyotype analyses were performed on G-banded metaphase chromosome spreads from 20 randomly chosen cells from H1 cultures at passage 53 (p53), H7 cultures at p50, and H9 cultures at both p29 and p55 (i.e., before and after the experiments performed in this report); all grown in Missouri (MO). Karyotype analyses were performed on all three cultures of H9 grown in Connecticut (p37, p42 and p100).
RNA fluorescence in situ hybridization and immunofluorescence.
An XIST RNA FISH probe was prepared from cDNA-EST clone DKFZp686K10163Q (Fig. S1) obtained from RZPD (German Resource Center for Genome Research). A 5,106 bp fragment consisting entirely of XIST cDNA was excised from the vector plasmid using XhoI and KpnI restriction enzymes (New England Biolabs), and the fragment was extracted from the gel with a QIAquick Gel Extraction Kit (Qiagen). A FISH probe was labeled as follows: 250 ng of purified cDNA was labeled by annealing random octamer primers to the denatured cDNA (100°C for 5 min), followed by extension with Klenow fragment (BioPrime DNA Labeling System, Invitrogen) in the presence of Cy3-dCTP (GE Healthcare) at concentration of 10 μM. The probe was then precipitated with salmon sperm DNA, Cot-1 DNA (both Invitrogen) and yeast tRNA (Sigma) and resuspended in Hybrisol VII (Qbiogene) at the concentration of approximately 0.5 ng/μl.
Cells grown on poly-D-lysine plus Matrigel-coated coverslips were collected from 6-well tissue culture plates at selected time-points during culture and rinsed in a series of prehybridization washes: 1x PBS for 30 sec on ice, cytoskeletal (CSK) buffer (100 mM NaCl, 300 mM sucrose, 3 mM MgCl2, and 10 mM PIPES, pH 6.8) for 30 sec on ice, CSK buffer plus 0.5% Triton X-100 (Sigma-Aldrich) for another 30 sec on ice and a final wash of 30 sec in CSK buffer only. Cells were then fixed in 4% paraformaldehyde for 10 min at room temperature and stored at 4°C in 70% ethanol for the subsequent FISH analysis. For FISH analysis, fixed cells were dehydrated with sequential washes of 80, 90 and 100% ethanol, and hybridized with 10 μl of the resuspended probe per coverslip overnight at 37°C in 50% formamide (Ambion)/2x SSC (Qbiogene). Coverslips were then washed at 39°C, with agitation for 3 × 5 min in 50% formamide/2x SSC, 3 × 5 min in 2x SSC, 1 × 10 min in 1x SSC, 1 × 5 min in 4x SSC, and 1 × 10 min in 4x SSC/0.2% Tween 20/DAPI (1 ng) at room temperature, and finally in 4x SSC for 5 min before mounting the coverslips for fluorescence microscopy using Vectashield Mounting Media (Vector Laboratories).
Immunofluorescence was performed on cells that were cytospun onto poly-L-lysine coated slides, following the same permeabilization and fixation protocol as for the RNA-FISH. Slides were incubated overnight at 4°C with primary antibody (H4K20me1 or OCT4 both from Abcam). Secondary antibodies AlexaFluor 488 donkey anti-rabbit IgG (for H4K20me1) and AlexaFluor 594 goat anti-rabbit (for OCT4) were used at 1:500 dilutions with incubation at 37°C for 1 hour. Nuclei were stained with DAPI.
Reverse transcription- and quantitative-polymerase chain reaction.
cDNA was synthesized from purified total RNA primed with random hexamers by using the SuperScript III First-Strand Synthesis System for RT-PCR (Invitrogen). Single-stranded cDNA was purified using a QIAquick PCR Purification Kit (Qiagen). RT-PCR reactions were performed with GoTaq Flexi DNA Polymerase (Promega), with the following amplification conditions: 1 cycle at 94°C for 2 min, 35 cycles at 94°C for 30 sec, 60°C for 30 sec and 72°C for 1 min, followed by an additional 1 cycle of extension step at 72°C for 5 min. Quantitative PCR (qPCR) was performed by using SYBR Green PCR Master Mix (Applied Biosystems) in 7500 Fast Real-Time PCR System following manufacturer recommended thermal cycling parameters: 1 cycle at 50°C for 2 min, 1 cycle at 95°C for 10 min, 40 cycles at 95°C for 15 sec, 60°C for 1 min. Data were analyzed by means of a comparative CT method for relative quantification (2−ΔΔCt).27 XIST expression was normalized to GAPDH, while OCT4 expression was normalized to ACTB because of the similar primer amplification efficiencies of the target and endogenous (reference) control. Primer sequences are listed in Table S1.
BMP4-induced differentiation.
H9 CT hESC isolates from all three different passages were cultured on Matrigel coated dishes in MEF conditioned media (CM) supplemented with 5 ng/ml of bFGF. BMP4 (R&D Systems) was used at the concentration of 100 ng/ml in the cultures with continued presence of CM and bFGF. Total RNA was extracted at designated time points and RT-PCR was performed as described above. Primer sequences are listed in Table S1.
SNP genotyping and allele-specific gene expression of X-linked genes in H9 hESCs.
Single nucleotide polymorphisms (SNPs) of X-linked genes in H9 hESCs were identified from a recently published report.12 Of these SNPs, we found two that mapped to exons of the genes DMD and WDR44 (SNP IDs: rs228406 and rs10521584, respectively) by comparing sequence flanking each SNP (as reported in the NCBI SNP database) to mature mRNA sequence (as reported in the Ensembl Human Genome Database). In addition, the presence of these SNPs within exons was confirmed by inspection of the GeneCards Database (Crown Human Genome Center at the Weizmann Institute of Science, Israel). We confirmed the presence of SNPs by PCR amplifying and sequencing genomic DNA (gDNA) extracted from cultures of H9 hESCs from both labs (MO and CT). MO samples were cultured under both atmospheric (20% O2) and physiological (4% O2) conditions, and gDNA was extracted from cultures from two different passages (p48 and p54) using Wizard SV Genomic DNA Purification System (Promega). gDNA from H9 p47 cells cultured in CT was extracted by using a Qiagen DNeasy kit. For genotyping of the DMD gene, gDNA was amplified by PCR by using the primers DFg and DRcg, followed by sequencing with the primer DSeq (Fig. 5B). Allele-specific expression assays for DMD were performed by reverse transcription of RNA followed by amplification of cDNA with intron-spanning primers DFc and DRcg to yield an RT-PCR product of predicted size, followed by sequencing with primer DSeq to detect expressed SNPs. The WDR44 gene was analyzed by a similar strategy with the primers WFcg and WRg (for gDNA amplification), followed by sequencing with primer WSeq. Expressed WDR44 SNPs were assayed by preparing an RT-PCR product using intron-spanning primers WFcg and WRc, followed by sequencing with primer Wseq. Primer sequences are listed in Table S1.
Nucleosome-enzyme-linked immunosorbent assay (NU-ELISA).
Nucleosome preparations and NU-ELISA were performed as previously described.20 Antibodies used in this assay are listed in Table S3. Relative assay levels for nucleosome post-translational modifications (PTMs) were calculated by normalizing PTM ELISA signals (after background subtraction) to core histone H2A content. Results represent a mean of four independent biological replicates (Table S4).
Supplementary Material
Acknowledgements
This research was supported by Connecticut Stem Cell Research Grant 06SCA034 (T.P.R.) and by NIH grants HD 42201 and 21896 (R.M.R. and T.E.) and AG 023687 (T.P.R.). The contents of the paper are solely the responsibility of the authors and do not necessarily represent the official views of the State of Connecticut, the Department of Public Health of the State of Connecticut, or Connecticut Innovations, Incorporated. We thank Therese Doherty for the proof reading of this article.
Footnotes
Supplementary materials can be found at: www.landesbioscience.com/supplement/TanasijevicEPI4-5-Sup.pdf
References
- 1.Thomson JA, Itskovitz-Eldor J, Shapiro SS, Waknitz MA, Swiergiel JJ, Marshall VS, et al. Embryonic stem cell lines derived from human blastocysts. Science 1998; 282:1145–7. [DOI] [PubMed] [Google Scholar]
- 2.Trounson A. The production and directed differentiation of human embryonic stem cells. Endocr Rev 2006; 27:208–19. [DOI] [PubMed] [Google Scholar]
- 3.Meshorer E, Misteli T. Chromatin in pluripotent embryonic stem cells and differentiation. Nat Rev Mol Cell Biol 2006; 7:540–6. [DOI] [PubMed] [Google Scholar]
- 4.Adewumi O, Aflatoonian B, Ahrlund-Richter L, Amit M, Andrews PW, Beighton G, et al. Characterization of human embryonic stem cell lines by the International Stem Cell Initiative. Nat Biotechnol 2007; 25:803–16. [DOI] [PubMed] [Google Scholar]
- 5.Liu Y, Shin S, Zeng X, Zhan M, Gonzalez R, Mueller FJ, et al. Genome wide profiling of human embryonic stem cells (hESCs), their derivatives and embryonal carcinoma cells to develop base profiles of U.S. Federal government approved hESC lines. BMC Dev Biol 2006; 6:20. [DOI] [PMC free article] [PubMed] [Google Scholar]
- 6.Sperger JM, Chen X, Draper JS, Antosiewicz JE, Chon CH, Jones SB, et al. Gene expression patterns in human embryonic stem cells and human pluripotent germ cell tumors. Proc Natl Acad Sci USA 2003; 100:13350–5. [DOI] [PMC free article] [PubMed] [Google Scholar]
- 7.Bibikova M, Chudin E, Wu B, Zhou L, Garcia EW, Liu Y, et al. Human embryonic stem cells have a unique epigenetic signature. Genome Res 2006; 16:1075–83. [DOI] [PMC free article] [PubMed] [Google Scholar]
- 8.Kim KP, Thurston A, Mummery C, Ward-van Oostwaard D, Priddle H, Allegrucci C, et al. Gene-specific vulnerability to imprinting variability in human embryonic stem cell lines. Genome Res 2007; 17:1731–42. [DOI] [PMC free article] [PubMed] [Google Scholar]
- 9.Ray PF, Winston RM, Handyside AH. XIST expression from the maternal X chromosome in human male preimplantation embryos at the blastocyst stage. Hum Mol Genet 1997; 6:1323–7. [DOI] [PubMed] [Google Scholar]
- 10.Dhara SK, Benvenisty N. Gene trap as a tool for genome annotation and analysis of X chromosome inactivation in human embryonic stem cells. Nucleic Acids Res 2004; 32:3995–4002. [DOI] [PMC free article] [PubMed] [Google Scholar]
- 11.Hall LL, Byron M, Butler J, Becker KA, Nelson A, Amit M, et al. X-inactivation reveals epigenetic anomalies in most hESC but identifies sublines that initiate as expected. J Cell Physiol 2008; 216:445–52. [DOI] [PMC free article] [PubMed] [Google Scholar]
- 12.Shen Y, Matsuno Y, Fouse SD, Rao N, Root S, Xu R, et al. X-inactivation in female human embryonic stem cells is in a nonrandom pattern and prone to epigenetic alterations. Proc Natl Acad Sci USA 2008; 105:4709–14. [DOI] [PMC free article] [PubMed] [Google Scholar]
- 13.Silva SS, Rowntree RK, Mekhoubad S, Lee JT. X-chromosome inactivation and epigenetic fluidity in human embryonic stem cells. Proc Natl Acad Sci USA 2008; 105:4820–5. [DOI] [PMC free article] [PubMed] [Google Scholar]
- 14.Hoffman LM, Hall L, Batten JL, Young H, Pardasani D, Baetge EE, et al. X-inactivation status varies in human embryonic stem cell lines. Stem Cells 2005; 23:1468–78. [DOI] [PubMed] [Google Scholar]
- 15.Doherty AS, Mann MR, Tremblay KD, Bartolomei MS, Schultz RM. Differential effects of culture on imprinted H19 expression in the preimplantation mouse embryo. Biol Reprod 2000; 62:1526–35. [DOI] [PubMed] [Google Scholar]
- 16.Khosla S, Dean W, Brown D, Reik W, Feil R. Culture of preimplantation mouse embryos affects fetal development and the expression of imprinted genes. Biol Reprod 2001; 64:918–26. [DOI] [PubMed] [Google Scholar]
- 17.Mann MR, Lee SS, Doherty AS, Verona RI, Nolen LD, Schultz RM, et al. Selective loss of imprinting in the placenta following preimplantation development in culture. Development 2004; 131:3727–35. [DOI] [PubMed] [Google Scholar]
- 18.Watkins AJ, Platt D, Papenbrock T, Wilkins A, Eckert JJ, Kwong WY, et al. Mouse embryo culture induces changes in postnatal phenotype including raised systolic blood pressure. Proc Natl Acad Sci USA 2007; 104:5449–54. [DOI] [PMC free article] [PubMed] [Google Scholar]
- 19.Jacob S, Moley KH. Gametes and embryo epigenetic reprogramming affect developmental outcome: implication for assisted reproductive technologies. Pediatr Res 2005; 58:437–46. [DOI] [PubMed] [Google Scholar]
- 20.Dai B, Rasmussen TP. Global epiproteomic signatures distinguish embryonic stem cells from differentiated cells. Stem Cells 2007; 25:2567–74. [DOI] [PubMed] [Google Scholar]
- 21.Xu RH, Chen X, Li DS, Li R, Addicks GC, Glennon C, et al. BMP4 initiates human embryonic stem cell differentiation to trophoblast. Nat Biotechnol 2002; 20:1261–4. [DOI] [PubMed] [Google Scholar]
- 22.Reik W, Dean W, Walter J. Epigenetic reprogramming in mammalian development. Science 2001; 293:1089–93. [DOI] [PubMed] [Google Scholar]
- 23.Li E Chromatin modification and epigenetic reprogramming in mammalian development. Nat Rev Genet 2002; 3:662–73. [DOI] [PubMed] [Google Scholar]
- 24.Enver T, Soneji S, Joshi C, Brown J, Iborra F, Orntoft T, et al. Cellular differentiation hierarchies in normal and culture-adapted human embryonic stem cells. Hum Mol Genet 2005; 14:3129–40. [DOI] [PubMed] [Google Scholar]
- 25.Xu C, Inokuma MS, Denham J, Golds K, Kundu P, Gold JD, et al. Feeder-free growth of undifferentiated human embryonic stem cells. Nat Biotechnol 2001; 19:971–4. [DOI] [PubMed] [Google Scholar]
- 26.Ezashi T, Das P, Roberts RM. Low O2 tensions and the prevention of differentiation of hES cells. Proc Natl Acad Sci USA 2005; 102:4783–8. [DOI] [PMC free article] [PubMed] [Google Scholar]
- 27.Livak KJ, Schmittgen TD. Analysis of relative gene expression data using real-time quantitative PCR and the 2(-Delta Delta C(T)) Method. Methods 2001; 25:402–8. [DOI] [PubMed] [Google Scholar]
Associated Data
This section collects any data citations, data availability statements, or supplementary materials included in this article.